GOLD $GC XAUUSD Target Hit - UpdateTraders and Investors,
W pattern completed as expected and posted about a few days ago. This has given us a great long swing opportunity and then several long and short opportunities on smaller time frames. We have been trading around the levels and zones taking one of them at a time. Whereas one swing long position has been running for this W pattern completion target.
When W pattern completes the market take a correction, this is why today price fell a bit from the FCP zone as expected. It is now consolidating. Lets see if see a further correction or a breakout in the NY session.
Trade what you see, wait for the confirmations and manage the risk as always.
Follow for more. Please support this analysis by liking, commenting, and sharing with friends, colleagues, traders, and trading communities. Thanks👍🙂
Fcpstrategy

GOLD $GC Levels and Patterns AnalysisTraders and Investors,
Gold (XAUUSD) has been consolidating mostly but still has been giving a lot of great short term and swing trade opportunities.
I have updated the important levels and zones which can act as support and resistance. They should guide us a bit for the best possible trade opportunities.
There as possible W pattern forming. It has not formed or completed yet. It must first break the trend line and confirm the break. BTW, that trend line can also give us a good opportunities around it. Next, the price has to break the mid point of potential W pattern. Once it has done that, it can complete the W pattern.
Trade what you see, wait for the confirmations and manage the risk as always.
Follow for more. Please support this analysis by liking, commenting, and sharing with friends, colleagues, traders, and trading communities. Thanks👍🙂

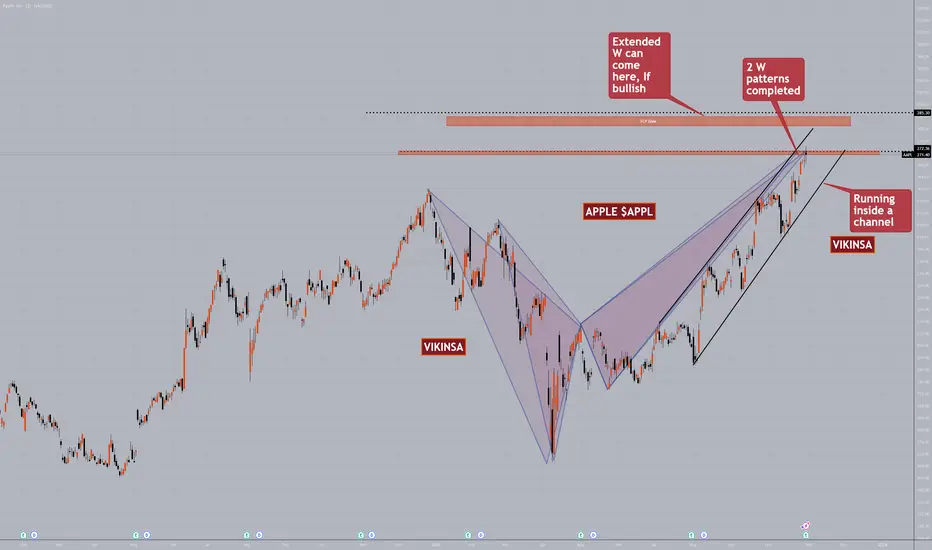
Is APPLE $APPL ready and primed for a correction?Apple BSE:APPL had a great run so far in the past few weeks. It has also been running inside a channel which has pushing the price upwards. However, now it has just completed an extended W pattern. In fact 2 of them got completed exactly at the same level.
The current price level is something that needs to eb watched very closely. When W patterns complete, markets tend to have a correction. Market is still bullish and is still inside the channel so even if the correction comes, we will have to be careful with the shorts.
If the market stay bullish from this point above at least on daily/weekly basis then we have an upper FCP zone where it can reach possibly take a correction from there.
In all cases, we must remember to wait for confirmations and obviously manage the risk.
EURNZD Trade PlanEURNZD has completed a W FCP pattern but did not reverse. It is now at a structure resistance level which can make it fall. Wait for sell confirmation. If that comes this can be a good short opportunity.
If the price breaks and confirms the previous high, we will go long based on the confirmation.
If you found this interesting please consider supporting this analysis by liking, commenting, and sharing with friends, colleagues, traders, and trading communities. Thanks👍🙂

EURCAD Can Fall Fall Further DownThe last standard W pattern had failed. EURCAD completed an extended W pattern. It showed some rejection from the top. We have a support level in there. If this support levels is broken and confirmed with a bearish signal, we can see a good short opportunity. Targets are on the screen:
If you found this interesting please consider supporting this analysis by liking, commenting, and sharing with friends, colleagues, traders, and trading communities. Thanks👍🙂

AUDCHF Possible BUY AreaAUDCHF completed a W FCP pattern. This made the price fall. It has fallen hard and could possible be going towards the area where we have confluence of an FCP zone and 2 trend lines. This can be a good Buy area for a possible bounce up.
As always wait for the confirmation on the smaller time frame.
If you found this interesting please consider supporting this analysis by liking, commenting, and sharing with friends, colleagues, traders, and trading communities. Thanks👍🙂

USDCHF Zone To Watch Out ForUSDCHF is at a resistance zone. If the market make it a support zone and gives a bullish confirmation above it, it can be a good buying opportunity.
At the moment it is at resistance level so if you want to go long, you must wait for a proper confirmation. Remember Buy at support and Sell at resistance :)
If you found this interesting please consider supporting this analysis by liking, commenting, and sharing with friends, colleagues, traders, and trading communities. Thanks👍🙂

NZDUSD Can Rise From The FCP Zone & M PatternNZDUSD Can Rise From The FCP Zone & M Pattern
As the chart indicates, we have an M pattern completion along with and FCP zone on the daily time frame. Wait for a confirmation based entry on smaller time frames. This can be a good day trade or swing trade opportunity depending on your trading plan.
If you found this interesting please consider supporting this analysis by liking, commenting, and sharing with friends, colleagues, traders, and trading communities. Thanks👍🙂

AUDUSD W pattern completion - Can FallAUDUSD has reached an area where it has completed a complex W pattern. There are a few levels and zones (as on the chart) to be watched.
When W pattern completes, a correction comes. This idea is on the daily time frame, so wait for a confirmation on smaller time frame to execute trades.
If you found this interesting please consider supporting this analysis by liking, commenting, and sharing with friends, colleagues, traders, and trading communities. Thanks👍🙂

USDJPY Higher Time Frame AnalysisJapanese Yen collapse continues with its lowest closing price in 34 years. If it falls through 160, it will be the lowest level against the U.S. Dollar since the 1980s. It can get even worse. Let's look at some charts:
1. We are currently sitting at 160 resistance level where a W FCP pattern is completed which can give us a correction. This is the last level which is preventing the USDJPY from slingshotting upwards.
2. A CUP formation is happening at the moment (rounding bottom). So if the correction comes at the current levels, that can make this a Cup and Handle pattern.
3. If the correction does not occur or we get a shallow one, these current levels can become a new support which can push USDJPY higher once confirmed.
4. There are several gaps left in 1980s. I posted about these gaps in my previous post approximately 7 months ago, indicating that USDJPY would be bullish.
5. These are the levels where in the long run USDJPY can go to complete a big W pattern.
This can have a huge impact on the #dollar index (DXY) too.
I recently did a premium analysis report on USDJPY and DXY (dollar index) for a client which has a more in-depth analysis and potential target zones/levels. Get in touch with me via DM if you want to order a copy of that report.
If you found this interesting please consider supporting this analysis by liking, commenting, and sharing with friends, colleagues, traders, and trading communities. Thanks👍🙂

USOIL Higher Time Frame Possible Bullish ScenarioThis is higher time frame bullish scenario on USOIL (WTI). This is only applicable if a bullish breakout occurs.
1. The price is inside a triangle which is getting squeezed and reaching its apex. That means we are going to have a breakout very soon.
2. Recently the price completed and M pattern and jumped higher. When M pattern completes the market goes higher.
3. If we get a bullish breakout from this triangle and if this breakout confirms, we can have formation of a potential W pattern. This when completed will have the potential to make oil fall again.
4. After that if the price stays bullish or becomes bullish again, we have a gap available around 100 area which needs to be filled at subpoint.
5. That will also lead us into a bigger multiple month and possibly multi year bullish formation of a W pattern.
But first, we need to see how price breaks out of the triangle.
If you found this post useful or information please support this analysis by liking and sharing. 👍✔ Also us for more.

GBPUSD - Watch 1.3 round number and LevelsGBPUSD had an explosive move last week. This was mainly due to a fall in USDJPY from a resistance level that I shared. See the attached chart. This made DXY fall and most of the USD based pairs felt the impact of that. Now GBP use is back in a possible resistance area. Watch out for a W pattern and these levels.
If you found this post useful or information please support this analysis by liking and sharing. 👍✔ Also us for more.

EURCAD W pattern Completion - Can FallEURCAD is near W pattern completion. This has been a complex W pattern in formation which usually gives a good pull backs.
This is a swing trade idea, so wait for a proper confirmation before going short.
If you found this post useful or information please support this analysis by liking and sharing. 👍✔ Also us for more.

NVDA Can Fall NVDA Can Fall:
NVIDIA hit the 161.8 Fibonacci extension and took a little correction. It has been consolidating for some time but also forming a diamond pattern. Although this pattern is not one of the strongest, if it plays out, the market can fall below the FCP zone. Or even the previous high level with a 200sma (daily time frame) confluence and trend line.
This can have a knock-on effect on NASDAQ 100 (US100).
Something to watch out for.
If you found this post useful or information please support this analysis by liking and sharing. 👍✔ Also us for more.

$PYPL Can Rise #PayPalOne of the fallen super heroes of one time has broken through 5 year lows. At this moment in time, the price is getting ready to reach an FCP zone which can be a potentially very good idea to buy or accumulate.
Please support this analysis by liking and sharing. 👍🙂
Rules:
1. Never trade too much
2. Never trade without a confirmation
3. Never rely on signals, do your own analysis and research too
✅ If you found this idea useful, hit the like button, subscribe and share it in other trading forums.
✅ Follow me for future ideas, trade setups, and updates on this analysis
✅ Don't hesitate to share your ideas, comments, opinions, and questions.
Take care and trade well
-Vik
____________________________________________________
📌 DISCLAIMER
The content of this analysis is subject to change at any time without notice and is provided for the sole purpose of education only.
Not financial advice or signal. Please make your own independent investment decisions.
____________________________________________________

#CryptoMarketCap Analysis #Crypto $BTCTraders and Investors, Let's talk about the crypto market. There has been a lot of discussion lately about each and every little move that Bitcoin makes. A little move up sends bullish sentiments and over-the-moon projections across social media. Whereas a downward move creates despair. 🙂 This has been going on for weeks and months.
So let's see what has been happening to the crypto market overall.
1. Crypto market capitalization reached an all-time high of approximately around 3 Trillion
2. As with all hype, what goes up must come down, it took a massive correction finally.
3. This created a major M pattern on the weekly/monthly time frames which is quite evident. In fact, there are 2 M patterns.
4. Once the M pattern completes, the market goes up so it started bouncing up.
5. It reached its one target exactly at 23.6 Fibonacci
6. It then took a correction again from there which was quite understandable and expected
7. Now this is simply consolidating in a range which has its mid-set at 1 Trillion market cap. This can keep going on for a long time and is a common behaviour after a huge move followed by a 23.6 correction.
So what is next?
1. There will be a breakout from this range at some point.
2. But usually it first creates a major trap on one side and then goes to the other.
3. So wait for a move which will make nearly everyone think in one direction. This will create a major bias (general consensus) 🙂
4. Start thinking in the opposite direction unless you get a piece of solid evidence or confirmation to follow the general consensus. Remember a market can do anything. If BTC could go from 3500 to 67000 in a matter of weeks and if USOIL can go to zero then anything can happen in a market.
5. The upper breakout can take it to 1.6 market cap level
6. Lower breakout can take it to 500 billion market cap.
Our bias: (Not advice or recommendation)
1. Wait for a general consensus to build up and go against it on confirmation
2. Downside is more likely at the moment but we will have to wait for further evidence.
Please support this analysis by liking and sharing. 👍🙂
Rules:
1. Never trade too much
2. Never trade without a confirmation
3. Never rely on signals, do your own analysis and research too
✅ If you found this idea useful, hit the like button, subscribe and share it in other trading forums.
✅ Follow me for future ideas, trade setups, and updates on this analysis
✅ Don't hesitate to share your ideas, comments, opinions, and questions.
Take care and trade well
-Vik
____________________________________________________
📌 DISCLAIMER
The content of this analysis is subject to change at any time without notice and is provided for the sole purpose of education only.
Not financial advice or signal. Please make your own independent investment decisions.
____________________________________________________

$TSLA Can Fall #TeslaTraders and Investors, Tesla has been in a downtrend and is looking weaker at the moment. It is forming a potential M pattern which can push the price down. A good confirmation may be needed to initiate a position.
Please support this analysis by liking and sharing. 👍🙂
Rules:
1. Never trade too much
2. Never trade without a confirmation
3. Never rely on signals, do your own analysis and research too
✅ If you found this idea useful, hit the like button, subscribe and share it in other trading forums.
✅ Follow me for future ideas, trade setups, and updates on this analysis
✅ Don't hesitate to share your ideas, comments, opinions, and questions.
Take care and trade well
-Vik
____________________________________________________
📌 DISCLAIMER
The content of this analysis is subject to change at any time without notice and is provided for the sole purpose of education only.
Not financial advice or signal. Please make your own independent investment decisions.
____________________________________________________

#NASDAQ Can Go Higher $NQ $NDX On The Higher Time FramesTraders, We have been bullish since the last quarter of 2022 on this market. NASDAQ now is reaching a point of a possible breakout. Short term it can go a down a bit but on this higher time frame, it is still forming a bigger W FCP Pattern which means that it is still on its target to reach higher levels.
Please note that the chart is Weekly timeframe.
Please support this analysis by liking and sharing. 👍🙂
Rules:
1. Never trade too much
2. Never trade without a confirmation
3. Never rely on signals, do your own analysis and research too
✅ If you found this idea useful, hit the like button, subscribe and share it in other trading forums.
✅ Follow me for future ideas, trade setups, and updates on this analysis
✅ Don't hesitate to share your ideas, comments, opinions, and questions.
Take care and trade well
-Vik
____________________________________________________
📌 DISCLAIMER
The content of this analysis is subject to change at any time without notice and is provided for the sole purpose of education only.
Not financial advice or signal. Please make your own independent investment decisions.
____________________________________________________

#NaturalGas Can Rise Up Very Quickly #NATGASTraders, Natural gas has created several bullish breakouts over the past weeks but failed to push higher. Now as we are reaching the end of the wedge pattern, a breakout is imminent. This can create a W pattern which in turn can push the prices higher.
Please support this analysis by liking and sharing. 👍🙂
Rules:
1. Never trade too much
2. Never trade without a confirmation
3. Never rely on signals, do your own analysis and research too
✅ If you found this idea useful, hit the like button, subscribe and share it in other trading forums.
✅ Follow me for future ideas, trade setups, and updates on this analysis
✅ Don't hesitate to share your ideas, comments, opinions, and questions.
Take care and trade well
-Vik
____________________________________________________
📌 DISCLAIMER
The content of this analysis is subject to change at any time without notice and is provided for the sole purpose of education only.
Not financial advice or signal. Please make your own independent investment decisions.
____________________________________________________

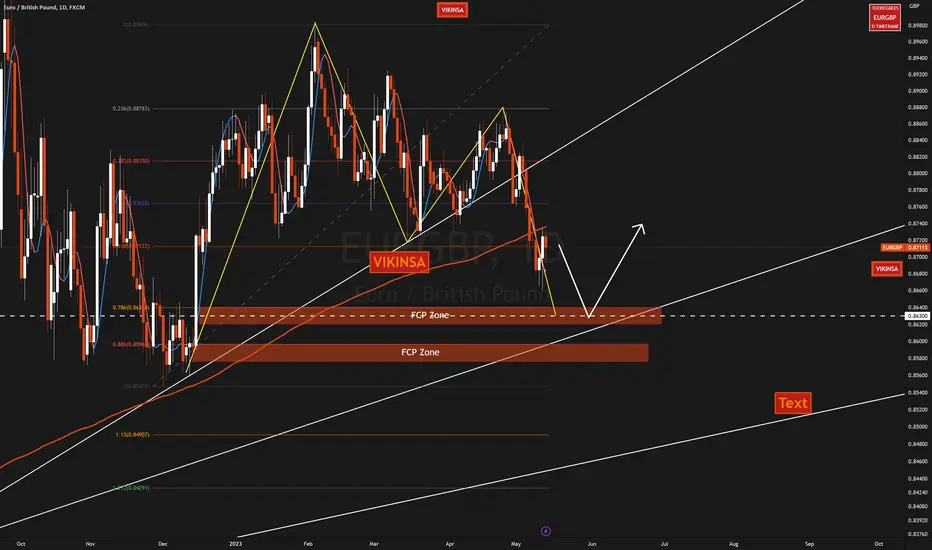
$EURGBP Can Fall Down Further Before Rising Up #EURGBPTraders, EURGBP last week showed a rejection from the 200 sma. It fell a bit from there. We have a potential M pattern forming on the daily time frame. So it can continue to fall until it reaches one of the FCP zones where it can bounce upward again.
Please support this analysis by liking and sharing. 👍🙂
Rules:
1. Never trade too much
2. Never trade without a confirmation
3. Never rely on signals, do your own analysis and research too
✅ If you found this idea useful, hit the like button, subscribe and share it in other trading forums.
✅ Follow me for future ideas, trade setups, and updates on this analysis
✅ Don't hesitate to share your ideas, comments, opinions, and questions.
Take care and trade well
-Vik
____________________________________________________
📌 DISCLAIMER
The content of this analysis is subject to change at any time without notice and is provided for the sole purpose of education only.
Not financial advice or signal. Please make your own independent investment decisions.
____________________________________________________
$DXY Latest Analysis #DXY #USDOLLARTraders and Investors,
It is still consolidating. I tried to go higher in the last week of the last month but failed to keep the breakout. There is a double bottom below which can target liquidity but trade what you see. It may or may not happen. Below this, we have 100 as the psychological level. A possible W pattern is also forming. It is not confirmed yet and is just a scenario (possibility) for now to consider. The higher time frame levels are there on the chart.
Please check USDCHF and USDJPY analysis too as they can give strength to DXY.
Please support this analysis by liking and sharing. 👍🙂
Rules:
1. Never trade too much
2. Never trade without a confirmation
3. Never rely on signals, do your own analysis and research too
✅ If you found this idea useful, hit the like button, subscribe and share it in other trading forums.
✅ Follow me for future ideas, trade setups, and updates on this analysis
✅ Don't hesitate to share your ideas, comments, opinions, and questions.
Take care and trade well
-Vik
____________________________________________________
📌 DISCLAIMER
The content of this analysis is subject to change at any time without notice and is provided for the sole purpose of education only.
Not financial advice or signal. Please make your own independent investment decisions.
____________________________________________________

$CADJPY Can Rise #CADJPYCADJPY has a similar pattern as USDJPY. Please see the attached USDJPY analysis:
Please support this analysis by liking and sharing. 👍🙂
Rules:
1. Never trade too much
2. Never trade without a confirmation
3. Never rely on signals, do your own analysis and research too
✅ If you found this idea useful, hit the like button, subscribe and share it in other trading forums.
✅ Follow me for future ideas, trade setups, and updates on this analysis
✅ Don't hesitate to share your ideas, comments, opinions, and questions.
Take care and trade well
-Vik
____________________________________________________
📌 DISCLAIMER
The content of this analysis is subject to change at any time without notice and is provided for the sole purpose of education only.
Not financial advice or signal. Please make your own independent investment decisions.
____________________________________________________

$GBPUSD Watch These 2 Zones On #GBPUSD Traders and Investors,
GBPUSD has been very bullish but the recent price action has started to show signs of fatigue. So watch these 2 zones (as marked on the chart) for a possible correction downward or trend reversal. A proper confirmation will be needed as the trend has been strong.
Please support this analysis by liking and sharing. 👍🙂
Rules:
1. Never trade too much
2. Never trade without a confirmation
3. Never rely on signals, do your own analysis and research too
✅ If you found this idea useful, hit the like button, subscribe and share it in other trading forums.
✅ Follow me for future ideas, trade setups, and updates on this analysis
✅ Don't hesitate to share your ideas, comments, opinions, and questions.
Take care and trade well
-Vik
____________________________________________________
📌 DISCLAIMER
The content of this analysis is subject to change at any time without notice and is provided for the sole purpose of education only.
Not financial advice or signal. Please make your own independent investment decisions.
____________________________________________________
