DAX correcting towards its 7-month Support.Earlier this month (January 08, see chart below) we gave a Sell Signal on DAX (DE40) as it had entered its 7-month Higher Highs Zone. Less than two weeks later, we are close to hitting our 24100 Target:
Given the recent macro news and the strong 1W candle reversal this week, we now expect this correction to be even stronger. With the Higher Highs pattern leading to the recent top being similar to the one in July 2023, both of which were 1W RSI Bearish Divergencies, we expect the index to aim for its 7-month Support.
This is what happened with the October 23 2023 bottom, so our medium-term Target is now 23000 (Support). Notice that the 2023 Low also made contact with the 1W MA100 (green trend-line) and the 0.382 Fibonacci retracement level, so that could put the validity of DAX's 3-year Channel Up to test.
---
** Please LIKE 👍, FOLLOW ✅, SHARE 🙌 and COMMENT ✍ if you enjoy this idea! Also share your ideas and charts in the comments section below! This is best way to keep it relevant, support us, keep the content here free and allow the idea to reach as many people as possible. **
---
💸💸💸💸💸💸
👇 👇 👇 👇 👇 👇
FDAX1!

DAX Is this the end of its 3-year Bull Cycle?DAX (DE40) has been practically on a wide range consolidation since June 2025, with a slight slopped Higher Highs acting as Resistance where it got rejected 2 days ago. This may signal the end of the market's massive 3-year Bull Cycle as the pattern resembles a lot the April 2015 market Top, which led to a strong, nearly 1-year correction back to the 1W MA200 (orange trend-line).
This is not the first time we bring to you this chart. We first posted it 3 months ago warning of a potential multi-year Top on the market's 16-year Channel Up and this time the warning may be translating into action. Exactly two months ago, the index hit its 1W MA50 (blue trend-line) for the first time since the April low and rebounded, which is the last actions that the market did both in September 2021, August 2017 and March 2011 before a Phase Top two months after.
We won't be going over the pattern cyclical specifics again, as we've done so in detail on the previous analysis, but Phase 3 seems to be topping now due as not only has it exceeded the 2.236 Fibonacci extension from the Phase 2 Low but just did on the 1.618 Fib ext of the Phase 1 High. For reference, the April 2015 High, which was the Phase 3 Top, was priced only 1 month after breaking it.
In addition, the 1M RSI has been massively overbought, trading just under and hitting its 80.00 Resistance, a level that was last tested in April 2007, which is exactly when that Phase 3 peaked! All the above are the strongest technical conditions that a typical Cycle Top on this pattern exhibits.
As a result, we expect 2026 to be a Bear Cycle. Phase 4 historically has corrected to at least the 0.382 Fibonacci retracement level, while also hitting the 1W MA200. Based on its trajectory, we move our long-term Target to 19000, which fills both conditions. Notice also that the 1M RSI has a 14-year Support trend-line as well at 39.00. If this gets hit, it is historically the most optimal signal to buy for the long-term regardless of the price the market will be at the moment. Use it to your advantage.
---
** Please LIKE 👍, FOLLOW ✅, SHARE 🙌 and COMMENT ✍ if you enjoy this idea! Also share your ideas and charts in the comments section below! This is best way to keep it relevant, support us, keep the content here free and allow the idea to reach as many people as possible. **
---
💸💸💸💸💸💸
👇 👇 👇 👇 👇 👇

DAX entered its 7-month Resistance Zone. Will it decline again?DAX (DE40) just entered its 7-month Higher Highs Zone, which has been the technical Resistance of a long-term Ascending Triangle that started on the May 27 2025 High.
With the 1D RSI overbought (above 70.00), the conditions for a new medium-term sell opportunity have emerged. All previous five Bearish Legs of this Triangle have been fairly symmetrical, with the lowest being -5.07%.
We expect at least a repeat of that, which gives us a 24100 Target that may coincide with a 1D MA200 (orange trend-line) and 1W MA50 (red trend-line) test. The latter is the market's long-term Support and will decide the trend for 2026.
If the 1D RSI hits 40.00 though before the price hits 24100, we will take profit on the sell regardless, as that has been the RSI's Symmetrical Support for the entirety of the Ascending Triangle.
---
** Please LIKE 👍, FOLLOW ✅, SHARE 🙌 and COMMENT ✍ if you enjoy this idea! Also share your ideas and charts in the comments section below! This is best way to keep it relevant, support us, keep the content here free and allow the idea to reach as many people as possible. **
---
💸💸💸💸💸💸
👇 👇 👇 👇 👇 👇

DAX Just confirmed the start of a very strong Bear Cycle.DAX (DE40) has been practically trading sideways since June 2025, a fair range on short-term time-frames but a tight one on long-term ones such as the 1M (monthly) that we are looking at today.
We posted this chart 2 months ago warning of a potential multi-year Top for the market's 16-year Channel Up (this time we view it on 1M instead on 1W) and only last month, it hit its 1W MA50 (blue trend-line) for the first time since the April low.
We don't need to mention again the specifics of this pattern's cyclical behavior, such as why Phase 3 seems to have already topped due to hitting the 1.618 and 2.236 Fibonacci extensions on two different measurements. Those where analyzed extensively on the previous publication.
But what we do want to bring to you is that the 1M RSI has been trading downwards since hitting its 80.00 Resistance, a level that was last tested in 2007! This is a clear Bearish Divergence on a wide scale and couple with the fact that the 1M MACD just completed a Bearish Cross, all the basic conditions for a Cycle Top have been met. As you can see, since the 2008 U.S. Housing Crisis, every 1M MACD Bearish Cross was formed on a market Top and signaled an aggressive correction.
As a result, we expect 2026 to be a Bear Cycle, and Phase 4 historically has corrected to at least the 0.382 Fibonacci retracement level, while also hitting the 1W MA200 (orange trend-line). Our 18800 long-term Target fulfills both conditions. Notice also that the 1M RSI has a 14-year Support trend-line as well at 39.00. If this gets hit, it is historically the most optimal signal to buy for the long-term regardless of the price the market will be at the moment.
---
** Please LIKE 👍, FOLLOW ✅, SHARE 🙌 and COMMENT ✍ if you enjoy this idea! Also share your ideas and charts in the comments section below! This is best way to keep it relevant, support us, keep the content here free and allow the idea to reach as many people as possible. **
---
💸💸💸💸💸💸
👇 👇 👇 👇 👇 👇

DAX Hidden Sell Signal on this 4H Golden Cross?DAX (DE40) has been trading within a Channel Up (green) since its 1W MA50 (red trend-line) market bottom and yesterday it formed a 4H Golden Cross. That is technically a bullish pattern but in the past 5 months, every such formation (3 in total) has been an indication of a market Top, thus a bearish signal.
More specifically, the most it took for DAX to form a top after a 4H Golden Cross within this time-frame, has been 4 days. And as you can see it's also been similar Channel Up patterns that peaked after this Cross, on an identical Lower Highs trend-line like the one that the index is about to test.
What's even more striking is that every sell-off that followed the Tops was exactly -5.15%. Identical on all 3 occasions. As a result, it is possible for DAX to decline as low as 23050 following the upcoming top. Since however the 1W MA50 is involved this time as a Support, you may want to book profits there earlier, around 23300, if you see it acting as a Support with strong buying pressure.
---
** Please LIKE 👍, FOLLOW ✅, SHARE 🙌 and COMMENT ✍ if you enjoy this idea! Also share your ideas and charts in the comments section below! This is best way to keep it relevant, support us, keep the content here free and allow the idea to reach as many people as possible. **
---
💸💸💸💸💸💸
👇 👇 👇 👇 👇 👇

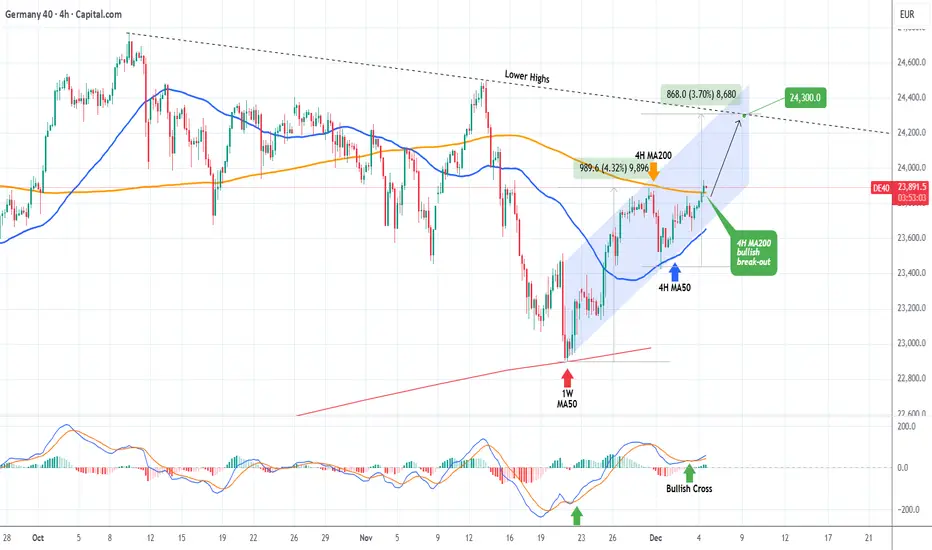
DAX Strong 4H break-out targeting 24300.DAX (DE40) has been trading within a Channel Up since the November 20 bottom on the 1W MA50 (red trend-line) and today it made a massive step upwards as it broke above its 4H MA200 (orange trend-line) for the first time in 3 weeks.
With the 4H MA50 (blue trend-line) established as the Support on the previous Higher Low, we expect this Bullish Leg to hit at least the 2-month Lower Highs trend-line at 24300.
---
** Please LIKE 👍, FOLLOW ✅, SHARE 🙌 and COMMENT ✍ if you enjoy this idea! Also share your ideas and charts in the comments section below! This is best way to keep it relevant, support us, keep the content here free and allow the idea to reach as many people as possible. **
---
💸💸💸💸💸💸
👇 👇 👇 👇 👇 👇
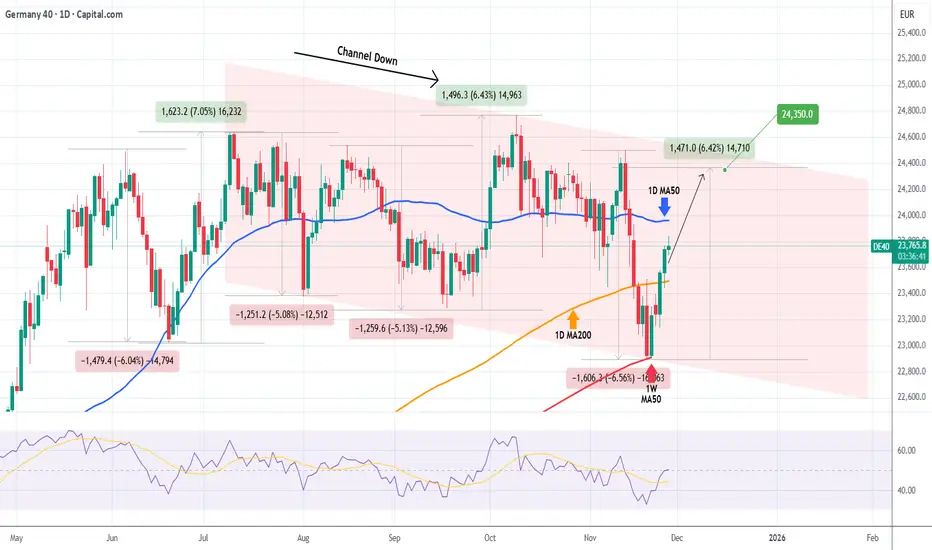
DAX This rally isn't over yet.DAX (DE40) has started a strong rebound following the 1W MA50 (red trend-line) test, as we showed last week. This week the price broke again above its 1D MA200 (orange trend-line) and is about to recover its 1D MA50 (blue trend-line) as well.
The latter has never posed as a Resistance in 2025, so we expect the price to break and continue above it without problems. However, given that the prevailing pattern right now is a Channel Down, the uptrend is limited to its top (Lower Highs trend-line).
With the previous Bullish Leg making a +6.43% rise, we expect a symmetric rise this time around to, thus targeting 24350 short-term.
---
** Please LIKE 👍, FOLLOW ✅, SHARE 🙌 and COMMENT ✍ if you enjoy this idea! Also share your ideas and charts in the comments section below! This is best way to keep it relevant, support us, keep the content here free and allow the idea to reach as many people as possible. **
---
💸💸💸💸💸💸
👇 👇 👇 👇 👇 👇
DAX Will the 1W MA50 support once more?DAX (DE40) has been trading within a 3-year Channel Up, essentially for the entirety of its Bull Cycle, following the October 2022 bottom of the Inflation Crisis.
The most common Support, hence optimal long-term buy signal/ entry within this pattern, has been the 1W MA50 (blue trend-line), having been hit three times and providing on all instances massive rallies.
Every time that or the 1W MA100 (green trend-line) were hit, the rallies always hit the previous High/ Resistance 1 initially before either a consolidation or a slight pull-back.
As a result, if the market hits the 1W MA50 but manages to close the 1W candle above it, we expect the resulting rally to hit at least 24700 (Resistance 1).
Notice also that every long-term Bullish Leg was confirmed after the 1W RSI broke above its Lower Highs trend-line.
---
** Please LIKE 👍, FOLLOW ✅, SHARE 🙌 and COMMENT ✍ if you enjoy this idea! Also share your ideas and charts in the comments section below! This is best way to keep it relevant, support us, keep the content here free and allow the idea to reach as many people as possible. **
---
💸💸💸💸💸💸
👇 👇 👇 👇 👇 👇

DAX 5-month Rectangle approaching the 1D MA200. Buy Signal.DAX (DE40) has been trading sideways within a large 1D Rectangle for the past 5 months. Since the October 09 High the price has been declining on a Bearish Leg that is about to test the 1D MA200 (orange trend-line) for the first time since April 09 2025, the bottom of the Tariff War.
Given that this is just above the bottom of the Rectangle, it constitutes a very strong Buy Signal. We have seen 4 Bullish Legs initiating on this level within this pattern and they all reached at least the 0.786 Fibonacci retracement level. As a result, our current Target on DAX is 24350.
Notice also how the 1D RSI has also entered its own Support Zone.
-------------------------------------------------------------------------------
** Please LIKE 👍, FOLLOW ✅, SHARE 🙌 and COMMENT ✍ if you enjoy this idea! Also share your ideas and charts in the comments section below! This is best way to keep it relevant, support us, keep the content here free and allow the idea to reach as many people as possible. **
-------------------------------------------------------------------------------
💸💸💸💸💸💸
👇 👇 👇 👇 👇 👇

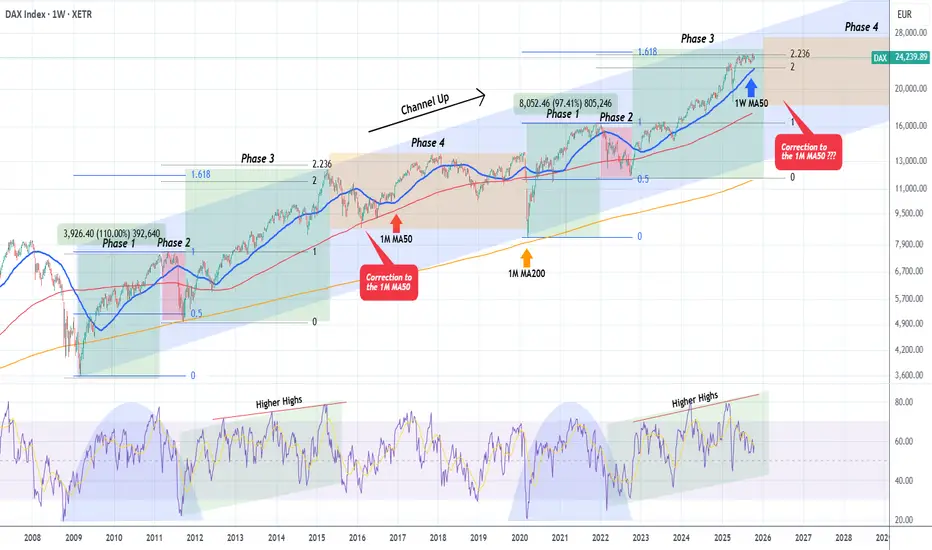
DAX may be at the end of a Bullish Super Cycle.DAX (DE40) has been trading within a historic 16-year Channel Up every since the March 2009 bottom of the U.S. Housing Crisis. This pattern has showcased very distinct technical patterns within it, characterized by an extremely high degree of symmetry.
As you can see, we have classified them into four Phases and right now DAX appears to be trading on a Phase 3. That is the phase where following a Phase 2 correction to the 0.5 Fibonacci retracement level (blue) of Phase 1, it enters a Bull Cycle, which supported by the 1W MA50 (blue trend-line), it peaks on the 1.618 (blue) and 2.236 (black) Fibonacci extensions (of Phase 1 and 2 respectively).
According to this, the index seems to be right at the end of this 'Super Cycle' of Phases 1,2 and 3 and entering Phase 4 of the Channel Up, which (the only data set we have on this pattern) is a period of directionless and volatile trend, loosely supported by the 1M MA50 (red trend-line), which only managed to find support and rebound just before touching the 1M MA200 (orange trend-line) during the March 2020 COVID crash. As a result, Phase 4 can be characterized as a true Bear Cycle, lasting 5 years before (April 2015 - March 2020).
The 1W RSI patterns of the two fractal phase groups are also identical and highly symmetrical and we are already on the 3rd Higher High, rejection and moving downwards. That is a Bearish Divergence and may explain DAX's mostly neutral price action since June 2025.
In any case, the index is possibly ending Phase 3 of this 'Super Cycle' and the next move according to the 2015 sequence is a correction to the 1M MA50. Long-term investors that don't get caught up in the daily volatility, avoid the noise and eventually enjoy the most steady returns on their investments, will most likely seek to wait patiently for this correction and buy low.
What would you be willing to do in that situation?
-------------------------------------------------------------------------------
** Please LIKE 👍, FOLLOW ✅, SHARE 🙌 and COMMENT ✍ if you enjoy this idea! Also share your ideas and charts in the comments section below! This is best way to keep it relevant, support us, keep the content here free and allow the idea to reach as many people as possible. **
-------------------------------------------------------------------------------
💸💸💸💸💸💸
👇 👇 👇 👇 👇 👇
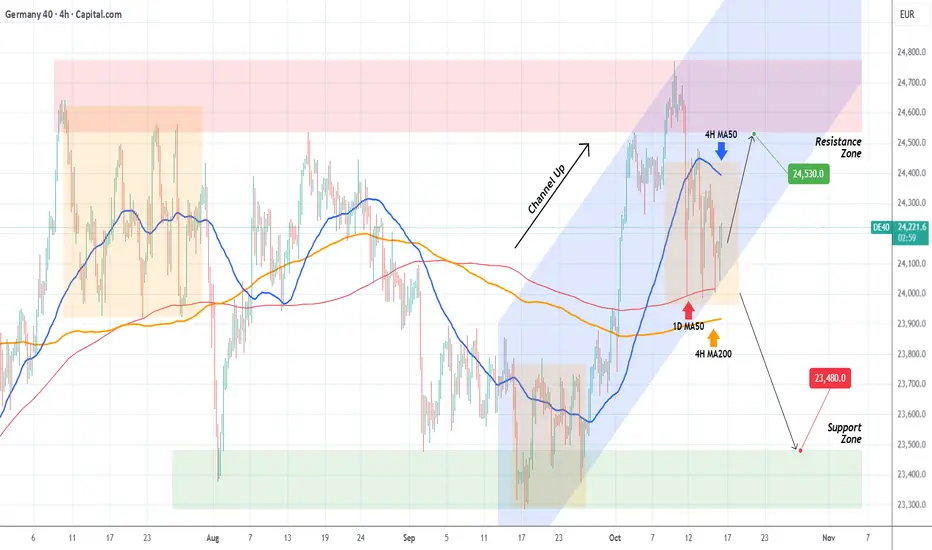
DAX Bullish as long as the 1D MA50 holds.DAX (DE40) has been trading within a 1-month Channel Up and tested today its 1D MA50 (red trend-line) for the 3rd time in the last 6 days.
As long as this holds, we expect a rebound targeting at least the bottom of the Resistance Zone at 24530. A break (and 1D candle close) below the 1D MA50 however, targets at least the top of the Support Zone at 23480.
-------------------------------------------------------------------------------
** Please LIKE 👍, FOLLOW ✅, SHARE 🙌 and COMMENT ✍ if you enjoy this idea! Also share your ideas and charts in the comments section below! This is best way to keep it relevant, support us, keep the content here free and allow the idea to reach as many people as possible. **
-------------------------------------------------------------------------------
💸💸💸💸💸💸
👇 👇 👇 👇 👇 👇
DAX, FTSE Update: Bears Regain ControlMomentum has finally come my way, which has seen bears reclaim control of the DAX and FTSE 100. And I suspect they'll retain control for a while longer. Today I update my levels and outlook for both markets.
Matt Simpson, Market Analyst at City Index and Forex.com (part of StoneX).

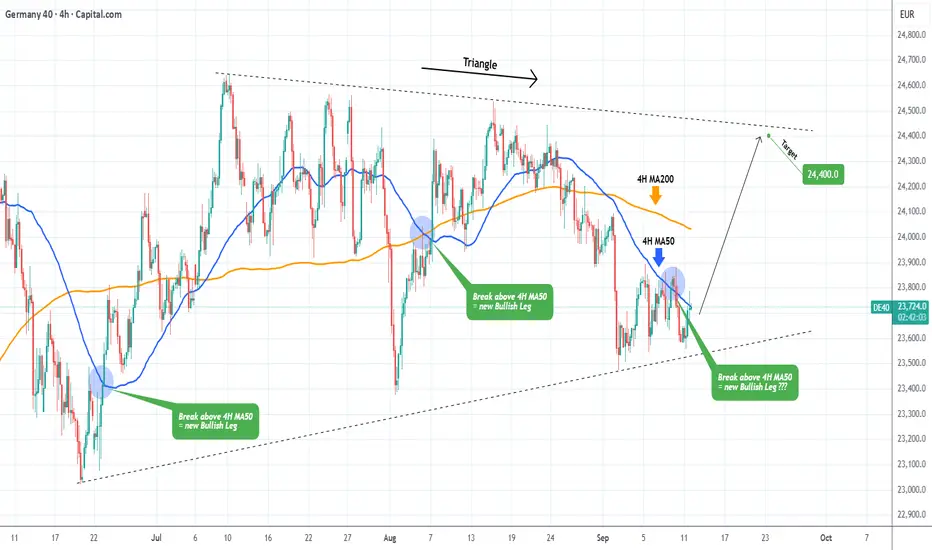
DAX Triangle giving a strong Buy Signal.2.5 months ago (see chart below), we issued a buy signal on DAX (DE40), which hit our 24600 Target within 2 weeks:
This time the price finds itself at the bottom (Higher Lows trend-line) of a 3-month Triangle. Every Bullish Leg of this pattern was confirmed after the price closed a candle above its 4H MA50 (blue trend-line), something the index did 2 days ago.
As a result, we turn bullish again here on DAX, targeting the top (Lower Highs trend-line) of the pattern at 24400.
-------------------------------------------------------------------------------
** Please LIKE 👍, FOLLOW ✅, SHARE 🙌 and COMMENT ✍ if you enjoy this idea! Also share your ideas and charts in the comments section below! This is best way to keep it relevant, support us, keep the content here free and allow the idea to reach as many people as possible. **
-------------------------------------------------------------------------------
💸💸💸💸💸💸
👇 👇 👇 👇 👇 👇
DAX, FTSE 100 Futures OutlookI've been monitoring the FTSE and DAX for potential swing highs in recent days. And I suspect they may be close, if not seen, already.
Matt Simpson, Market Analyst at City Index and Forex.com (StoneX)

DAX Inverse Head and Shoulders target 24600!DAX (DE40) is about to complete an Inverse Head and Shoulders (IH&S) pattern, with the price currently stuck in range within the 4H MA50 (blue trend-line) and the 4H MA200 (orange trend-line).
A 4H candle closing above the 4H MA200, confirms the IH&S pattern and the bullish break-out technically targets the 2.0 Fibonacci extension, currently a little above 24600. On top of that, the break-out may be accompanied by a 1D MAD Bullish Cross, further confirmation of the bullish sentiment.
-------------------------------------------------------------------------------
** Please LIKE 👍, FOLLOW ✅, SHARE 🙌 and COMMENT ✍ if you enjoy this idea! Also share your ideas and charts in the comments section below! This is best way to keep it relevant, support us, keep the content here free and allow the idea to reach as many people as possible. **
-------------------------------------------------------------------------------
Disclosure: I am part of Trade Nation's Influencer program and receive a monthly fee for using their TradingView charts in my analysis.
💸💸💸💸💸💸
👇 👇 👇 👇 👇 👇

DAX Can today's 1D MA50 test start a new rally?Last time we looked at DAX (DE40) more than 2 months ago (April 04, see chart below), we took a long-term buy on the 1D MA200 (orange trend-line) and the bottom of the 2.5-year Channel Up, targeting 25400:
The price reacted favorably, rising almost instantly, almost hitting the top of the Channel Up on June 05. Since then it got rejected and pulled back to hit the 1D MA50 (blue trend-line) today.
Based on the previous Bullish Legs of the Channel Up, this seems to be a technical correction (blue ellipse patterns) that only served as a 1D MA50 test to accumulate more buyers and extend the uptrend.
If the current Bullish Leg rises as high as the previous one (+38%), we should be expecting 25900 by the end of Q3.
-------------------------------------------------------------------------------
** Please LIKE 👍, FOLLOW ✅, SHARE 🙌 and COMMENT ✍ if you enjoy this idea! Also share your ideas and charts in the comments section below! This is best way to keep it relevant, support us, keep the content here free and allow the idea to reach as many people as possible. **
-------------------------------------------------------------------------------
Disclosure: I am part of Trade Nation's Influencer program and receive a monthly fee for using their TradingView charts in my analysis.
💸💸💸💸💸💸
👇 👇 👇 👇 👇 👇

DAX Take 1 Part 2 – Reloaded but not yet good to goThe first time, we saw the DAX poke the 1/4 line.
This was followed by several attempts (distribution by the big players), and from that point on, it headed south and the DAX rolled down the hill.
Currently, it looks very similar.
I’m watching and observing the break of the trend barrier very closely, even on smaller timeframes than the daily.
The profit targets are indicated by the red arrows.
After the break of the thick white centerline, a strong retest of the CL could be in store.
My main target would then be the red centerline.
Since the markets are behaving completely irrationally, I’ll need more “breathing room” in the trade and will handle this trade using long-dated LEAP options.
...poor little guy §8-)

DAX Channel Up targeting a 24800 Higher High.DAX (DE40) has been trading within a 1-month Channel Up and appears to be repeating the first Bullish Leg of the pattern.
More specifically, it rose by +5%, similar to April 30 - May 05 and yesterday's correction resembles May 06. With also identical 1H RSI formations (Lower Highs), we expect the uptrend to be extended in a similar structure and again target the 1.382 Fibonacci extension at 24800.
-------------------------------------------------------------------------------
** Please LIKE 👍, FOLLOW ✅, SHARE 🙌 and COMMENT ✍ if you enjoy this idea! Also share your ideas and charts in the comments section below! This is best way to keep it relevant, support us, keep the content here free and allow the idea to reach as many people as possible. **
-------------------------------------------------------------------------------
Disclosure: I am part of Trade Nation's Influencer program and receive a monthly fee for using their TradingView charts in my analysis.
💸💸💸💸💸💸
👇 👇 👇 👇 👇 👇

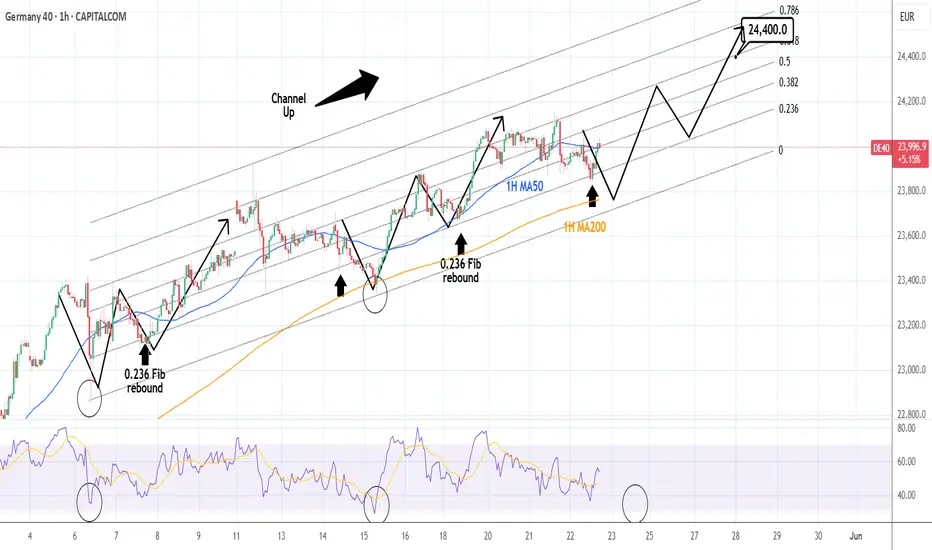
DAX: 1H MA200 supporting the Channel Up. Target 24,400.DAX is on strong bullish levels on its 1D technical outlook (RSI = 67.780, MACD = 423.600, ADX = 73.133) maintaining a short term Channel Up. The last HL bottom was priced on the 1H MA200 on an oversold 1H RSI. Buy and target the 0.618 Fibonacci (TP = 24,400).
See how our prior idea has worked out:
## If you like our free content follow our profile to get more daily ideas. ##
## Comments and likes are greatly appreciated. ##
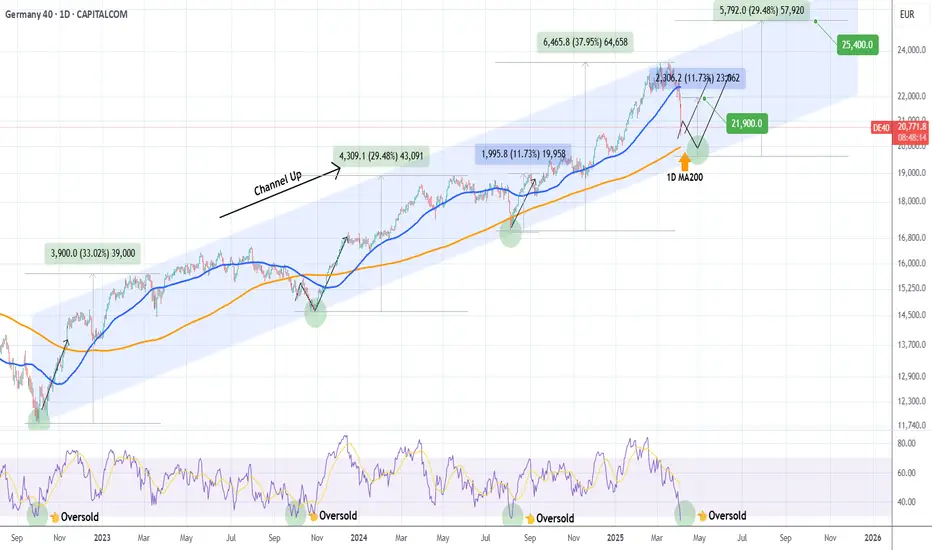
DAX Ultimate buy signal on the 1D MA200 approaching.DAX is having a brutal sell-off, which wasn't technically unexpected as the index made a Higher High on March 06 at the top of its 2.5-year Channel Up. The 1D RSI is already oversold (below 30.00), which is the initial long-term buy signal. Out of the last 3 times the 1D RSI was oversold only on September 26 2023 it extended the downtrend. The other 2 times, it was an immediate buy signal.
The ultimate buy signal, if you want to wait for it, was last time (August 05 2024 Low) when the 1D MA200 (orange trend-line) broke. The minimum rally DAX had following such a bottom was +11.73%, which gives us a short-term Target of 21900 and the maximum (but still the bad case scenario of the 3 Bullish Legs) +29.48%, which gives a long-term Target of 25400.
-------------------------------------------------------------------------------
** Please LIKE 👍, FOLLOW ✅, SHARE 🙌 and COMMENT ✍ if you enjoy this idea! Also share your ideas and charts in the comments section below! This is best way to keep it relevant, support us, keep the content here free and allow the idea to reach as many people as possible. **
-------------------------------------------------------------------------------
💸💸💸💸💸💸
👇 👇 👇 👇 👇 👇
DAX: Healthy Channel Up aiming at 21,350DAX is on excellent bullish levels on its 1D technical outlook (RSI = 66.832, MACD = 222.700, ADX = 20.758) as it just crossed the previous Resistance of the 5 month Channel Up. This is technically the new bullish wave of the pattern which got further confirmed after Monday's bounce on the 4H MA200. Both 1D MACD wise and relative price structure, it looks much like the previous two bullish waves. The recent HH was on the 2.0 Fibonacci extension, thus we're aiming for the top of the pattern (TP = 21,350) yet again.
See how our prior idea has worked out:
## If you like our free content follow our profile to get more daily ideas. ##
## Comments and likes are greatly appreciated. ##

DAX Strong probability for a technical pull-back here.DAX (DE40) hit last week our 20000 Target, which we established 2 months ago (October 04, see chart below):
That Target was near the top (Higher Highs trend-line) of the 1-year Channel Up that started on the week of the October 03 2022 bottom. As you can see, this pattern has topped both previous Bullish Waves on the 1.618 Fibonacci extension level and after a pull-back consolidation phase (red Arc), it started the Bearish Legs that bottomed and made Higher Lows on Support 1, which was the previous Resistance level.
Having now already hit its 1.618 Fib ext, we expect DAX to pull-back a little and turn sideways as per the pattern, which we will short, targeting 19000 (Support 1). If however we see a 1W MA200 (blue trend-line) hit and immediate rebound and weekly closing above it, we will book our sell profit earlier.
Notice also the high symmetry on those Legs, between their 1W CCI fractals.
-------------------------------------------------------------------------------
** Please LIKE 👍, FOLLOW ✅, SHARE 🙌 and COMMENT ✍ if you enjoy this idea! Also share your ideas and charts in the comments section below! This is best way to keep it relevant, support us, keep the content here free and allow the idea to reach as many people as possible. **
-------------------------------------------------------------------------------
💸💸💸💸💸💸
👇 👇 👇 👇 👇 👇

DAX looks unwell at these highsIt's been a tough few weeks for the DAX. But if the bearish reversal pattern on the daily chart comes to fruition, things could get a worse. I also factor in price action clues on the monthly candlestick chart, which again suggests things could deteriorate further before they get better.
MS.
