TER watch $187-189: Major Resistance zone should give a DIP buy TER got a serious boost from the last Earnings report.
It is about to hit Major Resistance zone at $187.34-189.74
Look for a Break-n-Retest or Dip-to-Fib like $170 zone to buy.
.
See "Related Publications" for previous plots such as this BOTTOM CALL:
Hit BOOST and FOLLOW for more such PRECISE and TIMELY charts.
=========================================================
.
Fibonacci
ETH/USDT 1W Long-term1️⃣ Market Structure (Most Important)
• We had an uptrend (trend line, higher lows)
• A breakout from the trend occurred
• Price did not return above the line → structure changed to BEARISH/distribution
📉 This is not a bullish correction, but a full breakout of the structure
⸻
2️⃣ Key Price Levels
🟢 Former Supports (Now Resistances)
• $4,015 – Major Weekly Supply ❌
• $3,435 – Strong Resistance after Distribution ❌
• $2,787 – Key Support ➜ Broken by Impulse
➡️ 2,787 = Now Resistance, Not Support
⸻
🔴 Current Situation
• Price: ~$2,340
• We are just above the local low
• Weak demand response, no strong Wicks
⸻
3️⃣ Momentum Indicators
🔹 Stochastic RSI
• Falling into oversold
• No clear upward crossover
📌 In a downtrend → not a long signal, but a warning for shorts
⸻
🔹 RSI (classic)
• Below 50
• Rejected from the mean
➡️ Bearish Momentum
⸻
4️⃣ Scenarios (realistic)
🔴 Baseline Scenario (60–70%)
• Short bounce to 2600–2800
• Rejection at former support
• Continuation of declines to:
• $2230 (local low)
• ~$2000 (psychological + liquidity)
• $1455 (weekly demand – (extreme)
⸻
🟡 Alternative scenario (30–40%)
• Defense 2230–2340
• Consolidation
• Attempt to return above 2787
❗ Only a weekly close > 2800 changes the bias
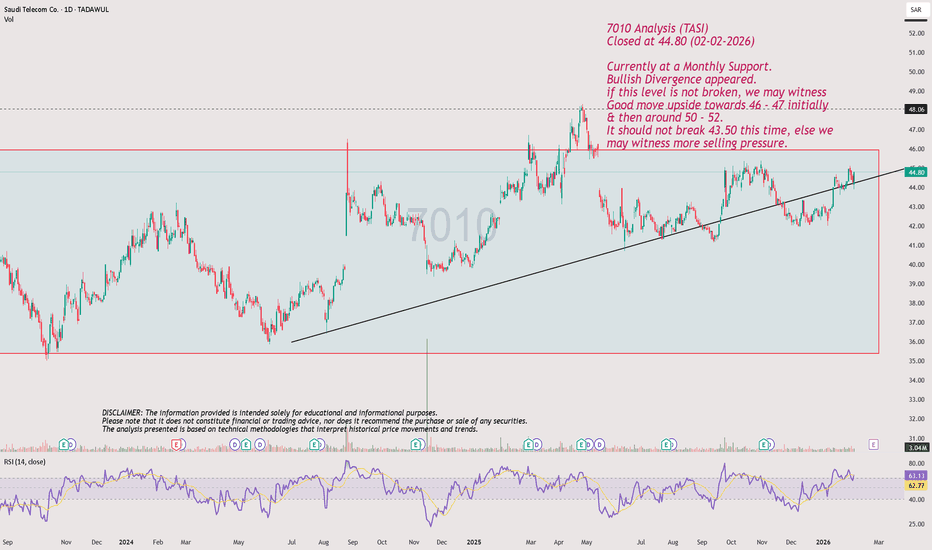
Currently at a Monthly Support. 7010 Analysis (TASI)
Closed at 44.80 (02-02-2026)
Currently at a Monthly Support.
Bullish Divergence appeared.
if this level is not broken, we may witness
Good move upside towards 46 - 47 initially
& then around 50 - 52.
It should not break 43.50 this time, else we
may witness more selling pressure.
EURUSD Trading Idea: Buy with a Subsequent Sell from 1.19In the medium-term perspective, EURUSD maintains a bullish structure despite the current corrective move. Price continues to hold above key demand zones, and the pullbacks are still considered corrective within a larger trend.
Short-term and mid-term scenario:
At current levels, the euro looks attractive for buy positions, with a target toward the 1.1900 area.
This zone acts as a strong resistance and a potential profit-taking area. As price approaches 1.19, increased volatility and a high probability of a reversal are expected.
Main trading plan:
Currently considering buy positions on EURUSD with targets at 1.1850 - 1.1900
In the 1.1900 area, switching to a sell scenario, as a reversal from this level could lead to a move toward new local lows
Long-term context:
It is important to note that on the monthly timeframe, a golden cross is forming - a crossover of long-term moving averages, which historically often signals the potential start of a strong long-term uptrend.
At this stage, it is fundamentally difficult to clearly explain the reasons why the euro could demonstrate sustained long-term growth. However, market structure and technical signals suggest that the market may be preparing for such a scenario.
This is not investment advice. We trade based on actual price reaction.
SIlver is f.k.d.,You may not belive what I m going to sayAs per the analogy of past patterns, silver has corrected more from the top than gold , so silver can easily touch Fibonacci level of 61.8, even go beyond that, so just place the gtt orders , on the Fibonacci levels.that brings silver on 57 dollar levels
How far Gold will be dumped?By the method of analogy, I have found out that gold touched the retracement level of .5 in fibonachi based on that 4050(.5) and 3400 (.618) are the levels.
Choose your price accordingly.
Do check risk management.
Don't do darivative trading on these levels , strictly not recommended.
Just go for etfs.
Sentient SENT price analysis🧠 How can the “Sentient” project become a unicorn?
Easy — just follow the scenario we’ve already drawn 😏
(Current market cap: ~$250M)
📊 On OKX:SENTUSDT , we’re seeing:
• solid trading volumes
• price hitting a liquidity zone
• a correction already in progress
📉 Key idea: The weaker the correction, the stronger the next impulsive move.
🔻 Correction levels are marked on the chart.
Critical zone: $0.25
Below that level, #SENT loses attractiveness for us.
🛡 Conservative approach: Wait for price to securely break and hold above the trendline, then consider entries.
For now: 👀 Observe
📐 Make your own decisions
😴 …or simply ignore it
❓Do you see #SENT as a future unicorn, or just another short-term hype?
______________
◆ Follow us ❤️ for daily crypto insights & updates!
🚀 Don’t miss out on important market moves
🧠 DYOR | This is not financial advice, just thinking out loud
GU LongW: Uptrend, respecting the lows
D: Uptrend, price broke daily trendline
H4: Uptrend, price hit -61.8 on 4H FIB, and reversed
1H: Downtrend, price hit -61.8 + There's BULLISH divergence on minor RSI.
CURRENTLY: I'm looking for price to go long to previous support area @ H1 trendline for a minor structure trade
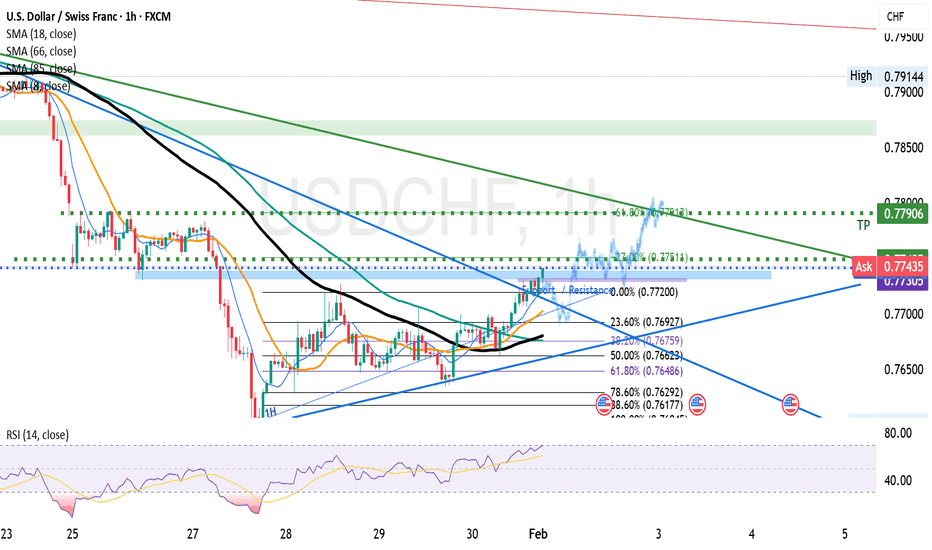
USDCHF LongW: Downtrend, respecting the highs
D: Downtrend, price consolidated the last few months
4H: Downtrend, price retraced 23.6% so far
1H: Uptrend, price retraced 61.8% and hit resistance
CURRENTLY: I'm looking for price to go long to H4 trendline, closing the gap at previous resistance.
FIB Exits
TP1 @ -27%
TP2 @ -61.8%
Aussie Bulls Relent Ahead of RBAAUD/USD exhausted into the 2023 high-day close last week at 7077 with price unable to mark a daily close above uptrend resistance. A decline of more than 2.6% is now testing initial support at the 2024 high which converges on the 75% parallel near 6943. A break below this slope would threaten a larger pullback within the broader uptrend with subsequent support seen at the 6817/37- a region defined by the 2023 yearly open and the 38.2% retracement of the November advance. Look for a bigger reaction there IF reached.
Initial resistance is eyed at the 100% extension of the November rally at 7009 with a breach / close above the 7077 ultimately needed to fuel the next major leg of the advance.
Bottom line: Aussie has responded to uptrend resistance with the pullback now testing initial support ahead of tonight’s RBA rate decision. The central bank is widely expected to hike rates by 25bps, and the focus will be on the accompanying commentary. From a trading standpoint, rallies should be limited to 7009 IF price is heading for a deeper setback on this stretch with a close below 6943 needed to keep the bears in control near-term.
-MB
GOLD - Correction within the local downtrend FX:XAUUSD stabilizes after correction, returning above $4750 after testing the $4400 area earlier in the week. However, the overall trend remains under pressure.
Key factors: DXY remains strong, limiting gold's growth. Tensions between the US and Iran have eased slightly, reducing demand for gold as a safe-haven asset. The appointment of Kevin Warsh, who is considered a proponent of tighter fiscal policy, has supported the dollar.
The market is awaiting the release of the US ISM Manufacturing PMI, which will set the tone ahead of employment data. This data will adjust expectations for future Fed rate cuts.
Despite a short-term recovery, gold remains in a downward correction amid a strong dollar and reduced geopolitical risks. The latest economic data from the US will determine the dynamics.
Resistance levels: 4470 - 4475, 4885
Support levels: 4696, 4583, 4432
Technically, I expect a retest of the nearest resistance; the market may react with a pullback/decline to support.
Best regards, R. Linda!
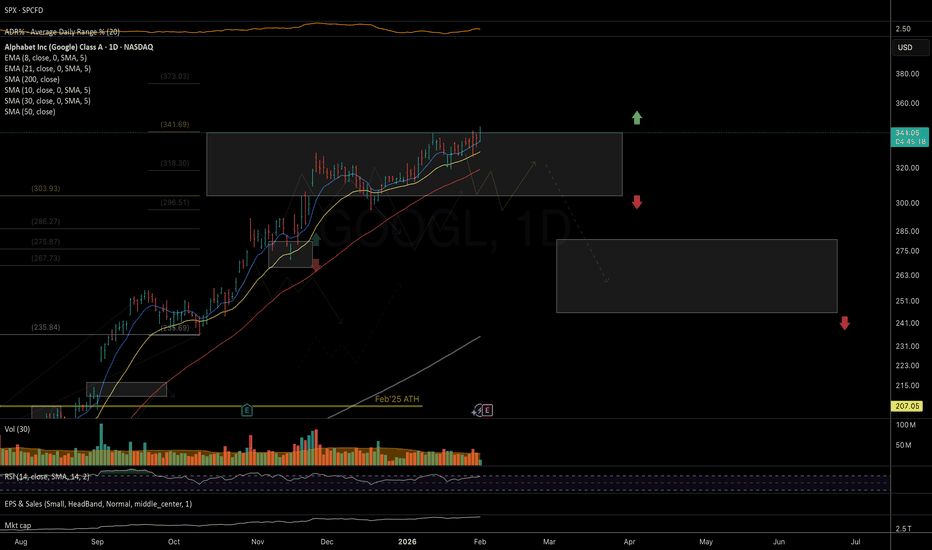
GOOGL: at the top of important resistance zone NASDAQ:GOOGL earnings tomorrow. Price is balancing at the upper boundary of an important resistance zone, which could attract substantial selling pressure.
That makes a reasonable case for hedging at these levels in case of a downside trend shift, potentially leading to 280–240 macro support.
Chart:
Previous trend analysis since Jul'25:
GBP/AUD Market Analysis: Macro + Structure [MaB]1. The Macro Context (The "Why") 🌍
Hi traders! Before looking at the candles, let's look at the money.
My fundamental scoring table speaks clearly: there is a -4 differential, indicating a Bearish (Moderate) bias that we cannot ignore.
Key Factor Analysis:
🏦 Current Rates: Explanation: BoE at 3.75% offers an attractive carry level, while RBA at 3.6% remains the second highest in the G7. Score GBP: +1 Score AUD: +1
🌍 Economic Regime: Explanation: GBP is in a Goldilocks expansion phase; AUD is facing reflation with accelerating inflation. Score GBP: +1 Score AUD: +2
📊 Rate Expectations: Explanation: BoE is dovish with an easing trend (25bp cut in Dec); RBA remains neutral with a stable holding trend. Score GBP: -1 Score AUD: 0
🎈 Inflation: Explanation: Both currencies face high inflation above target, maintaining hawkish pressure on their respective central banks. Score GBP: +1 Score AUD: +1
📈 Growth/GDP: Explanation: Both economies show growth (GBP 1.3%, AUD 2.3%) that appears unsustainable given high inflation levels. Score GBP: 0 Score AUD: 0
⚖️ Risk Sentiment: Explanation: Market sentiment is currently in a neutral regime with no specific bias for either currency. Score GBP: 0 Score AUD: 0
🏛️ COT Score: Explanation: Commitment of Traders shows a bearish build-up for GBP, while AUD sees strong longs and accelerating purchases. Score GBP: -1 Score AUD: +2
🗞️ News Bonus: Explanation: GBP saw a strong acceleration in the services sector (PMI +2.9 to 54.3); no significant surprises for AUD. Score GBP: +1 Score AUD: 0
Currency Score Summary: Total Score GBP: +2 (Neutral/Bullish) Total Score AUD: +6 (Strong Bullish)
Synthesis: GBP (Weak, Score +2): High rates but dovish BoE in an easing cycle with heavy speculative selling. AUD (Strong, Score +6): Solid growth and very strong speculative accumulation in progress.
Conclusion: With this scenario, we are only looking for Short setups. Going against this bias would be statistical suicide.
2. The Technical Setup (The "Where") 📉
Timeframe: 1h | Pair: GBP/AUD
The SMC Market Structure + Price Zones indicator gave us the confirmation we needed for our statistical edge. Here is where the indicator makes the difference. Look at the dashboard on the right, numbers don't lie:
🚀 Continuation Rate (64.7%): We are well above the 60% threshold. This tells us the market is in a healthy, directional trend. Statistically, betting on continuation pays off more than looking for a reversal.
🔥 Streak (1) & Streak Pct (2%): We are at the 1st consecutive impulse. It's a fresh trend, so we have plenty of room for the move to develop before it becomes overextended.
🔄 Retest (84.5%): The indicator tells us that statistically, when price creates a new Break of Structure (BOS), it retraces into the previous zone 84.5% of the time. This gives us high confidence in our entry zone.
💥 BOS/Ret Rate (59.8%): This parameter tells us that once price retraces inside the previous zone, it has a high probability of reacting and creating a new BOS.
🎯 Extension Rate (1.65x): The algorithm projects an ambitious target. We expect this move to extend 1.65 times the current pullback leg. That's where we'll take profit.
3. Execution Plan on Chart
Moving to the chart, the SMC Market Structure + Price Zones indicator supports us in pinpointing liquidity to define entry and stop loss:
Entry and Stop Loss: We place a limit entry in the Supply Zone 1h (Red Band) and the stop loss a few pips above the zone.
Take Profit: We leverage the asset's statistical analysis offered by the Extension Rate and place the target by measuring with Fibonacci at 1.65x relative to the pullback leg.
Trade Parameters:
Entry Price: 1.96654 Stop Loss: 1.97083 Take Profit: 1.93428
⚠️ Disclaimer: This analysis is based on a proprietary algorithm and is shared exclusively for educational and didactic purposes. It does not constitute financial advice or investment solicitation in any way. Trading involves significant risk.
[EUR/CHF] Market Analysis: Macro + Structure [MaB]1. The Macro Context (The "Why") 🌍
Hi traders! Before looking at the candles, let's look at the money.
My fundamental scoring table speaks clearly: there is a +5 differential, indicating a Bullish Moderate bias that we cannot ignore.
Key Factor Analysis:
🏦 Current Rates: Explanation: ECB at 2.15% (G7 average) vs SNB at 0% (lowest G7, no carry appeal). Score EUR: 0 Score CHF: -1
🌍 Economic Regime: Explanation: Both currencies are in a Reflation regime with moderate inflation increases. Score EUR: +1 Score CHF: +1
📊 Rate Expectations: Explanation: Both central banks are neutral, holding steady with no immediate pressure. Score EUR: 0 Score CHF: 0
🎈 Inflation: Explanation: EUR (2.14%) is near target, while CHF (0.02%) is in deflation and well below target. Score EUR: 0 Score CHF: -1
📈 Growth/GDP: Explanation: EUR shows evident stagnation (0.7%), while CHF shows modest but stable growth (1.2%). Score EUR: -1 Score CHF: 0
⚖️ Risk Sentiment: Explanation: The market is in a neutral regime for both currencies with no specific bias. Score EUR: 0 Score CHF: 0
🏛️ COT Score: Explanation: Strong long accumulation and accelerating buys for EUR vs consolidated strong shorts for CHF. Score EUR: +2 Score CHF: -1
🗞️ News Bonus: Explanation: No major EUR surprises; CHF PMI Manufacturing (48.8) remains in contraction despite a slight recovery. Score EUR: 0 Score CHF: -1
Currency Score Summary:
Total Score EUR: +2 (Neutral/Mixed)
Total Score CHF: -3 (Weak)
Synthesis:
EUR (Mixed, Score +2): ECB neutral with 2.15% rates, inflation near target but growth is weak. Strong COT support with speculators accumulating.
CHF (Very Weak, Score -3): SNB neutral with 0% rates and stagnation. Manufacturing PMI remains under 50 with consolidated short positions.
Conclusion: With this scenario, we are only looking for Long setups. Going against this bias would be statistical suicide.
2. The Technical Setup (The "Where") 📉
Timeframe: 15m | Pair: EUR/CHF
The SMC Market Structure + Price Zones indicator gave us the confirmation we needed for our statistical edge.
Here is where the indicator makes the difference. Look at the dashboard on the right, numbers don't lie:
🚀 Continuation Rate (68.8%): We are well above the 60% threshold.
This tells us the market is in a healthy, directional trend. Statistically, betting on continuation pays off more than looking for a reversal.
🔥 Streak (1) & Streak Pct: We are at the 1st consecutive impulse.
It's a fresh trend (we are in the 3rd percentile of trend extension), so the potential for growth is high. As long as the music plays, we dance.
🔄 Retest (39.7%): The indicator tells us that statistically, when price creates a new Break of Structure (BOS), it retraces into the previous zone only 39.7% of the time.
💥 BOS/Ret Rate (64.9%): This parameter tells us that once price retraces inside the previous zone, it has a high probability of reacting and creating a new BOS.
🎯 Extension Rate (1.74x): The algorithm projects an ambitious target.
We expect this move to extend 1.74 times the current pullback leg. That's where we'll take profit.
3. Execution Plan on Chart
Moving to the chart, the SMC Market Structure + Price Zones indicator supports us in pinpointing liquidity to define entry and stop loss:
Entry and Stop Loss: We place a limit entry in the Demand Zone 15m (Blue Band) and the stop loss a few pips below the zone.
Take Profit: We leverage the asset's statistical analysis offered by the Extension Rate and place the target by measuring with Fibonacci at 1.74x relative to the pullback leg.
Trade Parameters:
Entry Price: 0.91698
Stop Loss: 0.91575
Take Profit: 0.92382
⚠️ Disclaimer: This analysis is based on a proprietary algorithm and is shared exclusively for educational and didactic purposes. It does not constitute financial advice or investment solicitation in any way. Trading involves significant risk.
GBPUSD: Massive Confluence at Key Support — Long OpportunityThe GBPUSD pair is currently exhibiting a corrective phase within a sustained local uptrend. We are approaching a high-probability Point of Interest (POI) where multiple technical factors align for a potential bullish reversal.
The Technical Confluence (1.3545 – 1.3605)
We have identified three primary drivers supporting a long bias from this zone:
Fibonacci Golden Zone: The current price action is descending into the 50.0% – 61.8% Fibonacci retracement level of the primary impulse, a classic area for trend continuation.
S/R Flip (Historical Structure): This range represents a significant previous Swing High, which is now expected to act as a pillar of support.
Dynamic Support: The area coincides with the Ascending Support Trendline, providing further structural reinforcement.
Strategic Outlook
Given the convergence of these three factors, we anticipate a strong bullish rejection within the 1.3545 – 1.3605 range.
Bias: Bullish
Entry Zone: 1.3545 – 1.3605
Primary Target (TP1): 1.3865
Secondary Target (TP2): 1.3950
Risk Warning: Wait for local timeframe confirmation (e.g., bullish engulfing or MSB) within the zone before execution.
Trade safe, and feel free to share your thoughts in the comments!
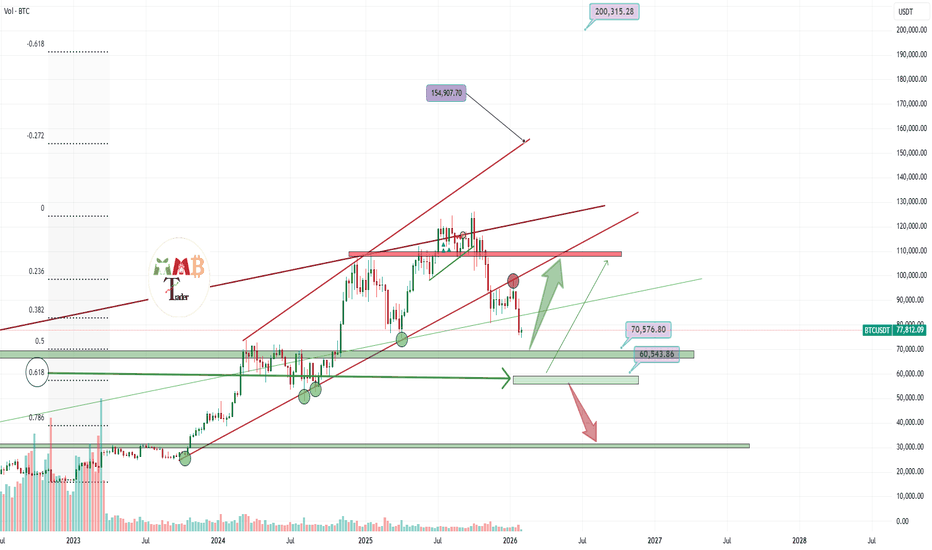
Bitcoin is finally near major weekly support zoneThe breakdown below the key weekly trendline has shifted Bitcoin's market structure to bearish in the near term, with price now trading below the $85,000 support zone. This move invalidates the previous consolidation pattern and signals increased selling pressure.
Attention now shifts to two major weekly Fibonacci support levels derived from the prior bull cycle:
$70,000 – Corresponding to the 0.5 Fibonacci retracement level.
$60,000 – Corresponding to the 0.618 Fibonacci retracement level.
These zones represent high-probability areas where institutional and long-term buyers may re-enter, potentially catalyzing a significant bullish reversal. A strong, volume-supported reaction at either level could mark a local bottom and initiate a new recovery wave.
Potential Recovery Path:
Should a confirmed reversal occur—marked by a bullish weekly candlestick pattern and rising volume—the initial recovery target would be a reclaim of the $90,000 level. A sustained break above this resistance could then open the path toward $100,000 and eventually challenge previous all-time highs.
Trade Perspective:
While the immediate trend is bearish, the $70,000–$60,000 zone is viewed as a strategic accumulation area for long-term investors. Traders may consider planning long entries upon confirmed reversal signals in this region, with stops placed below the corresponding Fibonacci level to manage risk.
EURUSD need some rest and dump and then 1.22The EURUSD pair is anticipated to undergo a corrective phase or consolidation before potentially resuming its broader trajectory. The primary support zones to monitor are 1.1500 (near-term) and 1.1220 (major). A retracement toward either level could offer a foundation for a renewed bullish impulse.
Should price reach these supports and exhibit signs of a bullish reversal—such as a clear candlestick pattern with supporting volume—a long position may be considered. The subsequent upward move would initially target the 1.2200 resistance area.
Trade Plan Outline:
Scenario A (Reversal at 1.1500) : Watch for bullish confirmation near this level for a potential long entry.
Scenario B (Deeper Retracement to 1.1220) : A more significant base could form here, offering a potentially stronger long setup.
Invalidation: A sustained break below 1.1220 would invalidate the near-term bullish outlook.
Target: Initial upside objective toward 1.2200.
Risk Management:
A stop-loss should be placed below the relevant support zone used for entry, ensuring a disciplined risk/reward structure.
DISCLAIMER: ((trade based on your own decision))
<<press like👍 if you enjoy💚
NZDJPY near 94.00 is sell Entry nowNZDJPY is currently testing a significant daily resistance zone around 94.00, a level that has already prompted two clear rejections in recent sessions. This repeated failure to break higher suggests strengthening selling pressure at this resistance confluence.
Given this price action structure, a bearish reversal appears increasingly probable. A third rejection from this zone could initiate a downward move toward the 92.00 support level, representing a potential decline of approximately 200 pips.
A short position may be considered upon confirmation of rejection—such as a bearish candlestick pattern or loss of momentum at this resistance—with a stop placed above the recent swing high and a take-profit target near 92.00.
DISCLAIMER: ((trade based on your own decision))
<<press like👍 if you enjoy💚


