EURUSD - Looking To Sell Pullbacks In The Short TermH1 - Strong bearish move.
No opposite signs.
Currently it looks like a pullback is happening.
Expecting bearish continuation until the two Fibonacci resistance zones hold.
If you enjoy this idea, don’t forget to LIKE 👍, FOLLOW ✅, SHARE 🙌, and COMMENT ✍! Drop your thoughts and charts below to keep the discussion going. Your support helps keep this content free and reach more people! 🚀
-------------------------------------------------------------------------------------------------------------------
Fibonacci

GOLD → Consolidation is narrowing... Price is weakening FX:XAUUSD is trading near $4,000, consolidating after the Fed's statements and awaiting new macro data. The trading range has narrowed to $3,886–4,046, forming a symmetrical triangle (unpredictability)
Fed caution: Powell ruled out guarantees of a rate cut in December, which supported the dollar and limited gold's growth.
US shutdown: Could become the longest in history, causing economic concerns, but is expected to end this week.
Weak data: ISM Manufacturing PMI (48.7) pointed to contraction in the sector, which is holding back the dollar's strengthening.
This week, attention is focused on ADP and ISM Services — assessing the impact on Fed rates.
NFP (if published) — a key benchmark for the labor market.
Accordingly, gold is in wait-and-see mode. Clear signals from the data or the Fed will be needed to break out of the range. The $4000 level remains a psychological equilibrium point.
Resistance levels: 4000, 4030, 4050
Support levels: 3956, 3915, 3900
At the moment, the price is far from the key consolidation boundaries, and the market is uncertain. In this case, we are considering trading within the channel. I expect to see a retest of the flat resistance or the triangle boundary and a rebound.
Best regards, R. Linda!

Nasdaq long then short: Expecting one last wave upIn this analysis, I talk about the wave structure for Nasdaq and highlighted that wave 1 is currently the longest wave and that means wave 5 cannot be longer than wave 3. This gives us a maximum target of 26300 that is already hit on 30th Oct. So while I do expect another up wave for Nasdaq, this will likely be a double top with the same high as 30th Oct before we start on a longer-term move down.

USD/JPY📊 Technical Analysis
Trend: The overall daily and weekly trend remains "bullish".
Structure: A rejection at 154 suggests sellers defending that area.
Liquidity zone: 153.00 aligns with previous demand, Fibonacci 38–50 % retracement, and EMA support — a likely area for buyers to reload.
Pattern: Double-top → short-term correction → continuation pattern.
✅ Bearish pullback: Price rejects 154 → retraces to 153 (liquidity sweep) → resumes uptrend | Bearish rejection candle on 4H or daily.
❌ Invalidation / breakout: Price breaks and closes above 154.30 with strong volume Continuation straight to 155–156 without retrace.
> The USD/JPY may be setting up for a short-term correction from 154.00 toward 153.00 to gather liquidity before continuing higher in line with the long-term bullish trend.

Gold – Dancing Around $4000, Where Next?Gold prices may have stabilised after their sharp correction from an all-time high at 4381 on October 20th to a low of 3887 on October 28th, however traders still bear the scars from that excessive and volatile move which has left the popular metal dancing in a 3% range either side of 4000.
Judging where Gold prices may move next has become more challenging with Federal Reserve policymakers trying to cool market expectations of a further interest rate cut at their next meeting in December. As a general rule, lower interest rates can help support Gold prices as it is a non-yielding asset.
Not only that, but this changing outlook from the Fed has also seen the US dollar move up to its highest level for 3 months, which has further weighed on Gold prices, as it makes the safe haven asset, which is priced in dollars, more expensive to global investors.
However, many of the drivers that attracted traders to add Gold to their portfolios remain, such as geo-political risks in Ukraine, credit risk and uncertainty regarding the direction of global economic growth.
In this type of environment paying attention to the technical outlook can be just as important as staying appraised of macro headline risk.
Technical Update: Does 3915 Mark the Extent of Corrective Moves?
Gold has corrected over 11.25% from its October 20th all-time high into last Tuesday’s October 28th session low, unwinding the possible over-extended upside conditions that built during the sharp August 20th to October 20th price advance.
The key dilemma for traders now is whether the recent weakness marks a healthy market correction or suggests a deeper shift in sentiment. If it’s the former, we could see renewed buying interest and a resumption of the broader uptrend. However, if it’s the latter, risks may lead to a further phase of price weakness.
While the next directional theme for Gold remains uncertain, technical analysis can offer potential clues. By identifying key support and resistance levels, traders can anticipate where directional risks may emerge, especially if those levels break on a closing basis. A breach of support may signal deeper corrective risk, while a close above resistance could resume positive momentum.
Potential Resistance Levels:
Gold’s 11.25% decline from the October 20th high appears to have found support at 3,915, the 61.8% Fibonacci retracement of the September 18th to October 20th advance. Price action has since stabilised around this level, suggesting potential for attempts to renew upside.
Traders may now shift focus to key resistance levels, with closing breaks above those levels needed to indicate further price strength.
With upside developing following tests of the 3915-retracement support, traders could now be monitoring the 4076 level, which is the 38.2% Fibonacci retracement of the October price weakness. Successful closing breaks above 4076 could result in tests of 4134, the 50% level, even 4192, the higher 61.8% retracement.
Potential Support Levels:
As suggested above, with the latest phase of price weakness being held by the 3915 retracement levels, traders will likely be monitoring this as the first possible support. Closing breaks under this level could be a catalyst for continued price declines.
Such moves while not a guarantee of a phase of further price weakness, could open tests of 3819, the October 2nd session low, even 3717, which is the September 24th downside extreme.
The material provided here has not been prepared accordance with legal requirements designed to promote the independence of investment research and as such is considered to be a marketing communication. Whilst it is not subject to any prohibition on dealing ahead of the dissemination of investment research, we will not seek to take any advantage before providing it to our clients.
Pepperstone doesn’t represent that the material provided here is accurate, current or complete, and therefore shouldn’t be relied upon as such. The information, whether from a third party or not, isn’t to be considered as a recommendation; or an offer to buy or sell; or the solicitation of an offer to buy or sell any security, financial product or instrument; or to participate in any particular trading strategy. It does not take into account readers’ financial situation or investment objectives. We advise any readers of this content to seek their own advice. Without the approval of Pepperstone, reproduction or redistribution of this information isn’t permitted.

Bitcoin short: Relabelling of Waves and Fibo Extension LevelFirstly, apologies that the margin statistics is not shown nearing the end of the video.
Here's the last few months of data that I am talking about:
Year-Month Debit Balances in Customers' Securities Margin Accounts Free Credit Balances in Customers' Cash Accounts Free Credit Balances in Customers' Securities Margin Accounts Ratio (B/D)
2025-06 1,007,961 200,573 185,584 5.431292568
2025-07 1,022,548 194,712 186,672 5.477779206
2025-08 1,059,723 188,221 181,563 5.836668264
2025-09 1,126,494 204,106 194,884 5.780330863
The last column in the table above is the leverage ratio based on using column B divide by column D. Column B being the value of securities in a customer's margin account and column D being the amount of cash supporting the securities. So we are at historical high in terms of both leverage and nominal amount.
You can get this statistics from www.finra.org
Take note that Sep is the last data point due to government shut down.

Long Potential: EURUSD 15M.Long/Buy potential on 15M EURUSD. Always do your own analysis before took someone's else.

Asts round 2 After a successful golden pocket setup yet again I am eyeing another play as we test the zone again. I am thankful I sold my calls around 80$ on the pump. I look the same region for a long setup, same strikes, same expirations.
December 80$ calls look ripe

$BTC BEARISH CROSS on the 20 / 200 DMA We had a similar setup at the end of September of 2021 where CRYPTOCAP:BTC then rallied a week later ~75% over the next few weeks.
However, every other time this bearish cross occurred in the past, ₿itcoin has spent at least a couple months trying to reclaim the 200DMA.
Currently PA has closed the Day below the 200DMA.
Bulls CANNOT afford a Weekly close below $106k, which is well outside the DANGER ZONE and .382 Fib
GOOD NEWS: An Inverse Head & Shoulders pattern has formed.
Bulls need some big volume days to come reverse the localized downtrend ASAP.
If not, the 50WMA will be tested ~$103k.
If that happens, Bulls must not show any weakness nor allow Weekly Closes below it.

EURJPY ANALYSIS AND CONFLUENCE After seeing the daily candle close as a doji above 177.500 we could confirm that the market is still very bullish and we could be expecting a new leg to the upside seeing that the 4hr retested the moving average and formed a short term resistance that we are looking for a break above before going long.....
PS. From the previous video i do apologize for the misleading because the analysis said short when it should have been long

AUDJPY — Bullish Fibonacci Retracement Setup Within ChannelAUDJPY continues to trade within a clean ascending structure, respecting the trendline and Fibonacci confluence zone between 100.50 – 100.10. After rejecting the 0.618 retracement level (100.09), price shows early signs of continuation toward the 101.20 resistance zone.
Key Technical Structure:
Resistance: 101.20 (swing high)
Support: 100.50 – 100.10 (Fib zone + trendline confluence)
Major Support: 99.40 (previous swing low)
Extension Target: 101.50 – 102.00 (projected bullish wave target)
Trade Outlook:
The bias remains bullish as long as price holds above 100.10, with the Fib retracement aligning with the dynamic ascending support. A strong bounce from the 0.5 – 0.618 zone could trigger a new wave toward 101.20+.
However, a break below 99.80 would invalidate the bullish structure and shift momentum toward 98.90 (1.272 Fib extension).
Bias:
Bullish structure intact — watching for a retracement into support for long continuation setups.

ETH/USDT 1W Chart📊 Market Structure:
Main Trend: Still up (higher lows and highs pattern persists).
Current Phase: Correction in an uptrend.
Local Trend: Down for several weeks (series of red weekly candles).
⚙️ Key Support and Resistance Levels:
Resistance (green lines):
4,753 USDT – recent local high, very strong resistance.
4,373 USDT – previous consolidation level, currently a supply zone.
3,979 USDT – current key local resistance, which previously served as support.
Support (red lines):
3,600 USDT – currently tested support level (coincides with the uptrend line).
3,165 USDT – next strong support level (previous local lows).
2,740 USDT – strong long-term support, potential target for further correction.
📈 Trendline:
The black uptrend line connects successive higher lows since April 2024.
The current weekly candlestick is testing this line (confluence with support at 3,600 USDT).
Maintaining this line = still a bullish medium-term scenario.
A breakout and weekly close below ~3,580–3,600 USDT → a signal of a possible trend reversal.
📉 Volume:
Downward volume is increasing, indicating supply pressure.
A lack of strong demand candlesticks = buyers are cautious in this zone.
🔄 Stoch RSI Oscillator (bottom of the chart):
Located in the oversold zone (below 20).
The %K (blue) and %D (orange) lines are starting to converge → a possible rebound signal in the coming weeks if a crossover occurs upwards.
🧭 Scenarios:
🟢 Bullish
Holding support at 3,600 USDT + trendline.
Confirmation with a bullish candle with higher volume.
Target: Return to 3,980 → 4,370 USDT.
🔴 Bearish:
Closing the week below 3,580 USDT (trendline + support).
Potential decline to 3,165 USDT, and even 2,740 USDT beyond.
RSI and volume suggest that downward pressure remains significant.
📌 Summary:
Key level: 3,600 USDT → decisive point for the market's further direction.
Short-term: Still downward pressure, but a technical rebound is possible (Stoch RSI).
Medium-term: The uptrend has not reversed until ETH closes below the trend line and 3,550 USDT.

I would call this a Change of Character (CHoCH) for BTCI want to share with you that the 2 Day On Balance Volume (OBV) is now below its EMA(100).
The last time this happened was at ATH in November 2021.
Also the 2D OVB EMA(100) was spot on at the ATL in January 2023.
BTC has reached it's 6.618 Fibonacci of Wave 1 resulting in 698%.
Don't you think a correction would be in order?
And yet people are still talking about a coming bull run ;)))
I don't say this is the final top, even though it looks like it… one more high after a short correction could still be possible.
I'm just saying this is something to keep in mind » Already 7x, bullish OBV is finished AND … according to a simple sine wave (yellow) we are now in a down phase until around February - March 2026.
Let's see what happens.

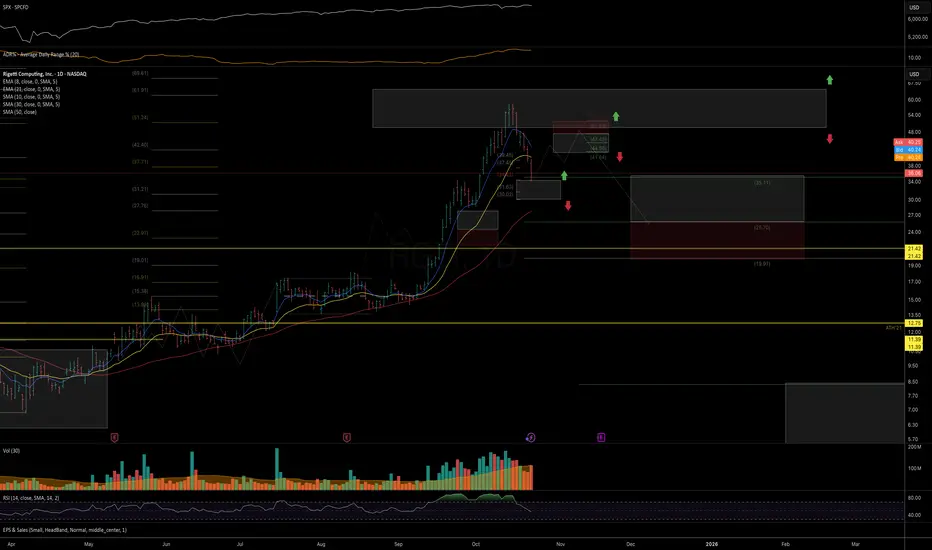
$RGTI: Reaction from Macro Resistance and Structural OutlookPrice reacted as expected from the key resistance outlined in the October update.
The main hypothesis remains that price has likely topped and is now completing its first wave of decline.
Any upcoming recovery attempt will be considered a bounce and potential lower high formation before further downside later this year.
Chart:
In the broader context, the critical zone to monitor is the 35–25 support area.
If price manages to stage an impulsive 5-wave recovery from this zone, the probability for another upside leg toward the next macro resistance at 85–115 will remain valid.
However, if the recovery from this area unfolds as a corrective 3-wave structure, then a breakdown below the Dec’24 top and continuation into the macro support zone will become the higher-probability scenario.
Chart (weekly):
Previous Updates
• On macro resistance and potential topping (Oct 13)
Chart:
View Idea
• On support and pullback potential (Sep 24)
Chart:
View Idea
• On macro structure (Sep 18)
Chart:
View Idea
COIN: substantial downside potential As long as price remains below the October lower high, I’m watching for structural potential pointing toward more downside in the coming weeks, with next key support levels at 240–200.
If price is able to start closing above 375, I will need to re-assess the suggested trend structure for a more immediate bullish upside that I don’t see clearly at this point.
Chart:

META watch $634-641: Semi-Major Support may hold Earnings DUMP META apparently disappointed with its last earnings report.
Approaching a "Semi-Major" support zone at $634.32-641.88
Look for a clean bounce or look lower like $600 for next try.
.
This is a followup to my TOP CALL given by Dual Goldens:
Hit BOOST and FOLLOW for more such PRECISE and TIMELY charts.
========================================================

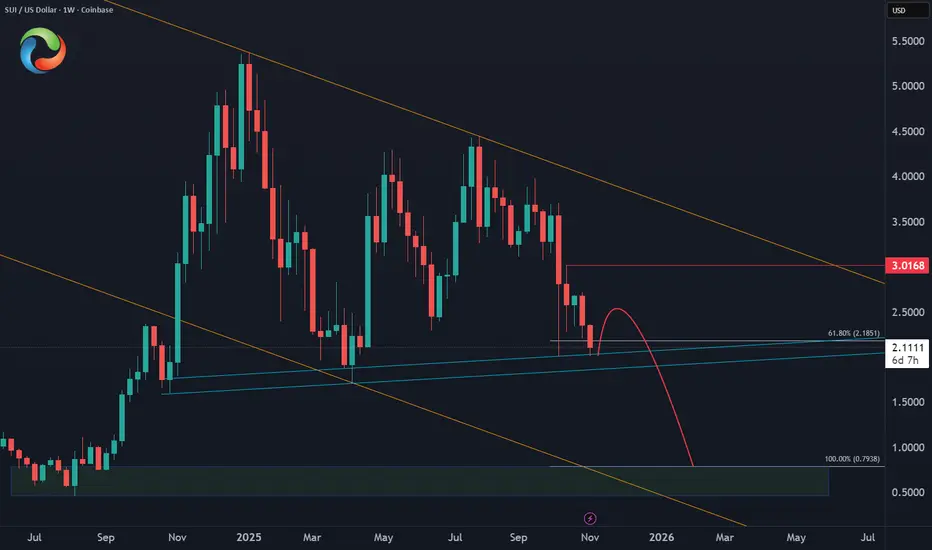
SUI – Mid-Term Projection📊 COINBASE:SUIUSD continues to respect the channel from October 2024, currently finding support near the 61.8% Fibonacci extension zone. This area could still fuel a bounce this month, offering short-term relief.
However, unless price breaks decisively above $3, the structure remains corrective, likely forming a lower high. That would set the stage for sellers to re-enter, targeting a swing move lower below $1 in the coming months.
#ElliottWave #Trading #Altcoins
FI watch $67.14: Golden Genesis fib could mark BOTTOMFI downtrend may have hit a "Capitulation Bottom"
Currently orbitting a Golden Genesis fib at $67.14
Look for a Break-n-Retest for long term entires.
.

XAU/USD – Gold Accumulates Before Breakout, Target 4,096 USD🔍 Market Context
Gold is trading within a symmetrical triangle pattern , reflecting short-term accumulation before forming a new breakout wave.
After a sharp decline from the peak of 4,096 USD, the market has shown two instances of Change of Character (ChoCH) – an early sign indicating the return of buying pressure.
As long as the price holds above the 3,959 – 3,917 USD range, the short-term bullish structure remains intact. This support zone serves as a crucial “discount zone” in the current accumulation cycle.
💎 Key Technical Zones
• Support Zone 1: 3,959 USD → main structure holding area, coinciding with the lower trendline.
• Support Zone 2: 3,917 USD → final liquidity reaction zone.
• Resistance Zone: 4,040 USD → potential break & retest area.
• Liquidity Zone: 4,096 USD → expansion target if the peak is broken.
🎯 Trading Scenarios
1️⃣ BUY Setup – Favoring the bullish structure
• Entry: 3,959 – 3,917 USD
• Stop Loss: 3,905 USD
• Take Profit:
– TP1: 3,985
– TP2: 4,040
– TP3: 4,072
– TP4: 4,096
✳️ “Buy the discount” – prioritize buying orders at the confluence support zone of trendline + FVG to follow the SMC flow.
2️⃣ SELL Scalp – Secondary strategy when price reacts at the peak
• Entry: 4,096 USD
• Stop Loss: 4,108 USD
• Take Profit:
– TP1: 4,072
– TP2: 4,040
– TP3: 3,985
✳️ “Sell the premium” – only activate if there is a strong price rejection signal at the liquidity peak.
💬 Conclusion
The short-term trend of gold remains bullish as the price stays above the trendline and continuously forms higher lows.
The main strategy is buy the dip – sell reaction around the 3,959 → 4,096 USD range.
The confirmation point for a strong bullish trend will be when the price closes steadily above 4,040 USD .
“Smart money accumulates in silence before the market makes noise.”
⏰ Timeframe: 1H
📅 Update: 03/11/2025
✍️ Analysis by: Captain Vincent

90% chance we go sub 0.70 areaHello all,
Fibs never lies, so for the emotional gna gna gna reaction... Take the time to read this.
I've shared this lately and more I look at it, more it makes sense. I was bullish like everybody else before this massive wick appeared on the chart. This has reset my bullish view short terms.
This analysis is crystal clear. We have been missing one retracement to 0.70 level.
If I'm wrong this last wick was hell of a scam one, yet I intend to believe it shows the direction price will take the coming weeks.
We may have a great opportunity ahead to buy at discount and shoot back up to where we should have been without the SEC in our way.
I'm still bullish. 9 dollars is my conservative target. 40 dollars my Top coz like you I'm addicted to Hopium.
Take care all.

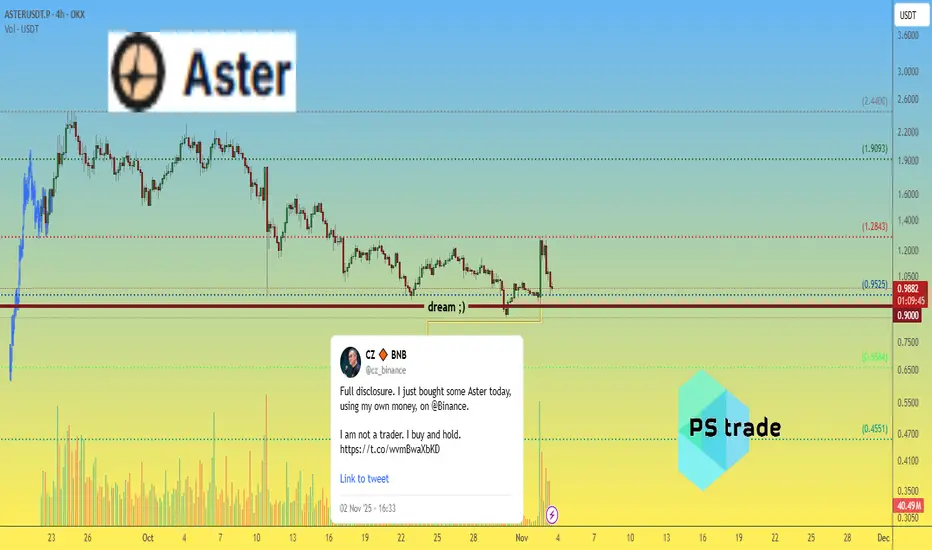
Aster price analysisIt’s been a month and a half since the previous idea
and the dream came true: #Aster finally dropped to $0.90 💥
Did anyone here add this gem to their long-term portfolio? 😉
By the way, #CZ said yesterday he’s “not a trader, but a holder” — and right after that, the market pulled off a solid pump 😏
Now the main question, if we look at the OKX:ASTERUSDT.P chart:
📉 Is $0.90 already the bottom?
Or are we in for another “gift” — a second bottom around $0.65,
maybe even a third one near $0.45? 😬
What do you think — which “bottom” will turn out to be the real one? Share your thoughts below 👇
______________
◆ Follow us ❤️ for daily crypto insights & updates!
🚀 Don’t miss out on important market moves
🧠 DYOR | This is not financial advice, just thinking out loud
ASO LongASO range trade with extra targets if it continues.
Enter now or on pull back/test as close to 51 as possible.
Price reclaiming range from historic levels.
3 Weeks of rising volume on the breakout.
Trend line break out.
Appears to be bull flagging on the level. If you zoom in on daily it appears to getting ready to on the process of testing the flag breakout and/or horizontal level.
MACD been positive for two weeks now.
Price above 50 and 200 weekly ma's.
TP1 - top of range
TP2 - .886 fib
TP3 - 1.272 fib

TER watch $187-189: Major Resistance zone should give a DIP buy TER got a serious boost from the last Earnings report.
It is about to hit Major Resistance zone at $187.34-189.74
Look for a Break-n-Retest or Dip-to-Fib like $170 zone to buy.
.
See "Related Publications" for previous plots such as this BOTTOM CALL:
Hit BOOST and FOLLOW for more such PRECISE and TIMELY charts.
=========================================================
.
