XAU/USD – Gold in Equilibrium Zone: Sell Opportunities Around...🔍 Market Context
Gold is currently consolidating within a triangle structure , showing short-term accumulation before a potential breakout.
Buyers are trying to maintain a minor bullish structure, but the series of lower highs indicates that sellers still hold the upper hand.
At the moment, price is reacting within the FVG 3,942–3,979 USD area, staying below the descending trendline.
If this zone fails to break, selling pressure may return.
💎 Key Technical Levels
• Bearish Order Block: 4,022 USD → main supply zone, aligning with the descending trendline.
• FVG Zone 1: 3,979 USD → short-term liquidity test area.
• FVG Zone 2: 3,942 USD → potential retracement zone before further downside.
• Bullish Order Block: 3,882 USD → key support aligning with long-term bullish trendline.
• Liquidity Zone: 3,789 USD → extended target if main support breaks.
🎯 Trading Scenarios
1️⃣ Sell Setup – Reaction from Resistance Zone
• Entry: 4,012 – 4,022 USD
• Stop Loss: 4,035 USD
• Take Profit:
– TP1: 3,979
– TP2: 3,942
– TP3: 3,900
– TP4: 3,882
– TP5: 3,789
✳️ “Sell the premium” – utilise supply and FVG reactions following Smart Money flow.
2️⃣ Buy Setup – Reaction from Demand Zone
• Entry: 3,882 USD
• Stop Loss: 3,865 USD
• Take Profit:
– TP1: 3,910
– TP2: 3,942
– TP3: 3,979
– TP4: 4,012
– TP5: 4,022
✳️ “Buy the discount” – valid when strong absorption or reversal signal forms near the lower OB.
💬 Summary
Current structure remains short-term bearish , yet the market is balanced.
The most efficient approach is to sell near premium zones (4,022) and buy back near discount (3,882) .
Expected range in the next 24–48 hours: 3,880–4,020 USD .
💡 Tagline:
“Trade where institutions act — not where retail reacts.”
⏰ Timeframe: 1H
📅 Updated: 30/10/2025
✍️ Analysis by: Captain Vincent
Fibonacci

The #1 Reason For The Butter Knife Strategy.Its been a while since i used the fibnoccai
indicator.
Even as I place this indicator into action
I kept doubting my analysis.
But because I have been trading using the simulation
trading account for a long time.
I can still remember the trades that went well
and the ones that didn't.
Using the Fibonacci is a crazy
way of seeing the markets
but once you master it.
It will reveal so much more about
the markets that you didn't know
about.
I call this the "butter knife strategy."
because once the price crosses that
fibonacci line
Then you know something is
melting in the background.
So I shifted the chart to the 4hour
then I checked the trend
using the rocket booster strategy
It was like I was riding a bicycle and
working with my experience
and instincts.
Trading is a rollercoaster and you
need someone who really understands
what they are doing.
I have really put my life on the line
to learn this stuff, believing
that one day it will deliver me
maybe I was right, maybe I was wrong.
but I will always take profit
and take trades.
Courage is acting in the face of fear
not without it.
Remember that.
Rocket boost this content to learn more.
Disclaimer: Trading is risky
Please use a simulation trading account
Before you trade with real money.

URJPY-1HShort/RiskyChartBOS: Confirmed bearish structure shift; lower highs and lower lows forming.
CHoCH: Occurred near PDH — confirming short-term reversal and distribution.
Supply Zone: The highlighted gray box represents the sell-side mitigation zone, where price rejected after grabbing liquidity above PDH.
Targets:
Short-Term: 176.60 – liquidity resting near previous swing lows.
Final Target: 176.00 – PDL (Previous Day Low) liquidity pool.
Invalidation: Break and close above 177.60 (PDH) would invalidate the bearish idea.
Setup Type: Liquidity Sweep + CHoCH + Supply Zone Rejection
Entry Confirmation: Bearish 15m candle close or internal CHoCH
Risk Management:
Stop above PDH (≈177.65)
Take profit near PDL (≈176.00)
Potential RR: 1:3 to 1:4

2 key zones to watch out for!We could either fill CME gap soon & head higher to fill golden pocket or hit golden pocket levels 117.3-118K & then sweep the lows where VWAP, VAL & golden pocket of recent lows aligns at 108-109K!
This more or less aligns with wyckoff (yellow bars)

Bitcoin Setting Up a Bullish Megaphone Toward $160KBTCUSDT has completed its previous falling wedge pattern, fully reaching its projected target.
Price is now consolidating within a developing bullish megaphone structure, suggesting continued expansion and volatility.
If structure holds, the next projected upside target points toward the $160K zone over the medium term.
Meanwhile, there’s a CME gap around the $110K level, which could attract a sharp move toward that zone aligning with our buy-back region. If price revisits this area, it could present a strong buying opportunity before the next major upside leg.
Share your thoughts in the comments don’t forget to like and share if you find this analysis helpful.
Drop your altcoins below, and I’ll review and analyze them for you!

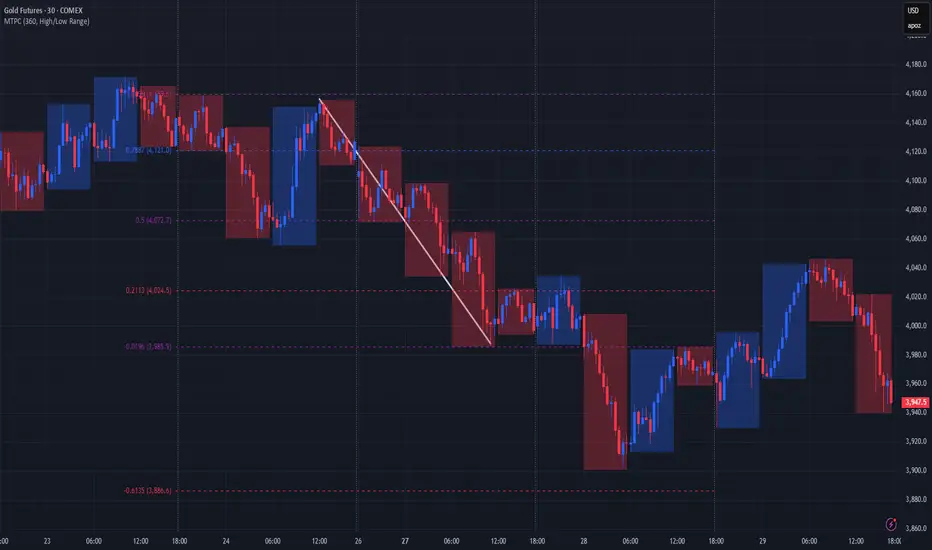
New Impulse Wave Started, wave 3 run up? It looks like we are entering sub wave 1 of Wave 3 of the current impulsive wave.
Watch all of the usual fib extension
0.786 ~ $4025
1.00 ~ $4045
1.272 ~ $4071
1.618 ~ $4103
Good luck to all !

Gold Rebounds to Order Block — Downside Risk Remains🔍 Market Context
After forming a Change of Character (ChoCH) and a clear Break of Structure (BoS) to the downside, gold dropped sharply from 4,080–4,100 USD, confirming a shift from bullish to bearish structure.
Price is now making a technical rebound, forming Lower Highs toward the Order Block 4,012 USD — aligning with a small Fair Value Gap (FVG) , suggesting new selling pressure may emerge.
This rebound is seen as a “pullback retest supply” within a completed bearish setup.
If the 4,012 USD supply zone reacts strongly, price may extend its drop toward lower liquidity pools.
💎 Key Technical Structure
BoS (bearish): confirms a break below prior bullish structure.
Order Block (OB): 4,010–4,020 USD → main supply area confluencing with FVG.
FVG zone: 3,985–4,010 USD → technical retracement zone.
Supply Zone: 3,891–3,895 USD → temporary support, may be swept.
Liquidity Zone: 3,850–3,860 USD → key liquidity target.
📈 Trading Scenarios
1️⃣ SELL Setup – Retest OB 4,010–4,020 USD
Entry: 4,010 – 4,020
SL: 4,035
Take Profit: 3,985 - 3,965 - 3,945 - 3,915 - 3,890/Open
✅ Condition:
Wait for price to retest FVG–OB with clear bearish confirmation (strong rejection, bearish engulfing, or minor ChoCH on M15).
➡️ Trend-follow setup – sell after price retests supply zone.
2️⃣ BUY Setup – Reversal at Liquidity Zone 3,850 USD
Entry: 3,850 – 3,860
SL: 3,830
TP1: 3,870 - 3,885 - 3,900 - 3,920 - 3,940/Open
✅ Condition:
Wait for strong absorption or bullish reversal signal (long-tail rejection or bullish ChoCH on M15–H1).
➡️ Counter-trend scalp setup for reversal traders.
⚠️ Risk Management
Prioritise SELLs below 4,035 USD.
BUYs only valid with confirmation at Liquidity Zone.
Avoid mid-range trading (3,920–3,970) to reduce noise.
💬 Conclusion
Gold remains in a bearish trend after breaking prior bullish structure.
As long as price stays below 4,035 USD , downside momentum prevails.
Next major target: 3,891 – 3,851 USD .
👉 Strategic Plan:
Sell 4,010–4,020 | SL 4,035 | TP 3,985 → 3,890 🎯
Buy 3,850–3,860 | SL 3,830 | TP 3,870 → 3,940 🎯
💎 Price never lies — liquidity always reveals the truth.
⏰ Timeframe: 1H
📅 Updated: 29/10/2025
✍️ Analysis by: Captain Vincent

XAUUSD Coiling - Preparing for the Next Big Move?Asset: CFDs on Gold (XAU/USD)
Timeframe: 15 Minutes
Gold is currently consolidating in a well-defined range after a recent move. The key levels for the next major directional move are now clearly established.
Key Technical Levels:
· Resistance: ~4012.00 (Recent swing high)
· Support: ~3915.00 (Significant swing low, a double-bottom formation)
· Intermediate Support: ~3886.00 & ~3844.00
Trading Thesis & Scenarios:
The market is at a decision point. A breakout from this consolidation is expected to dictate the short-term trend.
· Bullish Scenario (Long):
· Trigger: A decisive 15-minute candle close above 4012 resistance.
· Confirmation: Look for a retest of the breakout level as support.
· Target: Projected move towards 4050 - 4080.
· Bearish Scenario (Short):
· Trigger: A decisive 15-minute candle close below 3915 support.
· Confirmation: This would confirm a breakdown from the range.
· Target: Projected decline towards 3886, with a further target at 3844.
Current Market State: Waiting for a confirmed breakout. Trading inside the range is risky due to potential false moves. The preferred strategy is to wait for price action confirmation at the boundaries.
What are your levels to watch? TVC:GOLD

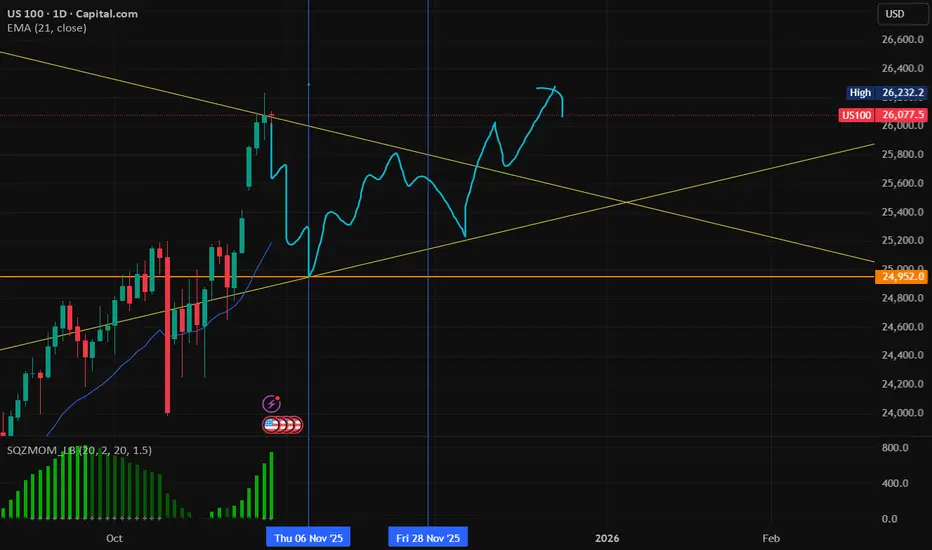
Nasdaq November RED candle and then continue movement.Due since april we have monthly 7 green candles, we need a reversal and red candle in November to continue then the movement to 27,000. But first a back movement to 25,000 and triangle pattern could be the movement for november.
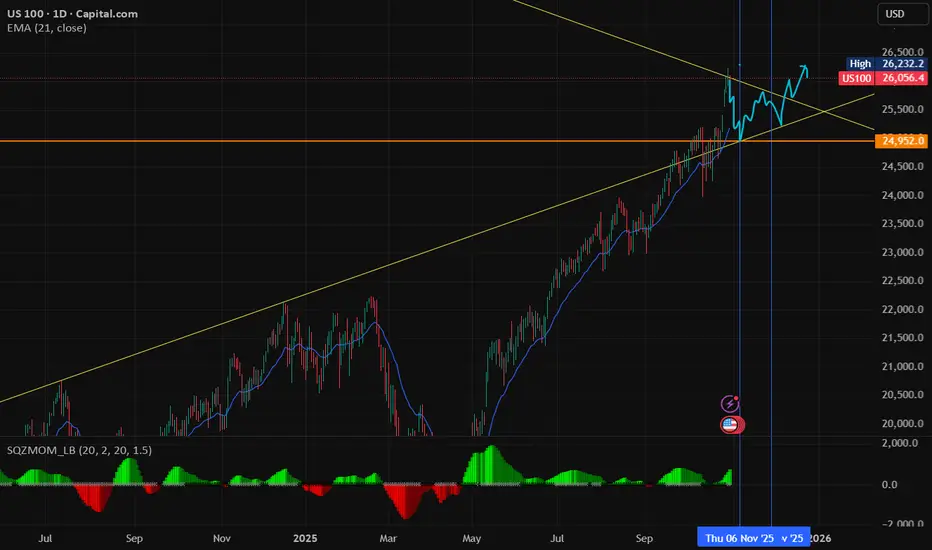
Nasdaq November RED candle and then continue movement.Due since april we have monthly 7 green candles, we need a reversal and red candle in November to continue then the movement to 27,000. But first a back movement to 25,000 and triangle pattern could be the movement for november.
A better alternative to Fibonacci grid🙏🏻 Fibonacci based grid is a great inspiration from the Universe, but imo ain’t the final product, and here it is:
For traders
Use these values above and put em into grid tool here, and you’ll end up with uniform distribution based grid:
1.6134612334371357
1.0196152422706632
0.7886751345948129
0.5
0.21132486540518708
-0.019615242270663247
-0.6134612334371357
Then about how to apply it, you can divide trading activity by analytical units, these are in turn are based on:
^^ by price
^^ by time
^^ by signed volume waves/volume delta
Explanation
If you’ve followed my latest work you know I’ve identified a way to combine higher order moments to construct natural data driven estimates of data’s extremums and “ever possible” values (I still got no idea how no1 Ever posted it anywhere over the last centuries).
Now imagine you got only 2 input values: actual max and min (just like in Fibo grid, it ain’t knows nothing else). Given only these 2 values we can model stuff with uniform distribution that has precisely known values of standardized moments, so we end up with (and remember that uniform distro is symmetric around its mid, so all odd moments are zero):
dev = 1 / math.sqrt(12) //standard deviation
kurt = 1.8 //kurtosis (not excess ofc, the raw one)
hkurt = 27 / 7 //hyperkurtosis, 6th moment, raw af as well
0.5 + dev * hkurt
0.5 + dev * kurt
0.5 + dev
0.5
0.5 - dev
0.5 - dev * kurt
0.5 - dev * hkurt
And the resulting output of it u seen at the beginning of the post, notice how the edges *almost* match your lovely golden ratio.
For wanderers:
Now for the wanderers, creators etc etc etc
We might have a new math constant in our hands.
This can’t be a coincidence that limit levels (the ones at the edges) almost match the golden ratio . What if we find some kind of ‘almost’ uniform distro, where the limit levels would ‘exactly’ match the golden ratio? No problem - Beta distribution with parameters alpha = beta = (smth just a bit greater than 1).
I solved it numerically in python with mpmath library (necessary for high precision stuff, default packages are gonna truncate too much and we work with gamma functions there, high powers, huge numbers).
The following constant used as both parameters for Beta distribution provides us an almost uniform beautiful distro, with a minimal necessary deviation from uniform distro if u pls, just with a lil bit gently smoothed corners, and all connected to fibonacci sequence and golden ratio:
1.013156499304251804283836146883597463164059088989506487984660881392552993230097518061037104047261922219476043198153474114525730243848097530913517155085537693517359999905511951459927003624291626547046737804828112785002512650…
… and it goes on and on. I called it Sagitta constant, because visually it creates that beautiful almost flat shape, the minimal natural curvature. And now if we put this as c in Beta(c, c) following the same levels construction method from before we get these levels:
std = 0.28741741
K = 1.80628205
Hk = 3.88993123
0.5 + std * hk = 1.61803398
0.5 + std * k = 1.01915692
0.5 + std = 0.78741741
0.5 = 0.5
0.5 - std = 0.21258258
0.5 - std * k = -0.01915692
0.5 - std * hk = -0.61803398
Visuals, plots, graphics
^^ here you can see how our resulting distro & derivatives look like, kinda cute aye?
Beta(c, c), where c is our constant Sagitta, actually might be a natural prior for Bayesian stuff, almost a boxcar windowing function for DSP so u gonna tame that famous spectral leakage, or a kernel for KDE, like u name it, every case when u need a uniform shape yet with slightly relaxed endpoints, you can use it in design and architecture.
Go for it bros, test it in your R&D. Maybe some1 gonna use it to prove Riemann assumption conjecture , if u get dat milli send me 25% ima find a good use for it.
∞
ETH/USDT 1W🔹 Overall Trend
We are still in an uptrend (trend line maintained from the March low).
However, momentum is weakening—a series of lower highs is forming, suggesting a local correction within the main trend.
🔹 Key Technical Levels
🟢 Resistance:
4,179 USDT – the current level that the price is testing as resistance.
4,407 USDT – the next strong resistance, where previous rejections occurred.
4,877 USDT – the main resistance resulting from the August highs.
🔴 Support:
3,916 USDT – almost identical to the above (demand zone).
3,561 USDT – key structural support; loss of this level = possible trend change.
🔹 Formation and Structure
The current pattern could form a potential ascending triangle, with the trendline (black) connecting the lows and the horizontal resistance lines marking the upper boundary of the consolidation.
If a breakout occurs above 4,180–4,400, a move to 4,800+ is possible.
However, if we break the trendline and 3,900, a move to 3,560–3,400 could occur, or even a test of 3,000 with significant selling pressure.
🔹 Volume
Volume is decreasing during consolidation → typical of an accumulation or distribution phase.
No clear breakout signal – the market is waiting for a trigger (e.g., macroeconomic data, ETFs, news about ETH 2.0).
🔹 Stochastic RSI (Bottom of the chart)
Located in the oversold zone (<20).
The %K line (blue) is attempting to cross the %D line (orange) from below – a signal of an early rebound.
If confirmed next week, a local rebound from the 3,900–4,000 zone could occur.
🔹 Scenarios:
✅ Bullish:
Breakout from the trendline + breakout above 4,180 → target 4,400, then 4,880.
Confirmation by increasing volume and the Stoch RSI emerging from oversold territory.
❌ Bearish:
Breakout of the trendline and 3,900 → target 3,560, then 3,200.
Increasing downward volume + no bullish reaction at the support levels.

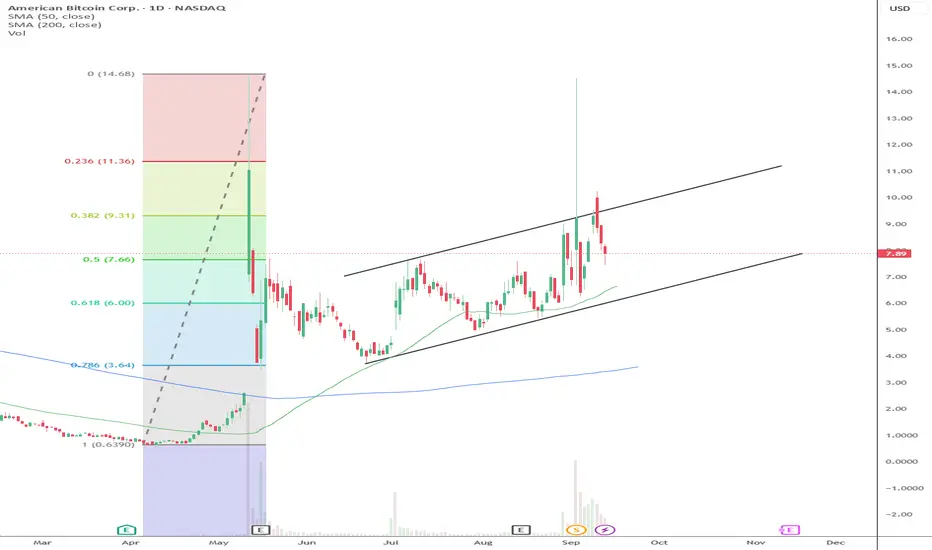
Opendoor Technologies (OPEN) – Bulls Still Holding the Door OpenWhat a ride it’s been for OPEN!
Back in early July 2025, the stock finally broke above its 50-day MA, and that was the spark that started an incredible rally — all the way to a major resistance zone from June 2022.
Then, as always, the market had to test everyone’s patience — a shooting star reversal formed, price pulled back into the 0.382–0.5 Fibonacci zone, and built a solid double bottom.
Once that double bottom broke out around 13–14 August, it was rocket fuel — a massive +247% run until 11 September 2025! 🚀
Since that peak, OPEN has been cooling off — retracing with low volume and shaping a falling wedge, which usually hints at bullish continuation. The price even bounced at EMA-50 and printed a hammer candle, showing that buyers are still defending the trend.
As long as the price holds above $6.23 (hammer support), bulls are still in charge.
Break that level? Then the bears might finally get a turn.
Until then — the door’s still open for another breakout! 😉
Trade Idea 💡
Bullish scenario: Wait for a breakout above the falling wedge with volume — that’s your green light.
Support to watch: $6.23 (hammer low).
Stop loss: Just below that support.
Take profit: Trail as long as price stays above the MA-50 or aim for the $13.70 zone .

Trump Coin Wave Analysis – 29 October 2025
- Trump Coin broke resistance area
- Likely to rise to resistance level 9.55
Trump Coin recently broke the resistance area between the round resistance level 8.0000 (which stopped the previous wave iv, former strong support from August) and the 61.8% Fibonacci correction of the downward impulse from July.
The breakout of this resistance zone follows the earlier breakout of the two resistance trendlines from July and May.
Given the strongly bullish sentiment seen today, Trump Coin can be expected to rise to the next resistance level 9.55 (which has been reversing the price from August).

Too soon... Pump and Dump... Long Term Hold...ABTC has fluctuated highs and lows, where is the floor, how high can this go with time. I did buy under $7 and am going to hold for a while. My overall concensus is bullish simply due to my belief that Bitcoin will continually move higher and higher.
I have no timeframe on selling, this is more of a Buffet style, buy and hold forever.
I am not a trader and have no professional experience.
$TRUMP : Early Rally Before Market News💥 Looks like grandpa $Trump 🧓 knows something we don’t!
Seems he “gave the signal” to start pumping his token before the positive news hits the market 😏
🕗 Big announcements expected today and tomorrow — and that could seriously shake things up.
📊 Honestly, if someone showed us the OKX:TRUMPUSDT chart without saying what it is, we’d say there’s clear upside potential — at least up to $16.
⚖️ What do you think — is this the start of a new pump, or just a quick spike before a dump?
______________
◆ Follow us ❤️ for daily crypto insights & updates!
🚀 Don’t miss out on important market moves
🧠 DYOR | This is not financial advice, just thinking out loud.

CAT watch $586-591: Dual Fib resistance that may give a DIP buyCAT got a nice boost from latest earnings report.
It spiked into a Dual Fib zone at $586.82-591.90
Look for a Break-n-Retest or Dip-to-Fib to buy.

DowJones (DJI) IntraSwing Levels for 29th OCT 2025🚀 "Future Levels ( Ticker:MYM1! -CBOT )" mentioned in BOX format.
🌡️Plot Levels Using 3 Min, 5 Min Time frame in your Chart for Better Analysis
L#1: If the candle crossed & stays above the “Buy Gen”, it is treated / considered as Bullish bias.
L#2: Possibility / Probability of REVERSAL near RLB#1 & UBTgt
L#3: If the candle stays above “Sell Gen” but below “Buy Gen”, it is treated / considered as Sidewise. Aggressive Traders can take Long position near “Sell Gen” either retesting or crossed from Below & vice-versa i.e. can take Short position near “Buy Gen” either retesting or crossed downward from Above.
L#4: If the candle crossed & stays below the “Sell Gen”, it is treated / considered a Bearish bias.
L#5: Possibility / Probability of REVERSAL near RLS#1 & USTgt
HZB (Buy side) & HZS (Sell side) => Hurdle Zone,
*** Specialty of “HZB#1, HZB#2 HZS#1 & HZS#2” is Sidewise (behaviour in Nature)
Rest Plotted and Mentioned on Chart
Color code Used:
Green =. Positive bias.
Red =. Negative bias.
RED in Between Green means Trend Finder / Momentum Change
/ CYCLE Change and Vice Versa.
Notice One thing: HOW LEVELS are Working.
Use any Momentum Indicator / Oscillator or as you "USED to" to Take entry.
⚠️ DISCLAIMER:
The information, views, and ideas shared here are purely for educational and informational purposes only. They are not intended as investment advice or a recommendation to buy, sell, or hold any financial instruments. I am not a SEBI-registered financial adviser.
Trading and investing in the stock market involves risk, and you should do your own research and analysis. You are solely responsible for any decisions made based on this research.
"As HARD EARNED MONEY IS YOUR's, So DECISION SHOULD HAVE TO BE YOUR's".
Do comment if Helpful .
In depth Analysis will be added later (If time Permits)

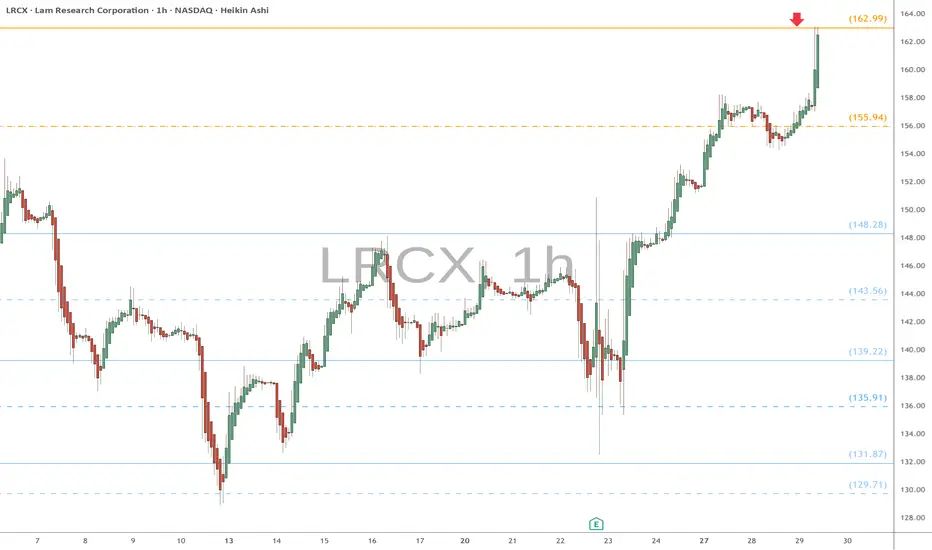
LRCX heads up at $162.99: Golden Genesis fib should give a DIP This is a followup to my previous long call below.
LRCX got a boost from the last Earnings report.
It has just hit a Golden Genesis fib at $162.99
Look for a Break-n-Retest or a Dip-to-Fib to buy.
.
Last Plot that gave a PERFECT LONG:
Hit BOOST and FOLLOW for more such PRECISE and TIMELY charts.
=========================================================
.
Ford’s 50% RetracementFord Motor jumped last week, and some traders may think there’s still gas in the tank.
The first pattern on today’s chart is the rally after third-quarter results beat estimates. The surge overcame a resistance level from earlier in the month and established a new 15-month high for the Dearborn automaker.
Second, F pulled back but is holding a 50 percent retracement of the move. That may confirm its direction is pointing higher.
Third, MACD is rising. The 8-day exponential moving average (EMA) is also above the 21-day EMA. Those signals may reflect a bullish short-term trend.
Finally, F is an active underlier in the options market. (Its average volume of about 260,000 contracts per session in the last month ranks 15th in the S&P 500, according to TradeStation data.) That could help traders take positions with calls and puts.
TradeStation has, for decades, advanced the trading industry, providing access to stocks, options and futures. If you're born to trade, we could be for you. See our Overview for more.
Past performance, whether actual or indicated by historical tests of strategies, is no guarantee of future performance or success. There is a possibility that you may sustain a loss equal to or greater than your entire investment regardless of which asset class you trade (equities, options or futures); therefore, you should not invest or risk money that you cannot afford to lose. Online trading is not suitable for all investors. View the document titled Characteristics and Risks of Standardized Options at www.TradeStation.com . Before trading any asset class, customers must read the relevant risk disclosure statements on www.TradeStation.com . System access and trade placement and execution may be delayed or fail due to market volatility and volume, quote delays, system and software errors, Internet traffic, outages and other factors.
Securities and futures trading is offered to self-directed customers by TradeStation Securities, Inc., a broker-dealer registered with the Securities and Exchange Commission and a futures commission merchant licensed with the Commodity Futures Trading Commission). TradeStation Securities is a member of the Financial Industry Regulatory Authority, the National Futures Association, and a number of exchanges.
Options trading is not suitable for all investors. Your TradeStation Securities’ account application to trade options will be considered and approved or disapproved based on all relevant factors, including your trading experience. See www.TradeStation.com . Visit www.TradeStation.com for full details on the costs and fees associated with options.
Margin trading involves risks, and it is important that you fully understand those risks before trading on margin. The Margin Disclosure Statement outlines many of those risks, including that you can lose more funds than you deposit in your margin account; your brokerage firm can force the sale of securities in your account; your brokerage firm can sell your securities without contacting you; and you are not entitled to an extension of time on a margin call. Review the Margin Disclosure Statement at www.TradeStation.com .
TradeStation Securities, Inc. and TradeStation Technologies, Inc. are each wholly owned subsidiaries of TradeStation Group, Inc., both operating, and providing products and services, under the TradeStation brand and trademark. When applying for, or purchasing, accounts, subscriptions, products and services, it is important that you know which company you will be dealing with. Visit www.TradeStation.com for further important information explaining what this means.

Gold sellPrice is in a POI and intraday structure is bearish. Plus, at current price action there is a structural disruption.

NVTS: trend structure updatePrice continues to follow through with the trend structure outlined in the Aug–Oct updates, showing an orderly consolidation toward the local support zone and rising moving averages.
If price manages to hold above the 21dEMA, I expect at least one more push higher into the 19–22 resistance zone before a potential longer consolidation and base-building phase.
Alternatively, failure to break out above the October lower high would shift the odds toward the mid-term top being in, suggesting a deeper move into the mid-term support area at 11–9 levels.
Chart:
Previously:
• On mid-term support (Aug 25):
Chart:
www.tradingview.com
• On higher low potential (Sep 26):
Chart:
www.tradingview.com
• On break-out and support (Weekly Chart Review – Oct 10):
Chart:
• On gap-up and follow-through (Oct 14):
Chart:
www.tradingview.com

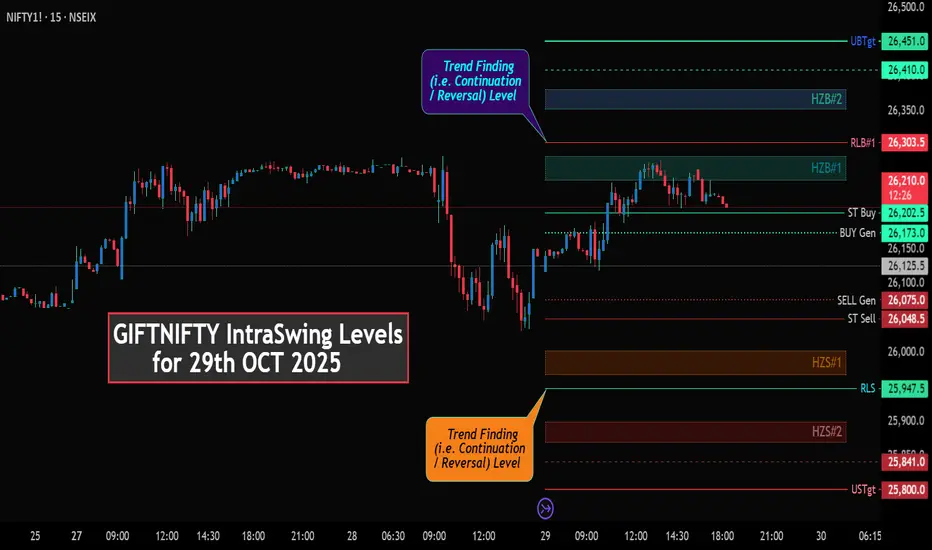
GIFTNIFTY IntraSwing Levels for 29th OCT 2025🌡️Plot Levels Using 3 Min, 5 Min Time frame in your Chart for Better Analysis
L#1: If the candle crossed & stays above the “Buy Gen”, it is treated / considered as Bullish bias.
L#2: Possibility / Probability of REVERSAL near RLB#1 & UBTgt
L#3: If the candle stays above “Sell Gen” but below “Buy Gen”, it is treated / considered as Sidewise. Aggressive Traders can take Long position near “Sell Gen” either retesting or crossed from Below & vice-versa i.e. can take Short position near “Buy Gen” either retesting or crossed downward from Above.
L#4: If the candle crossed & stays below the “Sell Gen”, it is treated / considered a Bearish bias.
L#5: Possibility / Probability of REVERSAL near RLS#1 & USTgt
HZB (Buy side) & HZS (Sell side) => Hurdle Zone,
*** Specialty of “HZB#1, HZB#2 HZS#1 & HZS#2” is Sidewise (behaviour in Nature)
Rest Plotted and Mentioned on Chart
Color code Used:
Green =. Positive bias.
Red =. Negative bias.
RED in Between Green means Trend Finder / Momentum Change
/ CYCLE Change and Vice Versa.
Notice One thing: HOW LEVELS are Working.
Use any Momentum Indicator / Oscillator or as you "USED to" to Take entry.
⚠️ DISCLAIMER:
The information, views, and ideas shared here are purely for educational and informational purposes only. They are not intended as investment advice or a recommendation to buy, sell, or hold any financial instruments. I am not a SEBI-registered financial adviser.
Trading and investing in the stock market involves risk, and you should do your own research and analysis. You are solely responsible for any decisions made based on this research.
"As HARD EARNED MONEY IS YOUR's, So DECISION SHOULD HAVE TO BE YOUR's".
Do comment if Helpful .
In depth Analysis will be added later (If time Permits)