ishares Core US Aggregate BOND ETFThis ETF has broken Flag pattern in style after long consolidation.
Expecting price to scale up..
Entry price: 100.46
Stop loss: 99.36
Targets: 100.9,101,103.41
Fibonacci

Dow Could Be Gearing Up for a Run Toward 50,000We’ve seen it before—and we might be seeing it again . The Dow Jones is showing a familiar pattern, and here’s what’s happening:
The index has been repeatedly hitting the 1.618 Fibonacci extension from previous ranges.
Right now, we’re approaching the 100% extension between the last swing high (~45,000) and swing low (~36,600).
If the Dow breaks above that previous high at 45,000, there's a good chance we’ll see the pattern repeat—with 50,000 as the next target.
It’s all about that breakout confirmation. Until then, we watch and wait.
This market has a memory—let’s see if it chooses to repeat it again.

ABEVTechnical Analysis:
Surge in volume at the end of an ABC impulse
Deep bullish divergence on the MACD
Accumulation is taking place at the 0.786 Fibonacci retracement level

UJ ShortM/W: Uptrend, hitting resistance level
D: Uptrend, respecting the lows
4H: Downtrend, price broke trend and retraced 61.8% on major FIB
1H: Uptrend, price is consolidating and resisting previous zone + BEARISH divergence on RSI.
CURRENTLY: I'm looking for price to go short to previous support/resistance zone
Exits
TP1 @ minor support/resistance
TP2 @ previous major resistance zone

GU ShortW: Uptrend, respecting the lows
D: Uptrend, price made a new high
H4: Downtrend, price hit -27 on 4H
1H: Downtrend, price hit retraced 50% so far
CURRENTLY: I'm looking for price to go short to previous support / resistance area @ H4 -61.8 FIB

eBay - Breaking Down the StructureLet’s take a look at eBay stock from the very beginning up to today:
What do we see?
A completed wave structure and an almost completed Fibonacci structure as well.
The peak came in at 101 , which is close to the 105 Fibonacci level.
Now let’s zoom in on the larger fifth wave:
The move started in late September 2022, and this structure also looks complete.
The corrective move from mid-August 2025 confirms this.
A push toward 105 looks unlikely, though it can’t be completely ruled out.
Either way, the broader bias remains to the downside.
For now, let’s focus on the smaller timeframe,
specifically the fifth wave on a lower degree.
Key targets:
75
71
66
The potential move from the current level is 14-23% .
On a broader scale, a sizable correction within the fifth wave is expected.
---
Subscribe and leave a comment.
You’ll get new ideas faster than anyone else.
---

BMW is in a clear weekly uptrend, with price stair‑stepping highBMW is in a clear weekly uptrend, with price stair‑stepping higher as investors lean into its improving earnings profile, EV rollout, and capital returns.
Management expects strong demand into 2026 and is backing that view with a sizeable 2025–2027 share buyback programme, which supports EPS growth and underpins the trend while Neue Klasse EV models ramp.
This idea treats BMW as a trend‑following long!

NZDUSD LONGSSimple price flow, change of fractal structure and now let's wait for the 1H pullback to retest 4H EMA

Ethereum - Looking To Sell Pullbacks In The Short TermH4 - Strong bearish move.
No opposite signs.
Currently it looks like a pullback is happening.
Expecting bearish continuation until the two Fibonacci resistance zones hold.
If you enjoy this idea, don’t forget to LIKE 👍, FOLLOW ✅, SHARE 🙌, and COMMENT ✍! Drop your thoughts and charts below to keep the discussion going. Your support helps keep this content free and reach more people! 🚀

NQ Power Range Report with FIB Ext - 2/10/2026 SessionCME_MINI:NQH2026
- PR High: 25395.50
- PR Low: 25328.00
- NZ Spread: 151.0
Key scheduled economic events:
08:30 | Retail Sales (Core|MoM)
Session Open Stats (As of 12:45 AM)
- Session Open ATR: 499.95
- Volume: 34K
- Open Int: 259K
- Trend Grade: Long
- From BA ATH: -5.4% (Rounded)
Key Levels (Rounded - Think of these as ranges)
- Long: 26691
- Mid: 25544
- Short: 23372
Keep in mind this is not speculation or a prediction. Only a report of the Power Range with Fib extensions for target hunting. Do your DD! You determine your risk tolerance. You are fully capable of making your own decisions.
BA: Back Adjusted
BuZ/BeZ: Bull Zone / Bear Zone
NZ: Neutral Zone

EPCL Pre-Result Technical + Fundamental View
EPCL’s daily chart looks technically constructive. Price has successfully tested the 200-day moving average (MA200) and is currently consolidating within the Fibonacci Golden Pocket of the recent impulsive wave, which is typically considered a healthy pullback. RSI is in the neutral-to-positive zone, and the price structure continues to form higher lows, supporting the case for upside continuation.
Trade Setup (Technical):
Entry Zone: 31.70 to CMP (buy on dips)
Stop Loss: 30.75
Upside Targets:
34.00
35.75
38.00
Event Catalyst:
An upcoming Board Meeting / Annual Result in 3 days is expected to trigger volatility. If results come in better than expectations or losses narrow, it could fuel a technical breakout.
Fundamental Context:
EPCL is a leading PVC and chemical company in Pakistan
Recent quarters have seen earnings pressure due to higher energy costs and weaker PVC pricing; however, much of this negativity appears to be already priced in
Any margin improvement, reduction in losses, or a positive management outlook could significantly improve short-term sentiment.
Final View:
The risk–reward is favorable at current levels. With a solid technical base and an upcoming event catalyst, a short-term upside swing is possible. However, strict stop-loss discipline is essential around the result announcement.

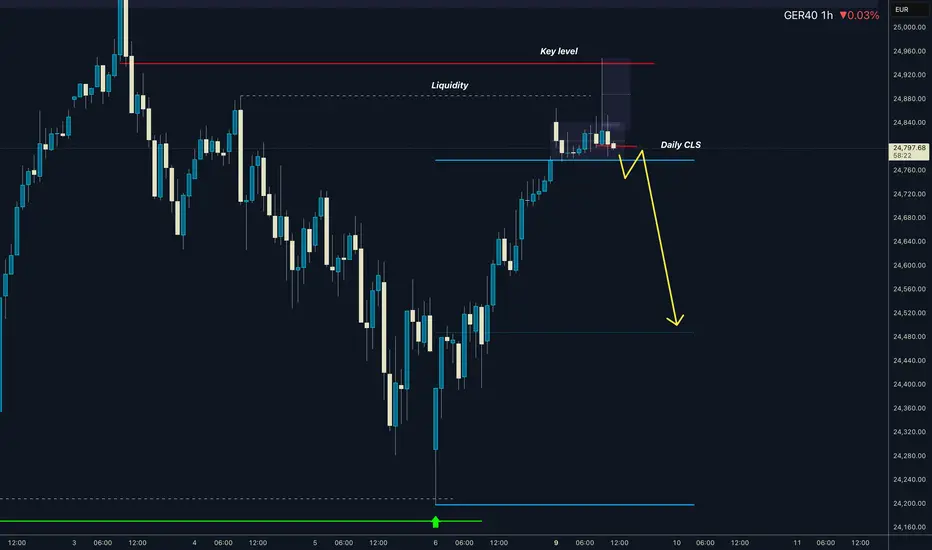
GER 40 - Daily - CLS - Model 1- 50% TP Hi friends, new range created. As always we are looking for the manipulation in to the key level around the range. Don't forget confirmation switch from manipulation phase to the distribution phase to make the setup valid. Stay patient and enter only after change in order flow. If price reaches 50% of the range take partial or full close.
👊 Trade Visual
I promised myself I’d become the person I once needed the most as a beginner. Below are links to a powerful lessons I shared on Tradingview. Hope it can help you avoid years of trial and error I went thru.
📊 Sharpen your trading Strategy
⚙️ 100% Mechanical System - Complete Strategy
🔁 Daily Bias – Continuation
🔄 Daily Bias – Reversal
🧱 Key Level – Order Block
📉 How to Buy Lows and Sell Highs
🎯 Dealing Range – Enter on pullbacks
💧 Liquidity – Basics to understand
🕒 Timeframe Alignments
🚫 Market Narratives – Avoid traps
🐢 Turtle Soup Master – High reward method
🧘 How to stop overcomplicating trading
🕰️ Day Trading Cheat Code – Sessions
🇬🇧 London Session Trading
🔍 SMT Divergence – Secret Smart Money signal
📐 Standard Deviations – Predict future targets
🎣 Stop Hunt Trading
💧 Liquidity Sweep Mastery
🔪 Asia Session Setups
📀 Gold Strategy
🧠 Level Up & Mindset
🛕 Monk Mode – Transition from 9–5 to full-time trading
⚠️ Trading Enemies – Habits that destroy success
🔄 Trader’s Routine – Build discipline daily
💪 Get Funded - $20 000 Monthly Plan
🧪 Winning Trading Plan
⭕ Backtesting vs Reality
🛡️ Risk Management
🏦 Risk Management for Prop Trading
📏 Risk in % or Fixed Position Size
🔐 Risk Per Trade – Keep consistency
🧪 Risk Reward vs Win Ratio
💎 Catch High Risk Reward Setups
☯️ Smart Money - Who control Markets
Adapt useful, Reject useless and add what is specifically yours.
David Perk
Bitcoin Short-term Long and Long-term ShortIn this video, I gave a walkthrough on the wave counts for bitcoin, revising on the big picture cycle level count, and then go into details on the 5-waves breakdown of the down move in Bitcoin.
I believe that Bitcoin will rally in a correction and move up to $80,472, the first resistance set by the previous wave 3 low and then go down for a wave C with the first target of $49,350. But that is not the ultimate target. The ultimate target sees Bitcoin falling to around $15,000, which is the cycle wave 2 low.
Good luck!

LITE: at the upper resistancePrice has approached the upper resistance zone: 460–630.
Watching for signs of a topping process to start unfolding in the coming weeks.
Chart (Weekly):

Particle Network PARTI price analysisWhile the whole crypto market is busy asking “is this the bottom or not?”, CRYPTOCAP:PARTI seems to be living in its own reality 😏
And that’s not surprising.
Particle Network has a market cap of only ~$25M, which means thinner liquidity and much more freedom for market makers to shape price action.
🔍 Scenario:
If OKX:PARTIUSDT gets confirmed above the trendline, for example above $0.086, there are currently very few technical obstacles up to the $0.16+ zone.
That opens the door for a potential x2 move, assuming structure holds.
⚠️ At the same time, low cap means volatility works both ways — fast upside moves, but also sharp pullbacks if momentum fades.
❓ Do you see CRYPTOCAP:PARTI as a controlled breakout in the making, or just short-term noise while the broader market is undecided ?
______________
◆ Follow us ❤️ for daily crypto insights & updates!
🚀 Don’t miss out on important market moves
🧠 DYOR | This is not financial advice, just thinking out loud

GBPUSD 30M – Bullish Breakout After Fib Retracement (0.618)GBPUSD on the 30-minute timeframe shows a strong bullish continuation setup.
Price previously sold off and completed a deep pullback into the Fibonacci retracement zone 0.618, which aligned with a clear demand/support area. This zone held well and price reacted strongly, printing a sharp impulsive bullish move back above structure.
Currently, price has reclaimed the key level around 1.3660, indicating buyers are in control. As long as price holds above the retracement zone, bullish continuation toward the next liquidity and resistance area is favored.
Trade idea:
- Bias: Bullish
- Entry: On pullbacks or confirmation above structure
-Invalidation: Clean break and close below the Fib support zone
Target: Previous highs / next resistance area

AUD/CAD Market Analysis: Macro + Structure [MaB]1. The Macro Context (The "Why") 🌍
Hi traders! Before looking at the candles, let's look at the money.
My fundamental scoring table is giving us a clear signal: we have a +5 differential, pointing toward a Bullish (Moderate) bias that we simply can't ignore. 🏦
Key Factor Analysis:
🏦 Current Rates: Explanation: RBA at 3.6% offers elevated and competitive yields compared to the BOC's mid-low 2.25% stance. Score AUD: +1 | Score CAD: 0
🌍 Economic Regime: Explanation: AUD is in a Reflation regime with accelerating inflation (+0.79%), while CAD shows signs of Stagflation with a borderline 50.9 Manufacturing PMI. Score AUD: +2 | Score CAD: -1
📊 Rate Expectations: Explanation: RBA remains hawkish following a recent +25bp hike; BOC maintains a neutral "prolonged holding" stance. Score AUD: +1 | Score CAD: 0
⚖️ Risk Sentiment: Explanation: Market sentiment is currently neutral for both currencies with no specific bias. Score AUD: 0 | Score CAD: 0
🏛️ COT Score: Explanation: Both currencies show maximum bullishness from speculators with a strong acceleration in long positions. Score AUD: +2 | Score CAD: +2
Currency Score Summary:
Total Score AUD: +6 (Strong Bullish)
Total Score CAD: +1 (Neutral/Positive)
Synthesis:
💡 AUD (Very Strong, Score +6): Driven by a hawkish RBA, solid 2.3% GDP, and strong PMI expansion.
💡 CAD (Positive, Score +1): Supported by COT data and target inflation, but weighed down by moderate 1.6% GDP and weak manufacturing.
Conclusion: Given this fundamental backdrop, we are strictly looking for Long setups. Going against this bias would be statistical suicide. 🚫
2. The Technical Setup (The "Where") 📉
Timeframe: 1h | Pair: AUD/CAD
The SMC Market Structure + Price Zones indicator has confirmed our statistical edge. Here’s the probabilistic data from the dashboard:
🚀 Continuation Rate (63.6%): We are currently above the 60% threshold. This confirms a healthy directional trend where continuation has a much higher probability than a reversal.
🔥 Streak Analysis (0): We are currently on impulse number 1 (start of a new cycle).
Expected Streak: 1 | 2 | 3 (Percentile: 55.2%)
Remaining Moves: 1 to 2. This indicates a Young trend.
🔄 Retest & Reaction:
Retest Prob (67.5%): High probability of the price returning to test the demand zone after the Break of Structure (BOS).
BOS/Ret Rate (55.2%): Once inside the zone, there is a solid probability of a positive reaction leading to a new BOS.
🎯 Extension & Projection:
Extension Range: The expected extension for this single leg is between 1.50x and 2.78x (Expected: 1.78x).
Compound Extension (2.45x): This is the total projected move based on the remaining expected impulses.
3. Execution Plan on Chart 🎯
Moving over to the charts, we are using these statistics to define our operational levels:
📍 Entry and Stop Loss: We are placing a limit entry within the Demand Zone 1h (Cyan/Blue Band) . The stop loss is tucked a few pips outside the zone at 0.95023 to protect against structural invalidation.
🏁 Statistical Take Profit: Instead of an arbitrary target, we are leveraging the Compound Extension . We project the target at 2.45x relative to the pullback zone height, aligning with the 0.98553 level. This allows us to capture the full extension projected by the algorithm. 🏆
Trade Parameters:
💰 Entry Price: 0.95583
🛡️ Stop Loss: 0.95023
🏆 Take Profit: 0.98553
⚠️ Disclaimer: This analysis is based on a proprietary algorithm and is shared exclusively for educational and didactic purposes. It does not constitute financial advice or investment solicitation in any way. Trading involves significant risk.

Macro Trend Overview: BTC, SOL, ETH, XRPAcross all major assets, price has approached the first macro-support zones and appears to be in the final stage of multi-month corrective structures from their all-time highs.
At the same time, structural room still exists for one more corrective leg toward deeper macro-support levels.
As long as price remains within the ranges outlined below, the base scenario remains unchanged: completion of the correction phase followed by at least a medium-term recovery period.
BTC
Key macro-support: 62,500–56,200 and 52,600
⸻
SOL
Key macro-support: 81.60–62.5 and 53–48.5
⸻
ETH
Key macro-support: 1,790–1,540 and 1,400
⸻
XRP
Key macro-support: 1.27–1.04 and 0.88–0.85
⸻
Thank you for your attention, and wishing everyone successful trades ahead!

BTC/USD where to GET out !!I’m seeing some resistance for Bitcoin around the 104 level.
Some people are saying a rate cut will push the price higher and trigger a big move afterward. But let’s be honest — rate cuts are already priced in. Any move up from here could easily turn into a trap.
Either way, make sure you’re protecting your capital.
This is your hard-earned money — don’t trade with emotions.

GBPCAD SHORT price pushing into the 50% area at (1.61000) sat just above recent resistance, looking at price grabbing this resistance and liquidity before continuing to downside.

SOL, Finding support for a bottom?CRYPTOCAP:SOL took a hit last week on the capitulation event, printing a strong bottoming candle with a long lower wick.
Price has now reached my wave 4 ytarget of the 0.382 Fibonacci retracement at the major High Volume Node support, between the S1 nd S2 pivot.
Daily RSI hit oversold, but with no divergence. The trend remains down, below the daily pivot and daily 200EMA, but could be finding a bottom soon.
Safe trading

IREN Still lower to complete wave 4NASDAQ:IREN printed another daily bearish divergence in a downtrend, signalling continued momentum to the downside. Price met the 200EMA and caught a bid Friday closing its candle only +5%, a far cry from the competitors last week, considering its volatility, showing weakness.
The narrative and buzz of the bull run is still being sold into as investors are still greedy.
Wave C of 4 has a termina target f the major High Volume Node support and 0.382 Fibonacci retracement, the highest probability area for wave 4 to end, $27.
Daily RSI has room to fall. The daily pivot is lost.
Safe trading

AUD/CHF Market Analysis: Macro + Structure [MaB]1. The Macro Context (The "Why") 🌍
Hi traders! Before looking at the candles, let's look at the money.
My fundamental scoring table is giving us a clear signal: we have a +7 differential, pointing toward a Strong Bullish bias that we simply can't ignore.
Key Factor Analysis:
🏦 Current Rates: Explanation: AUD RBA at 3.6% offers competitive high rates, while CHF SNB remains at 0.0%, the lowest among majors. Score AUD: +1 | Score CHF: -1
🌍 Economic Regime: Explanation: Both currencies are in a Reflation regime, but AUD shows stronger acceleration (+0.79%). Score AUD: +2 | Score CHF: +1
📊 Rate Expectations: Explanation: RBA remains hawkish with a recent +25bp hike, whereas SNB is expected to hold rates for a prolonged period. Score AUD: +1 | Score CHF: 0
⚖️ Risk Sentiment: Explanation: Market appetite is currently neutral with no specific bias affecting these currencies. Score AUD: 0 | Score CHF: 0
🏛️ COT Score: Explanation: Speculators are maximally bullish on AUD with accelerating longs; CHF shows mixed signals despite a strong short position. Score AUD: +2 | Score CHF: 0
Currency Score Summary: Total Score AUD: +6 (Strong Bullish) Total Score CHF: -1 (Weak Bearish)
Synthesis:
💡 AUD (Strong, Score +6): Driven by a hawkish RBA, solid 2.3% GDP, and strong PMI expansion. 💡 CHF (Weak, Score -1): Weighted down by 0.02% deflation, modest growth, and manufacturing contraction (PMI 48.8).
Conclusion: Given this fundamental backdrop, we are strictly looking for Long setups. Going against this bias would be statistical suicide.
2. The Technical Setup (The "Where") 📉
Timeframe: 1h | Pair: AUD/CHF The SMC Market Structure + Price Zones indicator has confirmed our statistical edge. Here’s the probabilistic data from the dashboard:
🚀 Continuation Rate (65.1%): We are currently above the 60% threshold. This confirms a healthy directional trend where continuation has a much higher probability than a reversal.
🔥 Streak Analysis (1): We are currently on impulse number 1.
Expected Streak: 1 | 2 | 4 (Percentile: 20th-80th) Remaining Moves: This indicates a Young trend, suggesting significant room for further appreciation.
🔄 Retest & Reaction:
Retest Prob (75.2%): High probability of the price returning to test the demand zone. BOS/Ret Rate (56.7%): Once inside the zone, there is a solid probability of a positive reaction leading to a new Break of Structure.
🎯 Extension & Projection:
Extension Range: Expected extension for this leg is between 1.61x and 2.72x. Compound Extension (1.75x): This is the total projected move based on the remaining expected impulses.
3. Execution Plan on Chart 🎯
Moving over to the charts, we are using these statistics to define our operational levels:
📍 Entry and Stop Loss: We are placing a limit entry within the Demand Zone 1h (Cyan Band) . The stop loss is tucked a few pips outside the zone to protect against structural invalidation.
🏁 Statistical Take Profit: Instead of an arbitrary target, we are leveraging the Compound Extension . We project the target at 1.75x relative to the pullback zone height.
This allows us to capture the full extension projected by the algorithm. 🏆
Trade Parameters:
💰 Entry Price: 0.53949 🛡️ Stop Loss: 0.53653 🏆 Take Profit: 0.55654
⚠️ Disclaimer: This analysis is based on a proprietary algorithm and is shared exclusively for educational and didactic purposes.
It does not constitute financial advice or investment solicitation in any way. Trading involves significant risk.
