Lvvausdt heading towards strong supportLVVAUSDT appears to be heading toward the main demand zone, potentially completing a mid-term round-bottom formation. The plan is to accumulate within the outlined buy zone and monitor price reaction near the main supply area. A confirmed breakout above this level could trigger stronger momentum toward the final target around $0.033589.
Fibonacci

Cruusdt approaches strong supportCRUUSDT is approaching a strong support zone, with price action hinting at a possible ending diagonal to complete the broader WXY corrective structure.
Plan: watch for confirmation within the buy zone and look to follow the move toward the main sell-off area once momentum shifts.

SENSEX IntraSwing Levels for 27th Oct 2025🚀 "WEEKLY Levels" mentioned in BOX format.
🌡️Plot Levels Using 3 Min, 5 Min Time frame in your Chart for Better Analysis
L#1: If the candle crossed & stays above the “Buy Gen”, it is treated / considered as Bullish bias.
L#2: Possibility / Probability of REVERSAL near RLB#1 & UBTgt
L#3: If the candle stays above “Sell Gen” but below “Buy Gen”, it is treated / considered as Sidewise. Aggressive Traders can take Long position near “Sell Gen” either retesting or crossed from Below & vice-versa i.e. can take Short position near “Buy Gen” either retesting or crossed downward from Above.
L#4: If the candle crossed & stays below the “Sell Gen”, it is treated / considered a Bearish bias.
L#5: Possibility / Probability of REVERSAL near RLS#1 & USTgt
HZB (Buy side) & HZS (Sell side) => Hurdle Zone,
*** Specialty of “HZB#1, HZB#2 HZS#1 & HZS#2” is Sidewise (behaviour in Nature)
Rest Plotted and Mentioned on Chart
Color code Used:
Green =. Positive bias.
Red =. Negative bias.
RED in Between Green means Trend Finder / Momentum Change
/ CYCLE Change and Vice Versa.
Notice One thing: HOW LEVELS are Working.
Use any Momentum Indicator / Oscillator or as you "USED to" to Take entry.
⚠️ DISCLAIMER:
The information, views, and ideas shared here are purely for educational and informational purposes only. They are not intended as investment advice or a recommendation to buy, sell, or hold any financial instruments. I am not a SEBI-registered financial adviser.
Trading and investing in the stock market involves risk, and you should do your own research and analysis. You are solely responsible for any decisions made based on this research.
"As HARD EARNED MONEY IS YOUR's, So DECISION SHOULD HAVE TO BE YOUR's".
Do comment if Helpful .
In depth Analysis will be added later (If time Permits)

EUR/USD – Simplicity is Power.Don’t chase noise. Watch how market respects liquidity zones.Technical Summary
Bias: Bearish until price re-tests reversal zone
Pattern: Rising wedge → reversal → consolidation → continuation
Key Levels:
Resistance Zone: 1.1850 – 1.2000
Support Zone: 1.1150 – 1.1250
Sentiment: Smart money positioning for deeper liquidity grab

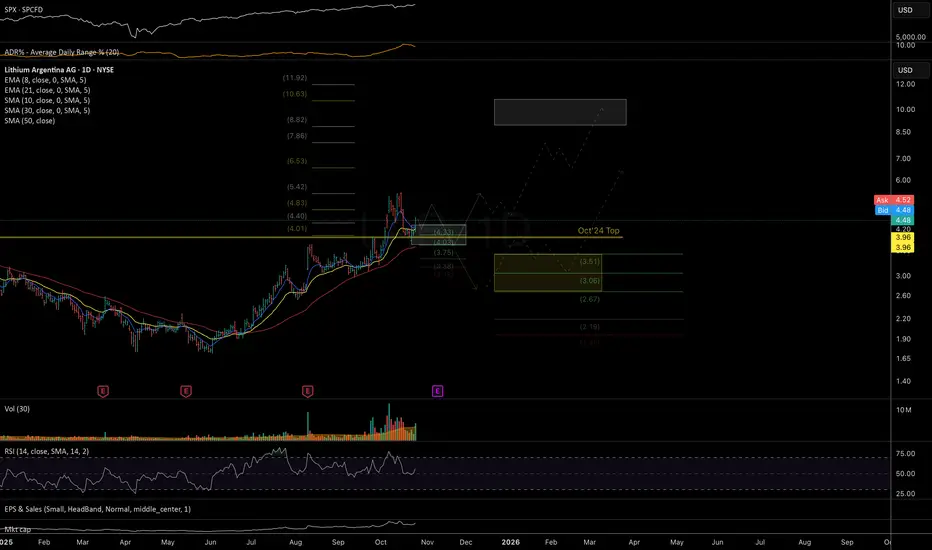
LAR: decent mid and long-term potential NYSE:LAR the unfolding trend structure shows decent macro potential, into Q4 and 2026.
Chart:
Two main zones to watch:
• Local support (more immediately bullish): 4.3–3.75 — if price holds here and starts closing above the 21dEMA, odds favor continuation toward next resistance zones. Although, I think we still might re-test the lower edge of this zone before a sustainable break-out emerges.
• Mid-term support: 3.50–2.70 — if price breaks below the 21dEMA and chooses to extend consolidation before the next leg higher.
Overall, the structure continues to favor a developing accumulation phase with solid medium-term upside potential once confirmation signals appear.
Gold at Crossroads: Supply Pressure vs Demand Rejection1. Market Structure
Overall, gold is currently in a corrective phase following a strong bullish rally. The latest move formed a Higher High (HH) around 4,350–4,360, followed by a sharp rejection — signaling that supply pressure has started to take control.
2. Supply Zone & SELL Potential
Strong Supply Zone (4,336–4,350): This is a key resistance area where price previously faced heavy rejection. If price retests this level, it could provide a potential SELL setup, especially if a clear reversal candle such as a bearish engulfing or shooting star appears.
However, if this zone is broken with a solid bullish candle, the market could likely print a new All-Time High (ATH) in line with the medium-term bullish momentum.
3. Golden Ratio Supply Area (around 4,246–4,264)
This area acts as both a Take Profit zone for prior long positions and a directional confirmation zone. A failure to break above could trigger another rejection and deeper pullback, strengthening short-term bearish pressure.
4. Secondary Reaction Area (around 4,150)
This zone has been tested three times, confirming a strong short-term supply presence.
Plan: wait for a strong bullish breakout candle above this area to validate a continuation move. If another rejection forms, price could head back toward the Demand Area (4,065–4,043).
5. Demand Area (4,065–4,043)
A key level for potential BUY setups. Look for a clear bullish reversal candle before entering. If this zone holds, the market could rebound higher.
But if it breaks down, price may extend lower toward the Major Demand zone (3,974–3,986).
6. Major Demand (3,974–3,986)
A strong base zone capable of halting further downside movement. Suitable for swing BUY setups with a favorable risk-reward ratio, as long as price stays above this level.
Trading Plan Summary
BUY PLAN:
Wait for bullish confirmation near Demand Area (4,065–4,043) or Major Demand (3,974–3,986).
First targets: Secondary Reaction Area (4,150) and Golden Ratio Supply (4,246).
SELL PLAN:
Wait for clear rejection or reversal candle near Golden Ratio Supply (4,246) or Strong Supply (4,336–4,350).
Target: Demand Area (4,065–4,043).
Conclusion
Gold is currently in a neutral strategic zone, squeezed between strong supply and solid demand. The next directional move will largely depend on how price reacts around the Secondary Reaction Area and Demand Area.
The key principle: don’t predict—react to confirmation.

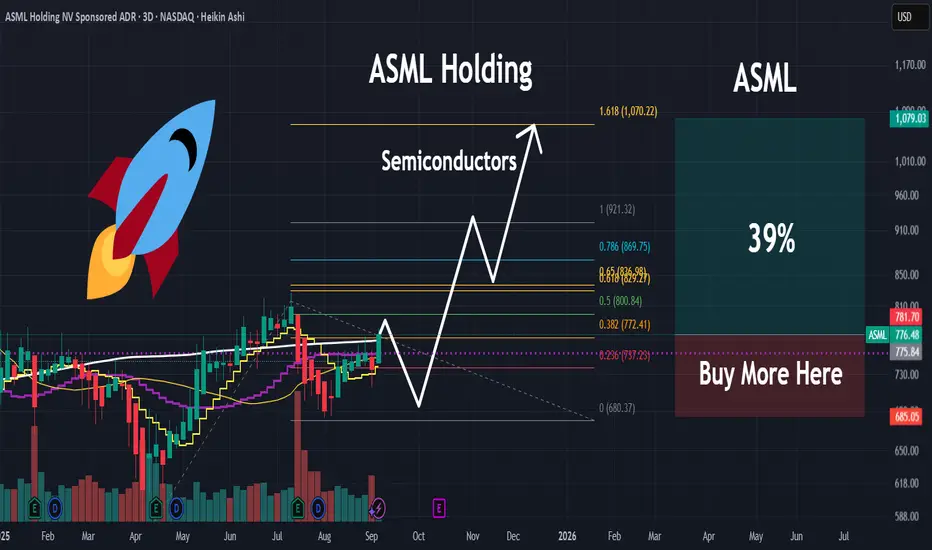
ASML | Something Is Brewing | SemiconductorsASML Holding NV engages in the development, production, marketing, sales, upgrading and servicing of advanced semiconductor equipment systems. It includes lithography, metrology and inspection systems. The company was founded on April 1, 1984 and is headquartered in Veldhoven, the Netherlands.
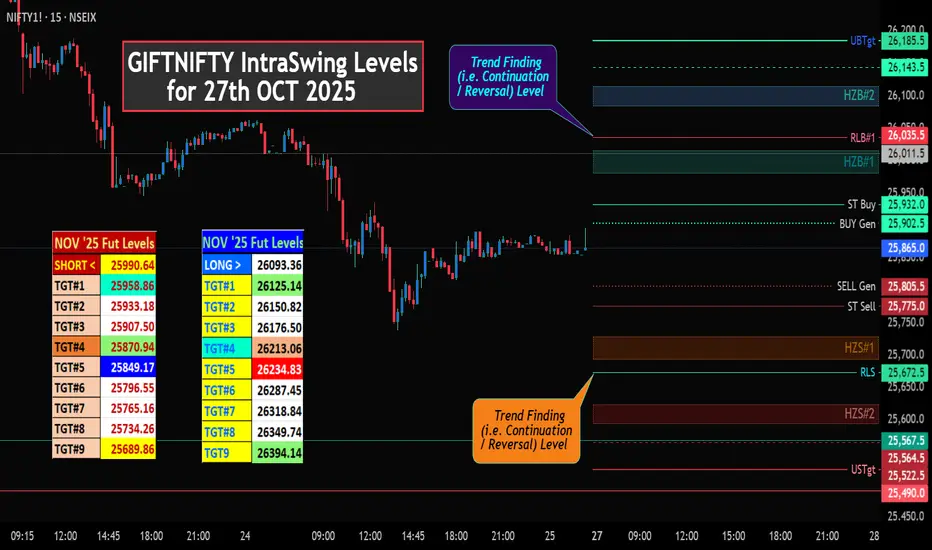
GIFTNIFTY IntraSwing Levels for 27th OCT 2025Majority Traders are not the participants to trade as Traded in Doller.
Publishing Chart to confirm trend of NiFTY as Roll over in Progress.
Max adjustable Premium 100 - 150 points.
If premium Drops below 80 point (without any Major NEWS / EVENT like Tariff WAR etc, Think about Long position & if Premium Increases & Crossed above 150+ points when Nifty Sidewise / Bearish Bias Think about Short position.
Remember one thing PREMIUM CALCULATED w.r.t NOVEMBER '25 (Near Exp Basis not Current Month
GIFTNIFTY November '25 Future Levels In BOX Format.
🚀 "WEEKLY Levels" mentioned in BOX format.
🌡️Plot Levels Using 3 Min, 5 Min Time frame in your Chart for Better Analysis
L#1: If the candle crossed & stays above the “Buy Gen”, it is treated / considered as Bullish bias.
L#2: Possibility / Probability of REVERSAL near RLB#1 & UBTgt
L#3: If the candle stays above “Sell Gen” but below “Buy Gen”, it is treated / considered as Sidewise. Aggressive Traders can take Long position near “Sell Gen” either retesting or crossed from Below & vice-versa i.e. can take Short position near “Buy Gen” either retesting or crossed downward from Above.
L#4: If the candle crossed & stays below the “Sell Gen”, it is treated / considered a Bearish bias.
L#5: Possibility / Probability of REVERSAL near RLS#1 & USTgt
HZB (Buy side) & HZS (Sell side) => Hurdle Zone,
*** Specialty of “HZB#1, HZB#2 HZS#1 & HZS#2” is Sidewise (behaviour in Nature)
Rest Plotted and Mentioned on Chart
Color code Used:
Green =. Positive bias.
Red =. Negative bias.
RED in Between Green means Trend Finder / Momentum Change
/ CYCLE Change and Vice Versa.
Notice One thing: HOW LEVELS are Working.
Use any Momentum Indicator / Oscillator or as you "USED to" to Take entry.
⚠️ DISCLAIMER:
The information, views, and ideas shared here are purely for educational and informational purposes only. They are not intended as investment advice or a recommendation to buy, sell, or hold any financial instruments. I am not a SEBI-registered financial adviser.
Trading and investing in the stock market involves risk, and you should do your own research and analysis. You are solely responsible for any decisions made based on this research.
"As HARD EARNED MONEY IS YOUR's, So DECISION SHOULD HAVE TO BE YOUR's".
Do comment if Helpful .
In depth Analysis will be added later (If time Permits)
Bitcoin Roadmap– Next Move Down Incoming?As I expected yesterday , Bitcoin ( BINANCE:BTCUSDT ) started rising from the Support zone($107,580-$106,700) and has now hit its Target at the Resistance zone($110,430-$109,380) .
Now the question is: will Bitcoin continue its short-term uptrend in the next few hours, or is it going to drop again? Stay with me to find out.
Bitcoin is trading near the Resistance zone($110,430-$109,380) , Potential Reversal Zone(PRZ) , and Cumulative Short Liquidation Leverage($111,613-$110,542) .
From an Elliott Wave perspective , it seems that Bitcoin is completing the wave C of an Expanding Flat Corrective Pattern(ABC/3-3-5) .
Given that the S&P 500 ( SP:SPX ) ( which has recently been correlated with Bitcoin ) is likely to drop when the U.S. market opens , I expect Bitcoin to resume its decline . This next drop might be the final push to break the Heavy Support zone($111,980-$105,820) .
What do you think? Can Bitcoin break that Heavy Support zone($111,980-$105,820) in the end or not? Let me know your thoughts!
Cumulative Long Liquidation Leverage: $106,606-$105,463
Please respect each other's ideas and express them politely if you agree or disagree.
Bitcoin Analysis (BTCUSDT), 15-minute time frame.
Be sure to follow the updated ideas.
Do not forget to put a Stop loss for your positions (For every position you want to open).
Please follow your strategy and updates; this is just my Idea, and I will gladly see your ideas in this post.
Please do not forget the ✅' like '✅ button 🙏😊 & Share it with your friends; thanks, and Trade safe.

Trend breakout BTC looks bullish, but it needs to remain above 112200 then 113,500 for 4 hrs to confirm bullishness
Targeting
114,700
115500
116200
118,000 here it should also stay solid for at least 4hrs then will target 120,000
If the bullish momentum remain then it should make new all time high


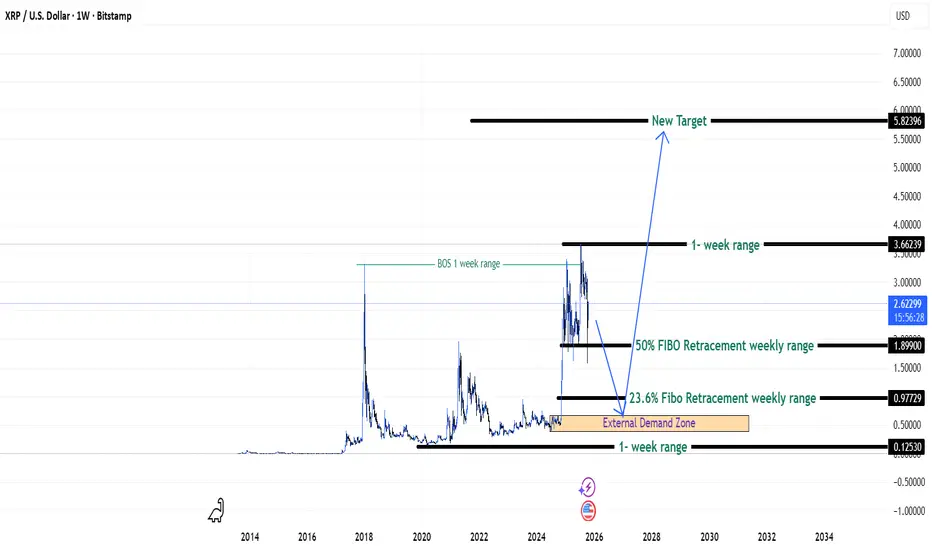
XRP Chasing New Highs - {26/10/2025}Educational Analysis says that XRPUSD or XRPUSDT (Crypto Pair) may give trend Trading opportunities from this range, according to my technical analysis.
Broker - Bitstamp
So, my analysis is based on a top-down approach from weekly to trend range to internal trend range.
So my analysis comprises of two structures: 1) Break of structure on weekly range and 2) Trading Range to fill the remaining fair value gap
Let's see what this Crypto Pair brings to the table for us in the future.
DISCLAIMER:-
This is not an entry signal. THIS IS FOR EDUCATIONAL PURPOSES ONLY.
I HAVE NO CONCERNS WITH YOUR PROFITS OR LOSS,
Happy Trading,
FX Pairs & Crypto Curreny Trade Analysis.
My Analysis is:-
Short term trend may be go to the external demand zone.
Long term trend breaks the new high after going from discount zone.
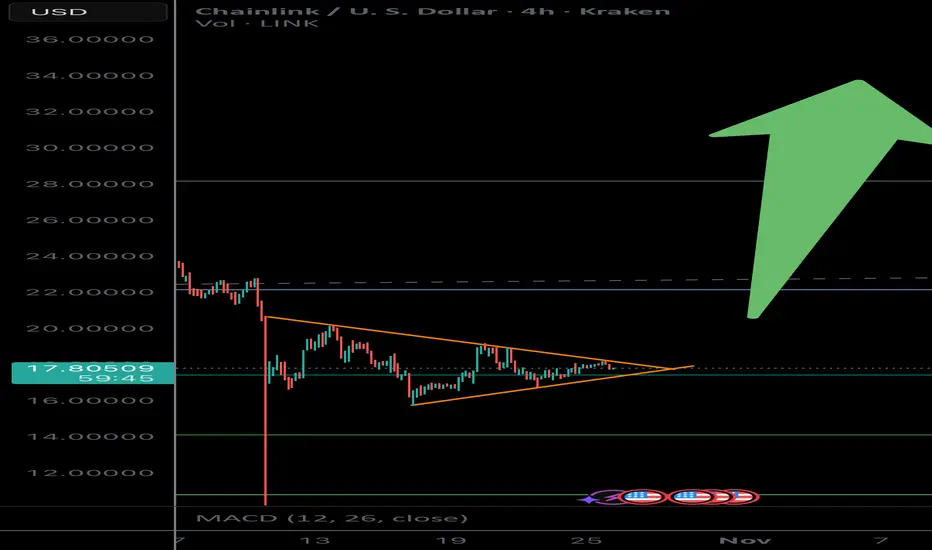
The Chainlink Standard Ecosystem BreakoutI’m very bullish on Chainlink again and now it’s more comprehensive ecosystem.
CRYPTOCAP:LINK $stLINK BSE:SDL reSDL $XSwap
I’ve been expecting a Q4 breakout. Recently federal regulations have been clarified and Chainlink’s institutional partners are now ready to adopt the CRYPTOCAP:LINK standard.
Price has consolidated and it’s ready for a break out in the next day or two. It’s plausible we see a false start or even trading sideways for a week. With such significant potential the following breakout will be … noteworthy.
Chainlink hosts their annual SmartCon on Nov 4. With guest like the US Federal Reserve, SWIFT, DTCC, etc, it is extremely likely to cause some commotion.
Bearish ModelI would love to see this bearish model play out early next week for GJ.
If not, I'd like to see price break above medium BSL before retesting it and eventually going up further.

S%P DROP AND GIVE ME 50....50K PLEASE LOLBias is BEARISH!
Hear me out tho lol!
First, we never predict; we estimate and wait! Price will tell us where it wants to go. Based on my estimate, we have big news this week that does not look very positive and could negatively affect American businesses and stocks, potentially leading to central sell pressure in the market. That, paired with no significant pullback on the D/HTF's, makes me estimate we should have nice sell ops.
4H Golden zone is around 6,809-50% and 6,801-.618%! (Great buy bounce area)
after that we have some IPP'S (important price points)
6,840 If passed and closed above we can see move to even HH's!
or
If we see a rejection to 6,801 price area we can see a dump taking out session IPP's and pushing to lower FVGs! (what I want lol)
so we are going to let the market play, while we wait....and GET PAID!!
GDluckThisWeek!

HEY NAZ, WHATS NEWS GONNA MAKE YOU DO?! NAZ Bias-Bearish(personally) HOWEVER-----
Let price show us the way. I believe that price will be looking for key levels to bounce around on before making its true climb or decline. The reason I am bearish this week is the belief that negative news is coming and a lack of pullbacks on daily/HTF charts. So sauce.... Im looking for price to come down and hit a fibs retracement at this FVG for a
GOOD BUY bounce! Around 25,428-25,394! First, setup; after that, the IPP (important price point) to look at will be how price interacts with 25,509-25,491. If it doesn't break above on a higher time frame, I believe we push LL to hit BIG FVG 25,214!! which i really want to buy from there but if it breaks above we can see a strong retest of SOB and HH's! Either way, WE GET PAID! Sitting on my hands until the price shows me where we're riding! GDluckThisWeek and happy hunting!

XAUUSD WXAUUSD is in an uptrend and may retest the marked area. After that, the trend is likely to continue. Key levels are important to monitor to see how the market reacts from this point.

RIOT | MASSIVE Rally Incoming | LONGRiot Platforms, Inc. is a bitcoin mining company, which engages in the provision of special cryptocurrency mining computers. It invests in Verady, Coinsquare, and Tess. It operates through the Bitcoin Mining and Engineering segments. The Bitcoin Mining segment focuses on maximizing ability to successfully mine Bitcoin by growing hash rate. The Engineering segment designs and manufactures power distribution equipment and custom engineered electrical products that provides them the ability to vertically integrate many of the critical electrical components and engineering service. The company was founded on July 24, 2000 and is headquartered in Castle Rock, CO.

RAIL | Railroads on the Rise | LONGFreightCar America, Inc. is engaged in the manufacturing of railcars and railcar components. It operates through the Manufacturing and Aftermarket segments. The Manufacturing segment includes new railcar manufacturing, used railcar sales, and railcar conversions and rebodies. The Aftermarket segment deals with the selling of forged, cast and fabricated railcar parts and supplies for all railcar types, and provides aftermarket services including safety training, railcar inspections, and preventative maintenance. The firm offers freight cars including box cars, covered hoppers, open top hoppers, gondolas, intermodal, and non-intermodal flat cars that transport dry bulk and containerized freight products. The company was founded in 1901 and is headquartered in Chicago, IL.

RUSS 2K....GOING WHICH WAY? HMMM CME_MINI:M2K1! Bias-Bearish HOWEVER!
Price is hitting some key areas and will show us whether it continues or dumps to key levels.
PP-2522-2514 are fib zones in a FVG so price could most def push higher to the S.O.B above (which is what a majority of signs show). However my personal belief with all the negative news I believe we will have this week, price will take some of these lows out and find a B.O.B below. Thats a theory but like always we let price tell us the true trend and direction! Now what is your theory for this week?
Either way, WE'RE GOING TO GET PAID!

QS | Autopart Industries on the Rise | LONGQuantumScape Corp. engages in developing next-generation solid-state lithium-metal batteries. The company's next-generation batteries are designed to enable greater energy density, faster charging, and enhanced safety to support the transition away from legacy energy sources toward a lower-carbon future. The company was founded by Jagdeep Singh, Tim Holme, and Fritz B. Prinz in May 2010 and is headquartered in San Jose, CA.

4H H/S Bullish reversal pattern possibility [short-term]4H H/S bullish reversal patten.
If neck-line breaks, potential rise to the ~.80 area.
Similar pattern on XLM/USD & XRP/USD are forming, with a breakout on XRP/USD already confirmed.

STNE | This FinTech Is Rockstar | LONGStoneCo Ltd. engages in the provision of financial technology solutions. It caters to merchants and partners that conduct electronic commerce across in-store, online, and mobile channels. The firm offers cloud-based technology platform, electronic payments, and automation of business processes at the point-of-sale. The company was founded by Andre Street de Aguiar in 2000 and is headquartered in George Town, Cayman Islands.
