DOGE / USD EWP TC FIB Analysis Weekly TFDOGE/USD – Weekly Macro Structure
DOGE remains within its long-term rising channel, with the 2021 peak marking a completed Cycle Wave III. Price is currently unfolding a Cycle Wave IV ABC correction:
A = 2021–22 decline, B = deep retracement rally, C = ongoing corrective move.
Wave C shows overlapping structure and weakening momentum, consistent with a corrective decline rather than a new bear trend. Strong confluence support lies at 0.03–0.04 USD (A=C equality, 0.382 retrace, channel support, prior base).
Above channel support, the macro bullish structure remains intact.
Cycle Wave V requires confirmation via impulsive breakout and RSI reclaim.
Fibonacci


22.01.26 NEXT TARGETThe previous bull-market target was $104,500, and it was reached. The extensions beyond that level surprised me as well, but the core target remained fully aligned with the technical structure. We are now almost certain that the bull season has ended.
At this stage, our focus shifts to the trend-based Fibonacci level around 0.312, which defines the current downside objective. It is clearly observable that the bear market phase has been relatively short-lived.
For this reason, I expect Bitcoin to reach the $52K region in 2026, with a tolerance band of ±20%, followed by an accumulation/distribution phase. This process should also mark the early structural steps of the next bull cycle beginning to form.

Gold - The Psychological $5000 Within Sight!Looking at the price action of Gold in early 2026, it could be said that traders didn’t need much reason to resume buying at higher levels, they were primed and ready to go! However, the nature of how key events initially played out to start this week seems to have emboldened them to push prices to even higher levels than may have been anticipated at that time.
It must be remembered that Gold is one of the most popular safe haven assets to own at a time of crisis and the focus for traders across the first 3 trading days of this week, has been on President Trump’s combative stance toward Europe in his pursuit of making Greenland part of the United States, as well as Japanese PM Sanae Takaichi’s decision to call a snap election for February 8th, to bolster her mandate for greater spending and tax cuts, which increased investor angst over the fiscal situation for not only Japan but many other major economies.
Looking at the chart for this week, the uncertainty created by these events led Gold to hit numerous records. After opening on Monday at 4627, prices went straight up, eventually registering its most recent all time high at 4888 on Wednesday morning, which interestingly brought the psychological $5000 barrier into sight for the first time. Now, prices did dip late yesterday to 4758 as President Trump, while at Davos, stepped back from imposing tariffs on European allies, saying that he had a framework in place for a future deal regarding Greenland. However, Gold has since recovered to trade 4830 at the time of writing (0700 GMT).
Looking forward to the next 48 hours and early next week, where Gold moves next could be determined by the release of specific details of how this Greenland framework is to be structured and updates on whether Denmark and its European allies agree to its terms. There is also a US PCE Index release, the Fed’s preferred inflation gauge, to consider today at 1500 GMT, which could add to any future volatility for Gold depending on if it adds extra colour to the Federal Reserve’s interest rate outlook, given their next meeting is less than 7 days away on Wednesday January 28th.
Gold Technical Update: Focus is on 5000, but 4893 May Also Be Important
Gold’s acceleration through January has extended further this week, putting the psychological 5000 level on traders’ radar. Round numbers, especially when aligned with new all‑time highs or lows, often become key focal points, with closing breaks frequently acting as catalysts for additional price movement. However, for Gold, as the chart below highlights, there is perhaps a closer resistance level that may also warrant attention in upcoming sessions.
This resistance sits at 4893, which is equal to the 100% Fibonacci extension. This level successfully capped Wednesday’s price advance and triggered a setback to the downside. If Gold is to mount a credible challenge toward the 5000 psychological barrier, a closing break above 4893 may be the first hurdle to overcome.
A successful closing break above 4893 could keep the upward momentum intact, opening the way for a test of the 5000 level. A closing break above 5000 may then raise the prospect of further price strength toward 5084, which is the 138.2% Fibonacci extension, possibly even higher.
Potential Support Levels:
The extension resistance at 4893 does currently remain intact, and the latest setback from this level reinforces its role as the first possible resistance focus. While this level continues to cap Gold prices on a closing basis, downside pressure in the shiny metal may re emerge, opening the door for a retest of Wednesday’s 4758 low.
A closing break below 4758 wouldn’t be an outright technical reversal for Gold, but it may leave the door ajar for further downside. If weakness extends, a deeper pullback toward 4657, which is the 38.2% retracement of this year’s range, could unfold, possibly even 4584, which is the deeper 50% mid-point support.
The material provided here has not been prepared accordance with legal requirements designed to promote the independence of investment research and as such is considered to be a marketing communication. Whilst it is not subject to any prohibition on dealing ahead of the dissemination of investment research, we will not seek to take any advantage before providing it to our clients.
Pepperstone doesn’t represent that the material provided here is accurate, current or complete, and therefore shouldn’t be relied upon as such. The information, whether from a third party or not, isn’t to be considered as a recommendation; or an offer to buy or sell; or the solicitation of an offer to buy or sell any security, financial product or instrument; or to participate in any particular trading strategy. It does not take into account readers’ financial situation or investment objectives. We advise any readers of this content to seek their own advice. Without the approval of Pepperstone, reproduction or redistribution of this information isn’t permitted.

Silver - Next StopSilver has moved sharply higher, and the explosive upward trend is still ongoing.
The move from March to August 2020 can be considered wave 1 and the start of this bullish phase.
The question now is: where will we stop and potentially reverse? In other words, where might the next corrective phase begin.
Fibonacci levels drawn from the first wave and from the last significant corrective wave point to several key areas:
77 - the nearest level, which we have already passed without stopping
89 - the next most probable target
96 - applicable only to the current wave
Time will tell where the next stop occurs.
---
Please subscribe and leave a comment.
You’ll get new information faster than anyone else.
---

Gold XAUUSD /Analysis⏱️ Timeframe: 30 Min
🔹 Market has taken liquidity, after retest it may go to the 4800 order block.
🔹 Entry: Around 4788-7885
🔹 Stop Loss: 4787
🔹 Targets: 4810 | 4820 | 4830
🔹 Trade Type: Swing Trade
💡 Safe trading, discipline first

DOGEUSD TP 0.1397On the 4-hour chart, DOGEUSD has formed a bullish bat pattern, suggesting an potential upward move. The first upside target is around 0.1322, and the second target is around 0.1397. (Based on the 0.382 and 0.618 Fibonacci retracement levels.)

NQ Power Range Report with FIB Ext - 1/22/2026 SessionCME_MINI:NQH2026
- PR High: 25569.25
- PR Low: 25523.25
- NZ Spread: 103.0
Key scheduled economic events:
08:30 | Initial Jobless Claims
- GDP
10:00 | Core PCE Price Index (MoM|YoY)
12:00 | Crude Oil Inventories
Weekend gap filled, immediate response
Session Open Stats (As of 12:45 AM)
- Session Open ATR: 364.30
- Volume: 26K
- Open Int: 258K
- Trend Grade: Long
- From BA ATH: -3.3% (Rounded)
Key Levels (Rounded - Think of these as ranges)
- Long: 26521
- Mid: 25264
- Short: 24008
Keep in mind this is not speculation or a prediction. Only a report of the Power Range with Fib extensions for target hunting. Do your DD! You determine your risk tolerance. You are fully capable of making your own decisions.
BA: Back Adjusted
BuZ/BeZ: Bull Zone / Bear Zone
NZ: Neutral Zone

Sandisk - Final PushLooking at the chart, we see that we are drawing the 5th and final wave of the uptrend.
Remaining movement: 3-18 %.
Key targets:
395
454
After reaching these targets, we expect a correction
---
Please subscribe and leave a comment!
You’ll get new information faster than anyone else.
---

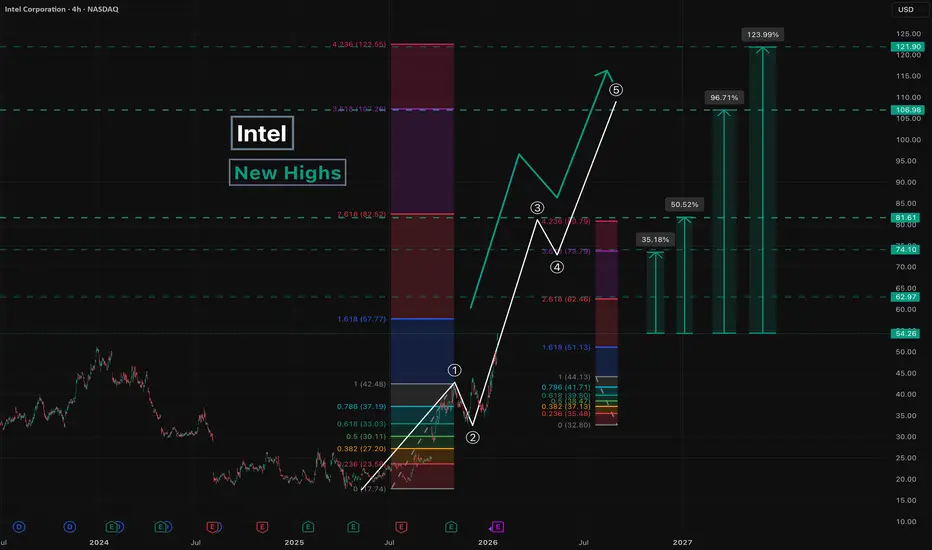
Intel - New Highs
Following up on the previous idea, where the projected targets have been completed.
Let’s revisit the chart.
Since price continued higher without entering a correction, this suggests that wave 3 of the larger move has begun.
Key levels:
62 - local correction within wave 3
74/81 - potential completion zone for wave 3 , followed by a correction
106/121 - potential completion zone for the entire move
Estimated upside potential from current levels:
35-50% for wave 3
96-124% for the entire move
---
Please subscribe and leave a comment!
You’ll get new information faster than anyone else.
---
1.21.2026 Initial Daily Buy Setup Analysis - Re-Intro to Marketsjust a tester for today, up to 4 hour chart, based off initial buy setup and projected

3 Wave uptrend?Was taking a look at FO TSX, looks like a 3 wave uptrend is taking place. I drew a fib grap from Dec 2024, then used the price drift to align the 0.236 level, and used additional data and aligned the 0.382 fib line. I then Identified pull backs, and drew a wavey line to 0.465 price. We will see what happens Cheers

ETH 4H Chart1️⃣ Market Structure (HTF – 4H)
We had a clear uptrend in the channel (black lines).
A breakout from the channel occurred at the bottom → this is a break of structure.
The decline was impulsive, without any major corrections → supply prevailed.
➡️ Medium-term bias: bearish/corrective
2️⃣ Key price levels
🔴 Supports
$2,938 – currently the closest technical support
$2,862 – a very important zone (strong reaction, long wick)
$2,740 – next HTF support (if the market collapses)
➡️ 2,862 = key decision level
Loss → high chance of a breakout to 2,740
🟢 Resistances
$3,081 – local resistance/flip after a breakout
$3,215 – former support, now resistance (ideal for shorts)
$3,430 – upper HTF resistance (only after a structure change)
3️⃣ Price Action (what we're seeing now)
After a strong dump, an impulsive downward wick appeared → Possible short-term relief (dead cat bounce).
The current bounce looks corrective, not impulsive.
Not yet:
higher low
4-hour candlestick closes above 3,081
➡️ This could still be just a pullback for further declines.
4️⃣ RSI Stochastic
RSI was heavily oversold → a technical bounce is normal.
Now a quick return to the upper regions → watch out for a bearish cross.
In downtrends, the Stoch RSI often:
Quickly reaches 80–100
and immediately reverses
➡️ RSI does not yet confirm a trend change
5️⃣ Scenarios
🟡 Scenario A – correction and further decline (more likely)
Bounce to 3,080–3,215
Rejection
Return to 2,860 → 2,740
📉 Short setup:
Reaction below 3,080 / 3,215
Weak volume, pin bar / bearish engulfing
🟢 Scenario B – return to growth (less likely)
Conditions:
4-hour close above 3,215
Hold as support
Only then target: 3,430
📈 Without this → longs are counter-trend

USDJPY Wave Analysis – 21 January 2026 - USDJPY reversed from support area
- Likely to rise to resistance level 5.50
USDJPY currency pair recently reversed up from the support area between the support level 157.75 (former strong resistance from November and October) and the 38.2% Fibonacci correction of the upward impulse from December.
The upward reversal from this support area continues the active multi-impulse upward sequence 3 from September.
Given the ы, Uniswap cryptocurrency can be expected to rise to the next resistance level 5.50 (former support from the start of January).

nq1!my bias from today till next week tuesday is bullish because the markets need to fill inconsistencies to the upside and with trump easing remarks of taking greenland 100% by Tuesday nasdaq will at the least be at 25815

Piusdt long?This count is based on my assumptions so anything can happen not a trading or financial advice just for educational purposes only kindly do your own ta thanks trade with care good luck.

MU - Continuing UptrendReturning to Micron Technology.
From the previous idea: the minimum corrective target was reached, and the upward move continues.
The current move is viewed as a large wave 5 .
Most probable targets:
- 321
- 365

Axie Infinity AXS price analysisAfter spending more than three years in a sustained downtrend, CRYPTOCAP:AXS price action over the last month resulted in an approximately x3 increase, supported by improving volume dynamics.
Key observations:
Clear break from long-term bearish structure
Strong short-term momentum on OKX:AXSUSDT
Renewed speculative interest in the #GameFi sector
As long as current conditions persist, the $4 level stands out as the first meaningful upside target from a technical perspective.
Failure to sustain volume and momentum would likely turn this move into a temporary relief rally.
🤔 Do you see this as a structural trend change for CRYPTOCAP:AXS and #GameFi sector, or just a reactionary move within a broader bearish context?
______________
◆ Follow us ❤️ for daily crypto insights & updates!
🚀 Don’t miss out on important market moves
🧠 DYOR | This is not financial advice, just thinking out loud

Gold XAUUSD/Analysis⏱️ Timeframe: 30 Min
🔹 Market has taken liquidity, after retest it may go to the 4770 order block.
🔹 Entry: Around 4770
🔹 Stop Loss: 4750
🔹 Targets: 4800 | 4830 | 4850
🔹 Trade Type: Swing Trade
💡 Safe trading, discipline first

Us30usd short?This count is based on my assumptions so anything can happen not a trading or financial advice just for educational purposes only kindly do your own ta thanks trade with care good luck.

2026-01-21short zone , because of that fast push up with no structure
it could be a fake move to the upside grab more liquidity and push down even more
- could just continue going up as well we in Ath area , will wait the reaction , there is a lot of manipulation right now

XRP at a Critical Daily Decision Zone | Big Move ComingXRP – Daily Technical Outlook
Supports
Ascending trendline: 1.75 – 1.80
Fib 0.382 support: 1.62
Major invalidation: 1.20
Resistances
Fib 0.50 / Daily equilibrium: 1.96
Fib 0.618: 2.30
Fib 0.786: 2.78
Major supply: 3.06 – 3.40
RSI (Daily): 43 (bearish momentum weakening, base forming)
Daily Expectation
Holding 1.75–1.80 → expect push toward 1.96 → 2.30
Daily close above 2.30 → continuation toward 2.78
Loss of 1.75 → pullback to 1.62
Daily close below 1.62 → deeper correction toward 1.20
Bias: Neutral → bullish above 1.75
Invalidation: Daily close below 1.62

2026-01-21tension is still high with US and Greenland
late update since the speech of Trump at the World Economic Forum
wait for structure always on the 5 min
