CLF: in mid-term resistancePrice has followed the trend structure suggested in the previous August and September updates and has now reached a key mid-term resistance target, where selling pressure could emerge and push price into a larger-degree higher low formation within the 10–8 macro support zone, initiating a new base-building process.
If price manages to sustain a breakout above the 15 level, it would open the door for a more prolonged upside and shift the structure into a more immediately bullish interpretation from the 2025 lows.
Chart:
Previously:
• On upside momentum continuation (Sep 3):
Chart:
www.tradingview.com
• On bullish trend structure and support zone (Aug 11):
Chart:
www.tradingview.com
Fibonacci

XRP Wave (2) CompleteCRYPTOCAP:XRP wave (2) appears complete after last Fridays flash crash at the 0.382 Fibonacci retracement and weekly pivot point.
RSI is crossed bearish and has room to fall into oversold with no bullish divergence. Bearish divergence marked the short-term top.
Price is expected to dip into the wick before moving up in wave 3 into price discovery with an initial target of $5.7
It should still be noted that XRPs move up was from a multiyear triangle which is a terminal pattern. Prices are expected to hit the bottom of the triangle at $0.3 but take this with a pinch of salt.
Safe trading

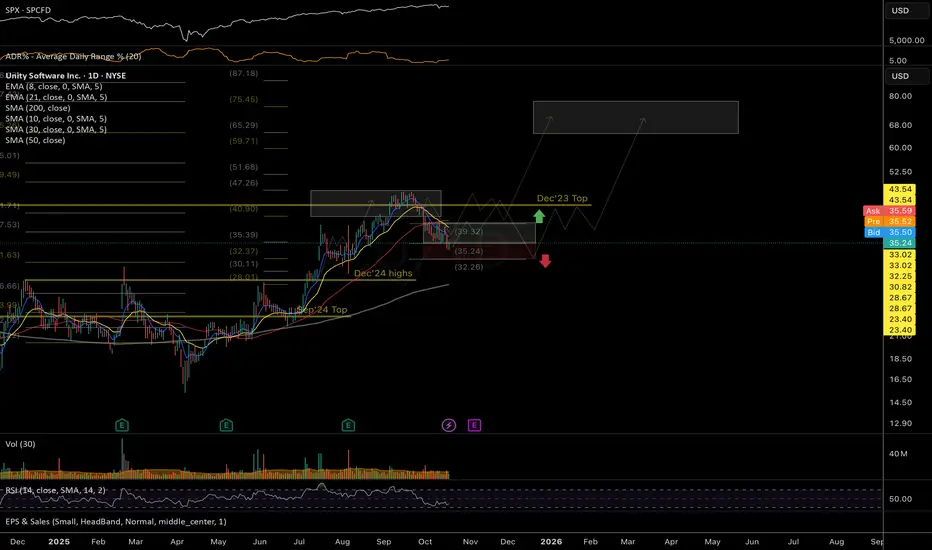
U: trend structure, key support and resistance levelsPrice has reached a key mid-term support, where the macro-upside structure may begin forming at least a bottom for the first corrective wave.
From a broader perspective, as long as price continues to close above 32, the macro trend structure remains constructive — with potential for an upside move into the 65–75 macro resistance zone, completing the larger uptrend that started from the 2024 bottom.
Chart:
Previously:
• On breakout potential and follow-through (Jul 14 and 17):
Chart (Jul 17):
www.tradingview.com
Chart (Jul 14):
www.tradingview.com
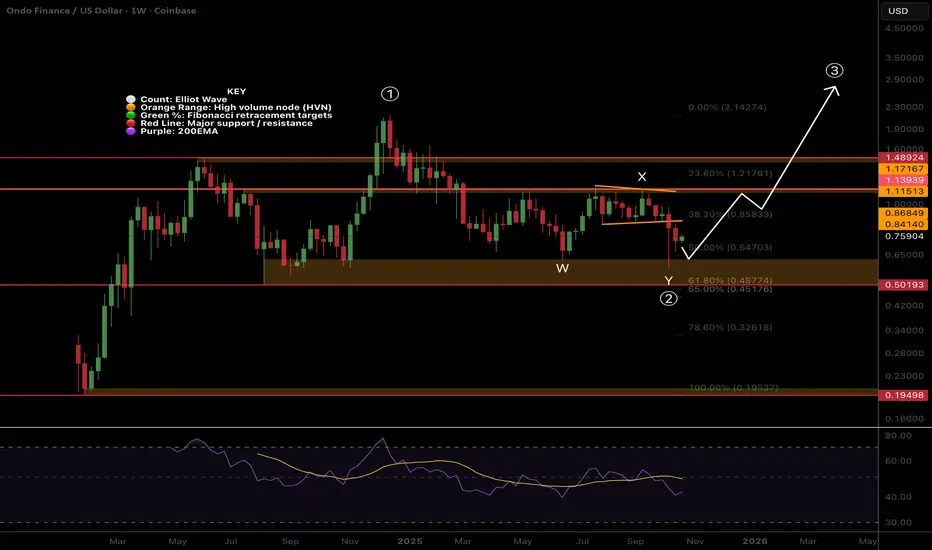
$ONDO wave (2) Bottomed?LSE:ONDO appears to have completed wave 2 with WXY complex correction ending at the major High Volume Node support just above the golden pocket.
Weekly RSi has printed bullish divergence but is not yet confirmed. A dip into the wick and High Volume Node is to be expected before high but may not get there.
Wave (3) has an initial target of the R2 weekly pivot at $3.18, a strong move from here. $1.22 weekly pivot and High Volume Node will put up a fight.
Safe trading
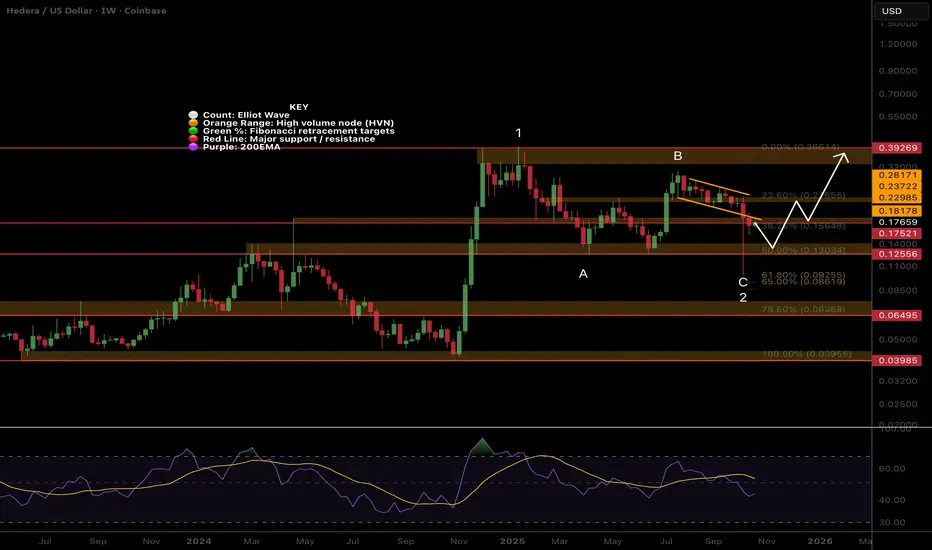
HBAR Wave 2 complete, but more downside firstCRYPTOCAP:HBAR wave 2 looks complete at the golden pocket and High Volume Node support after printing an ABC down. A deeper visit into the wick left behind is likely before we continue up in wave 3. Testing the 0.5 Fib and High Volume Node is where I am looking for a long.
Weekly RSI has bullish divergence, a good sign, but plenty of room to fall until oversold. Price is currently at major resistance of the channel lower boundary and High Volume Node.
A strong upside move has a target of the all time High Volume Node. Targets of $1+ are still on the cards.
Safe trading
SLDP: odds for mid-term top are rising Price has followed the trend structure outlined in the September and October updates, reaching the first level of the key resistance zone.
While risks of a mid-term top formation are rising, as long as price holds above the 21 EMA, a final push higher toward the 10 resistance area remains possible.
Chart:
Previously:
• On resistance and top formation (Oct 6):
from the weekly review:
• On bullish potential and support (Sep 19):
www.tradingview.com

FET Macro flipped long term bearish! Done and dusted?NYSE:FET has disappointed many and continues to be dumped hard. We can see 3 waves up from the very bottom as an ABC followed by a 5 wave structure down that's nearly complete, as weekly RSI hits oversold. No bullish divergence.
The wave 5 structure down resembles a motif wave which means any bullish moves are now corrective and we won't likely see all time highs again but we can still make decent profit.
Once a bottom is found, price should return to $0.6, at least, as counter trend rally / reversion to mean where it may find heavy selling.
Price needs to break $0.84 and find a higher low to flip the structure bullish again, a tough challenge.
Downside 'alt-coin golden pocket' Fibonacci, 0.786 has not been reached yet and is the highest probability area for alts to bottom, $0.13.
Safe trading

$ETH Macro unchangedNothing has changed for me on the CRYPTOCAP:ETH macro. The pullback was shallow for a wave 2 not even hitting the weekly pivot or 0.382 Fibonacci retracement. We expect wave 2 to be a sharper drop to at least the 0.382.
This has me skeptical about higher straight away without further downside.
If the bottom is in then wave 3 should kick in and be a powerful move into price discovery with initial target of the R5 weekly pivot $8500
Further downside should be expected as we are below major High Volume Node resistance, weekly RSI is bearish with rom to fall. The first target is the weekly pivot at $3200, followed by the rising weekly 200EMA, High Volume Node support and 0.5 Fibonacci retracement at $2600
Safe trading

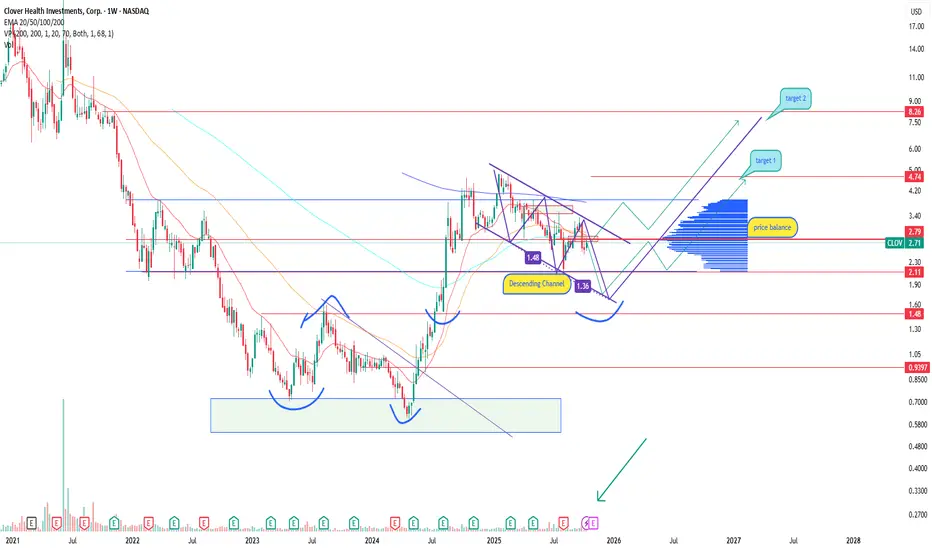
Topic: Clover Health growth emerging after a long declineClover Health (CLOV) stock is trading within a descending channel, approaching the lower boundary around 1.36–1.48, which previously acted as a demand zone. Rising volume suggests renewed buyer interest, and the flattening EMA 50/200 lines point to a potential trend reversal. A breakout above 2.80 could unlock targets at 4.74 and 8.26 — key supply levels.
Clover Health is a health-tech company providing AI-driven healthcare insurance and analytics solutions. After a restructuring phase and a reduction in losses, the company shows signs of stabilization. Improved financials and the growing focus on healthcare innovation could serve as catalysts for a new growth phase.
As long as the price holds above 2.10, the recovery scenario remains valid. A breakout from the descending channel may confirm the start of a mid-term bullish trend. Still, given the sector’s volatility, risk management is crucial.
Bitcoin the BOTTOMBitcoin has bottomed (IMO) at $106K, the 2024 top and 61.8% Fibonacci level, and is now rising for the final leg up.

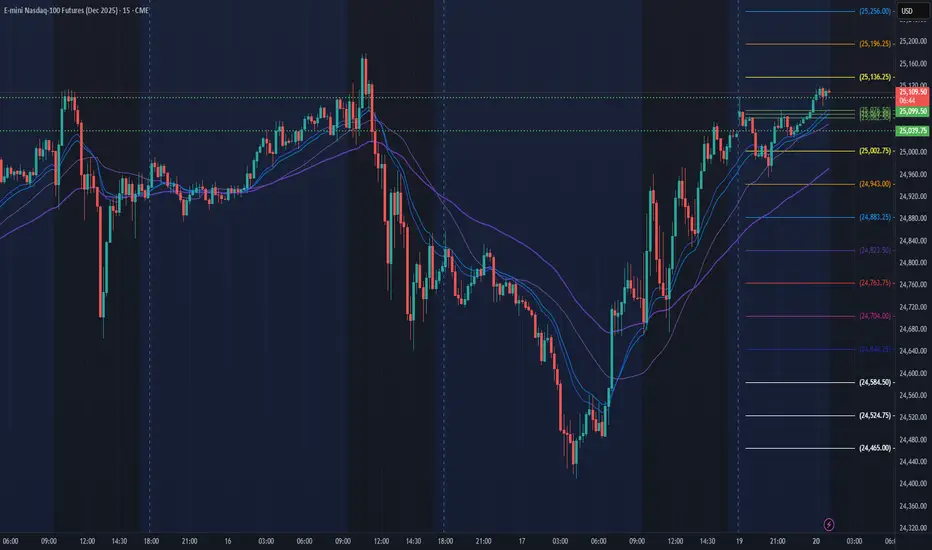
NQ Power Range Report with FIB Ext - 10/20/2025 SessionCME_MINI:NQZ2025
- PR High: 25099.25
- PR Low: 25039.75
- NZ Spread: 133.0
No key scheduled economic events
Session Open Stats (As of 12:45 AM)
- Session Open ATR: 391.21
- Volume: 43K
- Open Int: 283K
- Trend Grade: Long
- From BA ATH: -1.1% (Rounded)
Key Levels (Rounded - Think of these as ranges)
- Long: 26020
- Mid: 23571
- Short: 21939
Keep in mind this is not speculation or a prediction. Only a report of the Power Range with Fib extensions for target hunting. Do your DD! You determine your risk tolerance. You are fully capable of making your own decisions.
BA: Back Adjusted
BuZ/BeZ: Bull Zone / Bear Zone
NZ: Neutral Zone
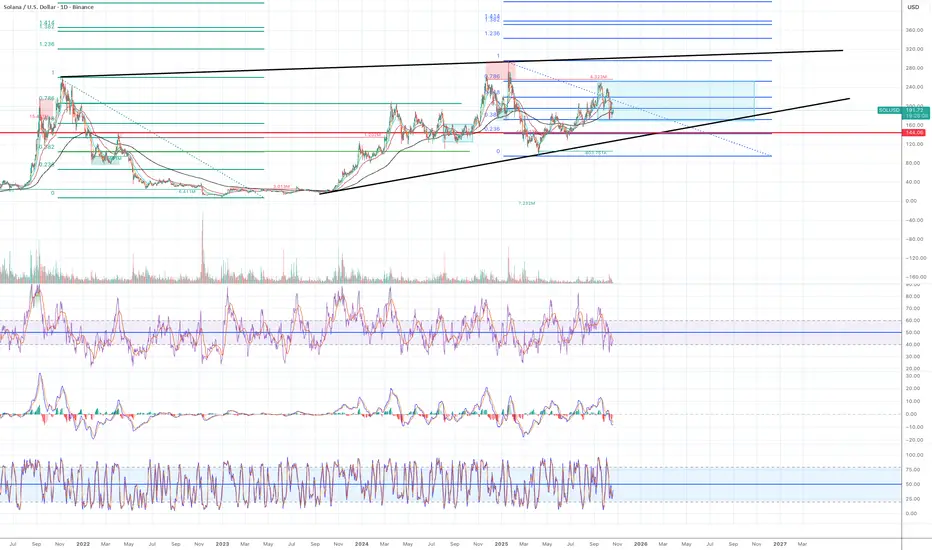
Getting bullishMy macro bias for Solana is bullish. I invest in Solana and I mainly hodle the asset. The price action of Solana in the last 18 months has been very difficult, therefore, I have been avoiding to trade it. However, I am becoming cautiously optimistic as a Solana bull and I can see some clear signs of price recovery.
Look at a green major Fib retracement from the previous cycle ATH at $262 to the bear bottom at $8.25.
1) the price moved rapidly to $208 at Fib 0.786 in March 24. It spent about a month consolidating around that level but it eventually failed to break above and spent 8 months consolidating between Fib 0.382 and 0.786 range.
2) The price eventually broke above 0.786 and 0.1 and reached historical ATH at $293 in Jan 2025 and started a sharp decline to $95, which is roughly Fib 0.382 area.
Look at blue major Fib retracement from historical ATH to the recent bottom ($293 to $95).
1). The price moved to $250 at Fib 0.786 in mid Sept 2025. It spent several days consolidating around that level but it eventually failed to break to the Fib 0.382 zone at $172.
Based on the two major Fib retracements, I am watching to see if the price will hold above Fib 0.382 level. It is normal for the price to consolidate between Fib 0.618 and 0.382 but I often see Fib 0.786 and 0.236 to work as the last line of defense. Once the price goes above or below Fib 0786 and 0.236, the trend can start to break down. So as long as the price stays above Fib 0.236, but ideally above 0.382, my bias is bullish.
$144 (red horizontal line in the chart) is the level Solana had the last bull trap and started the macro bear cycle. This level should work as a strong support level.
I keep adding more to my position when the price dips to Fib 0.382 area at the moment but it is for investment.
For swing trading, I am waiting for the following conditions:
1) Daily candle closes above previous swing higher low at $191.80/
2) EMA 12 > EMA 21 > EMA 55
3) A daily candle is above EMA 200.
4) RSI lines cross to the upside and ideally enter the bull zone.
5) Stochastic are moving to the upside but not overbought.
6) MACD can stay in the bear zone but is starting to tilt to the upside.
My BTCUSD Trading Plan (20 October 2025)The chart illustrates a Fibonacci retracement analysis applied to the Bitcoin (BTC/USD) daily timeframe to identify a potential continuation setup within a broader downtrend.
The Fibonacci tool is drawn from the recent swing high at 126,054.16 to the swing low at 103,667.69, capturing the latest impulsive bearish movement. This defines the primary structure of the current downward wave.
According to the Fibonacci retracement model, the 0.618 level (117,502.51) represents the optimal retracement zone for a potential short re-entry, aligning with a previous area of resistance and market imbalance. This level serves as the entry point, supported by structural confluence from historical price reactions.
The Stop Loss (SL) is placed at the 1.000 Fibonacci level, which marks the invalidation point of the bearish structure. If price exceeds this level, it indicates that the corrective phase has transformed into a new bullish impulsive move.
Two Take Profit (TP) projections are identified:
TP1 – the 0.000 retracement level, representing a full correction of the latest retracement move; and
TP2 – the 2.618 Fibonacci extension, representing a potential continuation target following the Golden Ratio expansion principle.
The blue arrows on the chart illustrate two possible market scenarios:
a retracement to the 0.618 level followed by a continuation downward toward the support zone around 88,000–91,000; or
a temporary pullback failure, where price invalidates the bearish structure and resumes an upward move.
Overall, this chart demonstrates a rule-based Fibonacci trading framework, where entries, exits, and invalidations are defined objectively using price structure rather than subjective visual interpretation. The approach follows the principle that financial markets move in impulsive and corrective waves, and that the 61.8% retracement level often serves as the most probable zone for trend continuation according to the Golden Ratio theory.

FET - Bear Market Bottom Repeat Pattern - Very bullish on FET!!To me, FET is repeating a bear market bottoming pattern now.
We are on the 4D chart.
As you can see from the previous market cycles, FET shoots up sharply from its market cycle bottom. It then does a .50 fib retracement of the move off of the market cycle bottom, and establishes a strong level of support. These areas can be seen in the light blue boxes: Sep 2020-into Q1 of 2021, and then in May of 2023 - October of 2023.
When you look at what FET does in each of its market cycles; It bottoms right in that first area of support that we just discussed.
When you take a look at what FET just did, it actually fell into that area of support that we established off of the 2022 market cycle bottom. That is, the level of support that we formed from May - Oct of 2023.
We also have a repeat pattern on the 4D RSI. The 4D RSI will have 3 heavily overbought waves during its bull market, and then 3 heavily oversold waves during its bear market. We just completed a 3rd oversold data point on the 4D RSI for FET. This occurrence and the last occurrence both formed an inverse head and shoulders pattern on the 4D RSI.
We're actually in an extended period of bearishness for this FET bear market, too. We took a bit longer since we did a premature 200-ish percent bounce off of the bottom in April.
With the Bitcoin dominance chart not having completed a market cycle of its own - I do think that altcoins will still have a nice run within a lengthened cycle for the first time ever.
There are more repeat patterns, but I just don't have the time to discuss them right now.
Thank you!

Envision (VIS) on BASEEnvision (VIS) on BASE – Multi-Target Accumulation Setup
This analysis focuses on the long-term accumulation structure forming on VIS/BASE following a prolonged downtrend and multi-month consolidation near historical lows. Price has compressed within a narrow range (~$0.0060–$0.0070), showing exhaustion in selling volume and the first signs of structural support holding above the previous capitulation wick.
Technical Outlook
Accumulation Zone: $0.0058–$0.0070
This zone aligns with the lowest historical range and coincides with visible demand clusters on weekly structure. A clean reclaim and close above $0.008 would confirm a short-term reversal.
Breakout Confirmation:
A break and weekly close above $0.008139 (≈125%) signals initial strength and potential rotation toward mid-range resistance.
Target Levels
Target 1: $0.008139 (short-term breakout target, +125%)
Reclaiming this level confirms strength and may attract early momentum traders.
Target 2: $0.023874 (mid-range retracement, +368%)
This area represents the 0.382–0.5 retracement zone of the prior impulse move and prior consolidation shelf.
Target 3: $0.029982 (major fib confluence and liquidity pocket, +463%)
This aligns with the 0.65–0.786 Fibonacci retracement range and a historically heavy supply area (60K–98K BKR levels).
Volume & Liquidity Context
Volume shows compression near the base, and historical BKR (breaker block) metrics indicate previous sell-side inefficiency around $0.023–$0.030. These zones are likely to attract liquidity hunts and partial profit opportunities during a recovery leg.
Not Ever Financial Advice.

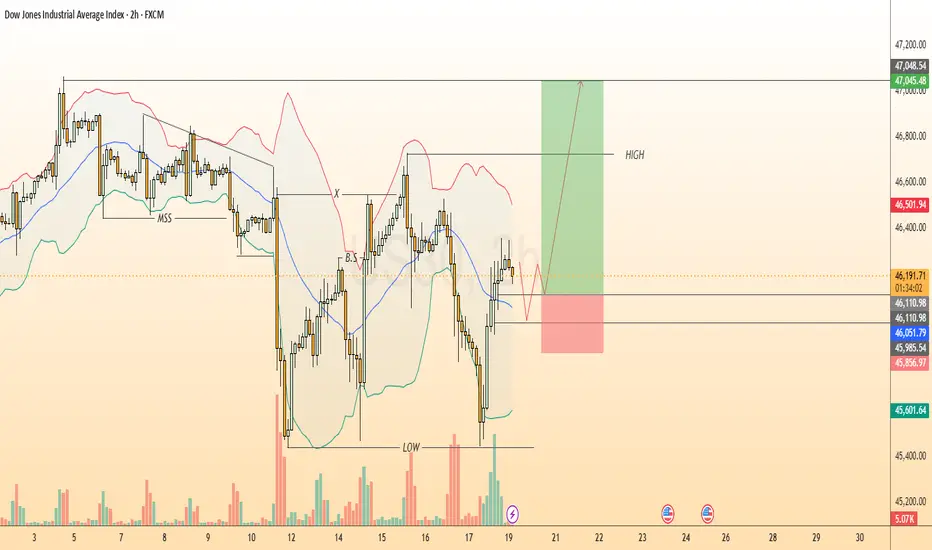
US30 UpdateNext move on the way, focus on proper risk management & stay disciplined. Wishing you successful trades..!
Key Reason:
1. BSL hunting still in pending.
2. Hidden OB formation.
3. When price tap this area and rejected this area along with strong volume. Then we'll see a upside move.
This is not a financial advise. Confirmation is most important. Let's see how it will work.
XRP Short to $2.25 - $2.05Currently shorting 50,000 XRP targeting $2.25, then $2.05 based on rejection of a key level and validation of golden fibs on higher and lower time frame pivots.
Note: I NEVER trade XRP I hold. I just trade short term volatility via derivatives and w/ leverage to increase my XRP position.

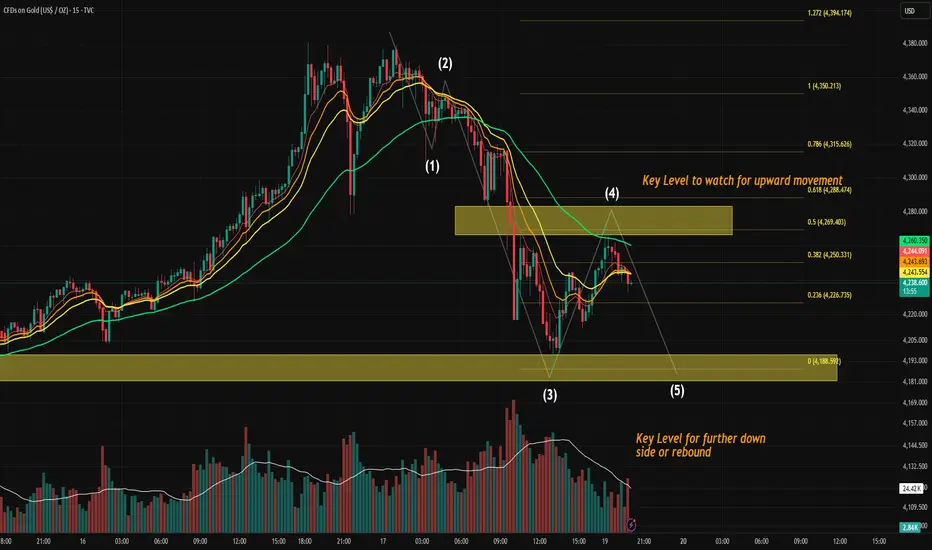
Elliott Wave Analysis: Gold Near Potential Wave 5 Reversal PointGold Price Action Analysis - Potential Wave 5 Setup (sub waves within Wave A going down)
Wave Structure Overview
The current structure on the 15-minute chart appears to be unfolding in a classic 5-wave impulsive sequence:
Wave (1) — Initial sell-off following local top formation.
Wave (2) — Sharp retracement, testing previous supply, rejected at previous premarket range high (Friday US Stocks premarket high)
Wave (3) — Strong impulsive move down with expanding volume, typical of a wave 3 extension.
It respected one of our previous opening range high (lower yellow level).
Wave (4) — Counter-trend rally into a prior supply block / zone, showing hesitation and rejection. (we are likely done, since it had retraced to 0.5 Fib of Wave 3), i am not ruling out where we may have one more small wave up before we get into the real wave (5).
Wave (5) — Still developing, assuming wave (4) is done, we are likely to push into the lower yellow demand zone, where either continuation or a significant rebound may occur.
One scenario that can happen is that we double bottom where wave 5 meet end of wave 3, and we start a corrective wave up which is a potential Wave B going up.
🟧 Key Levels to Watch
Upper Zone (around 4271–4290)
This zone aligns with the ORH level and prior Wave (4) rejection area.
➝ If broken with strong momentum, it can invalidate the immediate bearish Wave 5 scenario and hint at a deeper retracement or new bullish structure.
Lower Zone (around 4198–4181)
This is a strong demand zone, confluence with Wave (3) extension targets and potential end of Wave (5).
➝ Price reaction here is crucial: either we see a clean 5-wave completion and rebound, or further downside acceleration.
📊 Momentum Confirmation (MACD)
The MACD shows a decelerating bearish momentum going into Wave (5), which fits the classic pattern where Wave 3 has the strongest momentum and Wave 5 often shows divergence or a weaker push.
If MACD prints a higher low while price makes a lower low, that would confirm bullish divergence, a common reversal signal after an impulse.
📝 Trading Implications
Scenario A — Bounce at Demand Zone:
Look for reversal signals or bullish divergence near 4180–4198 to confirm the end of Wave (5). Potential short-covering rally could take us close to 4300
Scenario B — Breakdown Below Demand Zone:
A clean break and close below 4180 may open the door to extended bearish continuation — likely a larger degree correction or Wave C structure.
Invalidation:
A move and acceptance above the upper ORH zone would invalidate this short-term bearish count.
Final Thoughts
This setup is technically clean:
Clear Elliott structure
Key liquidity zones mapped
Momentum oscillator in sync with price action
⚠️ But remember, Wave 5s can truncate or extend, so flexibility is key. Watch how price behaves at the lower yellow zone — that’s where the next big move could be born.
Dxy long?This count is based on my assumptions so anything can happen not a trading or financial advice just for educational purposes only kindly do your own ta thanks trade with care good luck.

Gold w3 top? Elliott Wave Analysis yearlyThis count is based on my assumptions so anything can happen not a trading or financial advice just for educational purposes only kindly do your own ta thanks trade with care good luck.

BTC/USD 4H chart reviewBitcoin is currently trading around $109,000, a rebound after falling. An attempt to break the short-term downtrend is visible (yellow SMA line 1).
The previous lows were around USD 104,500 - 105,000, and the current candle is trying to break the local resistance around USD 109,000 - 110,000.
⸻
📊 2. Moving Averages (SMA / EMA)
You have several averages on the chart:
• The yellow line (SMA #1) – the short-term average, currently slightly sloping downwards, but the price is just breaking it from below – is the first sign of a change in momentum.
• Red line (EMA Cross 50/200) – it looks like the 50 EMA is below the 200 EMA, confirming the downtrend in the broader picture.
• Blue and green zones (EMA/SMA of higher intervals) – show strong resistance zones:
• $112,592
• $115,674
→ These are targets for a potential upside rally if the 109k breakout holds.
⸻
💹 3. MACD
• The MACD line crossed the signal line from below → it is a buy signal (bullish crossover).
• The histogram increases above zero, which confirms the upward momentum.
➡️ MACD confirms that the upward correction continues, but we do not have a full upward trend yet.
⸻
📈 4. RSI
• RSI is around 55-60, i.e. neutral and upward.
• It was previously in the oversold zone (around 30), so the current rebound is a healthy reaction.
➡️ No overbought yet, so there is room for further upward movement.
⸻
🧱 5. Key technical levels.
Level
Support 1
$106,550
local support after rebound
Support 2
$104,550
strong bottom from the previous move
Support 3
$101,700
the last bastion of buyers
Resistance 1
$109,000-$110,000
currently tested level
Resistance 2
$112,600
another growth target
Resistance 3
$115,700
EMA200 key barrier – trend change if it breaks

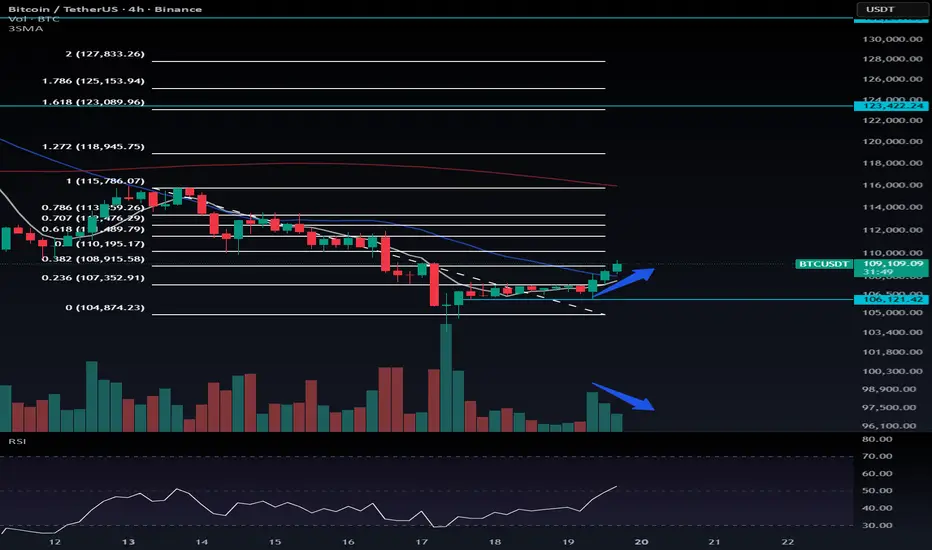
BTC Pullback Reaches Fibonacci 0.382Correction or Trend ReversalBitcoin has retraced up to the Fibonacci 0.382 level, suggesting that the recent move to the upside is likely a corrective bounce, not a new bullish trend.
Despite the price recovery, trading volume hasn’t increased, which supports the idea that this is just a temporary relief move within the broader downtrend.
If the price starts declining again but red candle volume remains weak, it could indicate that the bearish momentum is fading and the downtrend may be ending.
However, if red candles become larger than green ones and volume increases, that would confirm that selling pressure remains strong.
The current retracement could extend to the Fibonacci 0.5 level, around $110,195.
If the price breaks above this level and sustains it, I’ll consider the downtrend invalidated — meaning we may enter a new phase, either sideways or bullish.
For now, the short trigger remains at $106,121, though it’s still a bit far.
I’ll update the analysis if a new trigger appears.
As for long positions, I prefer to stay patient and wait for a clearer structure to form.
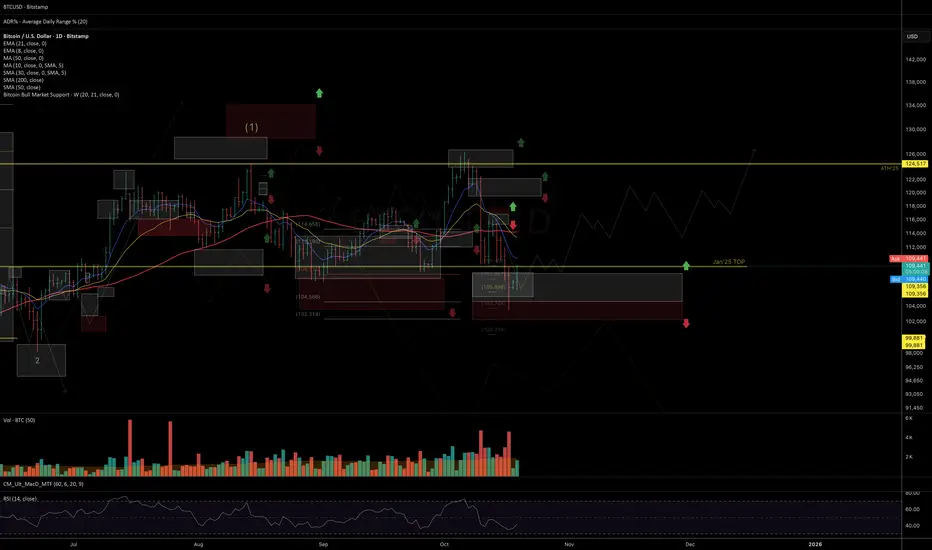
Weekly Review on #BTC and #ETHThe market continues to move within the framework of the main hypothesis — a potential completion of the correction from historical highs and the early signs of a possible trend reversal, as discussed in my recent market review:
As long as #BTC maintains weekly closes above 102K, the base scenario (both for #BTC and #ETH) remains unchanged — gradual recovery, consolidation, and a move toward new highs. I wouldn’t rule out the possibility that this could happen even before year-end.
However, a weekly close below 102K would signal an increased probability that the four-year macro growth cycle has ended and the market could be transitioning into a macro corrective phase across the crypto sphere.
Updated key levels and charts:
BITSTAMP:BTCUSD
Support: 106K | Resistance: 110–112K
Chart:
BITSTAMP:ETHUSD
Support: 3680 | Resistance: 4360
Chart:
Thank you for your attention, and I wish you a productive start to the week and successful trading decisions ahead!