SPX Short: We are at the PEAK! STOP above 7050!Over in this video analysis, I spent almost 20 minutes to talk about the wave structure, the Fibonacci relationships, the fractal relationships between different waves, how to short, and also warns about "What-if-I'm-wrong" scenario.
What I missed to mention in the video is that for now, we still do not have any extensions in our waves 5 (Cycle and Primary). NOT that there MUST be an extension, but it is something to keep it mind for the alternate count of a series of 1s and 2s, leading to a compounded wave 3.
Remember that the most important part of this video, which I mentioned at the end, is the ending diagonal invalidation price: 7049.65. A stop MUST be place above this price. For easier remembering, above 7050.
Good luck!
Fibonacci

BTC — Cypher Pattern, Fading Momentum & What Comes NextAfter the –36% drop from ATH, Bitcoin has found support in the 80K–90K range, where price has now been chopping sideways for almost 60 days. This kind of consolidation is pretty typical after a sharp selloff.
Back in June 2025, I already mentioned that a potential Cypher harmonic could be forming on BTC. At the time it was still early, but months later the structure is lining up very cleanly and looks like it’s playing out step by step.
The 86K–82K zone remains a key support area that bulls need to defend. Losing this zone would be a big deal technically and would likely open the door for further downside.
Macro Context
Cypher patterns are powerful because they combine:
impulse exhaustion
failed continuation
deep retracement psychology
They tend to appear near major cycle inflection points, especially after extended bullish phases and distribution-style highs. This makes them particularly relevant in the current market environment.
Let’s break the structure down step by step.
Cypher Structure Breakdown (X–A–B–C–D)
BTC has respected the key Fibonacci relationships of a Cypher extremely well.
X → A: Impulse Move
This was a strong, clean impulsive leg showing clear bullish dominance and participation.
Psychology:
Late bears trapped, early longs confident
A → B: Pullback
Price retraced to 0.579, sitting nicely within the Cypher sweet spot (0.382–0.618).
Structure held, which is crucial.
Psychology:
Doubt kicks in → “Is the move over?” → weak hands get shaken out.
B → C: Expansion & Euphoria
BTC pushed to the 1.274 extension of XA, clearly exceeding point A.
This is where optimism peaked and momentum chasing kicked in.
Psychology:
FOMO → breakout buying → late-cycle confidence
C → D: Reversal Zone
This is the most important part of the structure.
0.786 retracement of XC
Completion zone around 65.5K
Strong overlap with:
2021 ATH
2024 trading range
Psychology:
Euphoria → disbelief → forced selling → acceptance.
Where We Are Now
Bitcoin is currently trading between C and D, meaning:
we’re in a corrective phase
volatility has faded
and for the first time in four years, we’re seeing a clear bearish bias after a long period of bullish momentum
100K psychological level remains the major overhead barrier. As long as price stays below this level, bulls are on the defensive.
Macro Check
The broader technical picture remains cautious:
Below previous yearly open (93.5K)
Above yearly open (87.6K)
Below weekly 21 EMA/SMA (98K-102K)
Above monthly 21 EMA/SMA (87K–89K)
Structurally, this looks very similar to previous cycle transitions where momentum slowly faded before deeper moves followed.
Scenarios Going Forward
🔴 Primary Scenario
If the Cypher continues to play out:
downside pressure persists
volatility expands near liquidity pockets
target zone sits around:
66K–64K, centered near the 0.786 Fib (~65.5K)
This would be a healthy macro correction.
🟢 Invalidation Scenario
The bearish structure weakens if:
BTC reclaims and holds above prior value
price shows acceptance above 100K
momentum flips bullish again
In that case, the Cypher either gets delayed or invalidated.
Final Thoughts
Right now, the data favors patience and caution.
The most ideal path would be:
a push into the 97K–100K resistance zone
followed by continuation lower toward the 74.5K year low, which I’d like to see taken out
In choppy conditions like this, no trade is still a trade. Staying flat, preserving capital, and waiting for clarity is often the smartest move. Plan your levels, set alerts, and only act when the market gives you a high-probability setup.
_________________________________
💬 If you found this helpful, drop a like and comment!

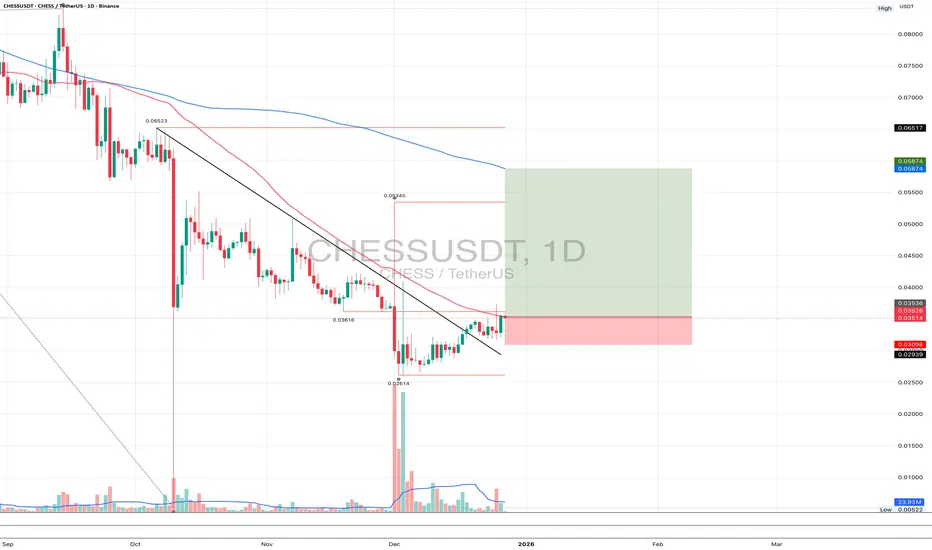
CHESSUSDT 1DShort technical update 👇
On the daily timeframe, CHESS broke its bearish structure and completed a clean retest of the breakout level. The retest held, selling pressure is fading, and higher local lows are forming. The current structure suggests a recovery phase after a prolonged decline. The base scenario is a continuation to the upside with a move toward the MA200 as the next key mid-term target.
CLong
Update: IREN Limited (IREN) - structure beats emotionsIREN Limited operates in Bitcoin mining and AI cloud infrastructure, focused on renewable energy and scalable data centers. Mining is the core revenue driver, AI services are still small but growing fast.
On the daily chart, a falling wedge has been broken to the upside, followed by a clean retest. The structure is holding. Price is now sitting in a strong daily support zone at 36–38, aligned with the 0.618 Fibonacci level.
MACD is turning bullish on higher timeframes, and short- to mid-term moving averages are stabilizing. This looks like accumulation after a deep correction, not a random bounce.
By the end of 2025, IREN scaled materially.
Revenue grew from $184M in 2024 to roughly $485M in 2025.
Bitcoin mining remains the main contributor, while AI Cloud Services added about $16M and continue expanding.
Consensus estimates point to ~$230M revenue in Q2 2026. EPS is still negative, which fits a capital-intensive expansion phase.
As long as price holds 36–38, the market is pricing a move toward 50 → 60 → 70.
This is not a one-day trade. It’s a structural recovery setup.
The chart already did the talking.

SPY - Inverse Head & ShouldersAfter many "If". I found this. Expecting a breakout soon. Probably towards 750 before march.

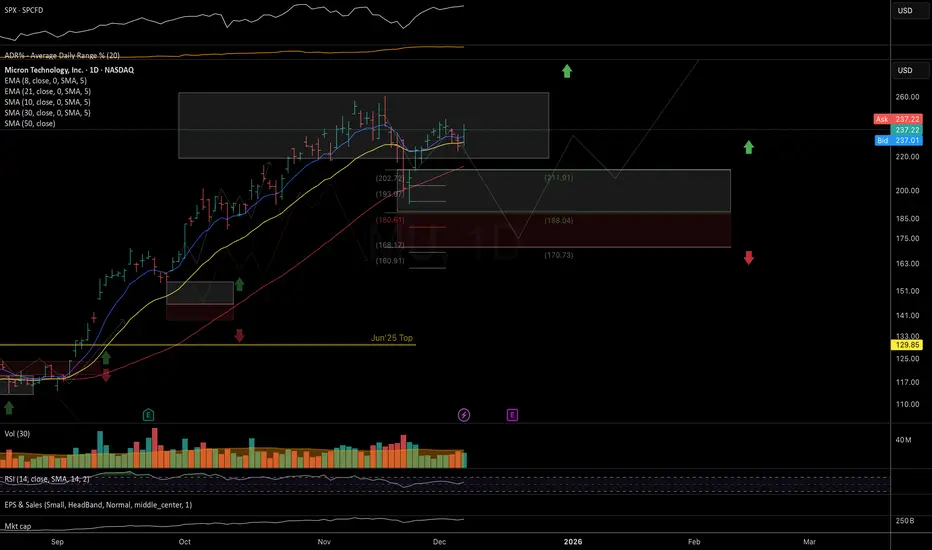
MU: one more leg down potential I would prefer to see one more leg down into the deeper mid-term support zone at 180–170, as long as price remains below the December highs.
Chart:
Previous analysis on NASDAQ:MU trend structure (Jul-Oct):
DXY Set to Snap Four-day Winning Streak- Support in ViewThe Dollar Index is poised to snap a four-day winning streak with DXY turning just ahead of confluent resistance today at 99.27/38- a region defined by the 100% extension of the late-December rally and the 61.8% retracement of the November decline. A 0.6% decline off the monthly high is testing confluent support into the start of the U.S. session at 98.68/76. The immediate focus is on this pivot zone into the start of the week where the 38.2% retracement converges on the August high-day close (HDC) and the May low.
Near-term bullish invalidation is rests with the lower parallel of this pitchfork which converges on the 50% retracement near 98.50. A break / daily close below this threshold would shift the focus back towards yearly open support at 98.24 with key support steady at the 1218 high / 61.8% retracement of the of the September advance at 97.71/81. A topside breach / close above this pivotal resistance is needed to mark uptrend resumption with subsequent resistance eyed at the December high at 99.57 and the 1.618% extension near 99.96.
Bottom line: The US Dollar Index is testing a support into the start of the week, and the focus is on possible inflection off this mark. From a trading standpoint, losses would need to be limited to the lower parallel / 98.50 IF price is heading higher on this stretch with a close above 99.38 needed to fuel the next leg of the advance.
-MB

ABAT: Bouncing off Major Support, Eyeing $8.85 Target.ABAT (American Battery Technology Company) is showing signs of a bullish reversal on the Daily timeframe. After a period of consolidation, price has successfully tested and held the key support zone around $4.00 - $4.50.
Key Drivers:
Support Confirmation: Price is bouncing off the 50-period Moving Average (Yellow line) and sits firmly on top of a high-volume node on the VRVP (Volume Profile), indicating strong buyer interest at this level.
Momentum Shift: The momentum oscillators (top and bottom panes) are curling upward, signaling a shift from bearish/neutral to bullish momentum.
Wave Projection: I am projecting an impulse move higher, labeled as Wave (A), targeting the 61.8% Fibonacci level ($8.85).

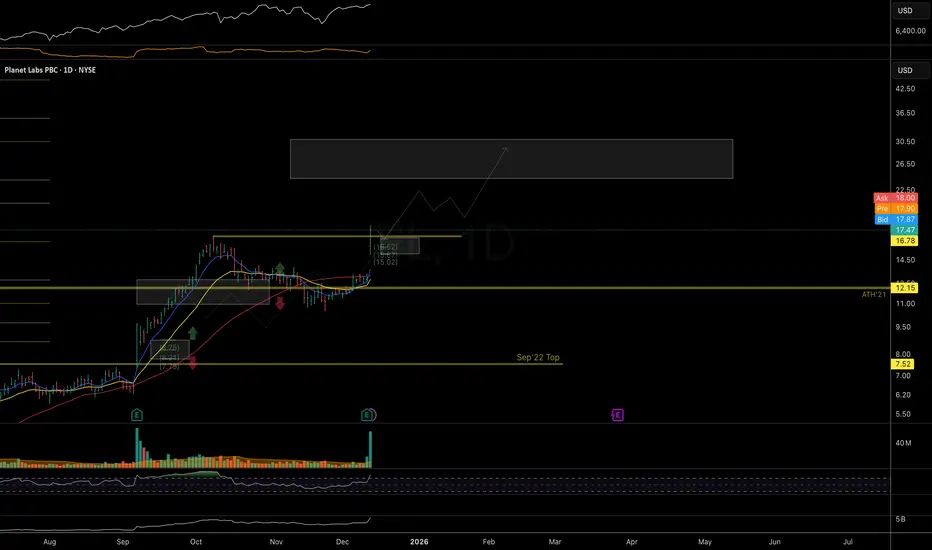
PL: room to follow-through Price continues to follow the macro bullish trend structure outlined in the September updates. Watching for further follow-through into the next 24–30 resistance zone.
The earnings gap may offer a delayed-reaction setup if we see a constructive, low-volume pullback in the coming days - ideally with price holding above the 15 local support.
Chart:
Macro view (Weekly):
Previously:
• On macro bullish-trend structure (Sep 14):
www.tradingview.com
• On resistance zone and pullback (Sep 26):
www.tradingview.com
SNDK: at macro resistance Price broke out through the resistance zone highlighted in the September update and continued to show strong upside momentum. However, the trend structure now appears substantially extended at current levels.
As long as the price remains below the 207–225 resistance zone, I expect selling pressure to start building, potentially leading to a pullback toward the 130–100 support area.
Chart:
Previously:
On resistance level (Sep 26):
Chart:
www.tradingview.com

Sell US30Price created a trading range on the 1hr. One the bearish movement, we created a FVG / area of imbalance.
Price tapped back into that zone and took a sell on the reaction and fib 76.4 - 88 zone.
RR 1:3, targeting the lows created which is also a Q4 zone of interest.

Monero XMR price analysisIs CRYPTOCAP:XMR preparing to break its ATH?
Looking at the #XMRUSDT chart, it feels like #Monero is approaching a critical moment.
After years of consolidation, a confirmed hold above $520 could mark the start of a real harvest season 🌾
🔓 This level may become the key trigger that shifts CRYPTOCAP:XMR into a new market phase.
🎯 So what’s the real target for #Monero?
▪️ $1250?
▪️ Or even much higher — $4300?
💰 Current market cap is around $7.9B.
Do you believe CRYPTOCAP:XMR is capable of growing to:
➡️ $23B
➡️ or even $80B?
🤔 Share your thoughts — is #Monero ready to surprise the market again?
______________
◆ Follow us ❤️ for daily crypto insights & updates!
🚀 Don’t miss out on important market moves
🧠 DYOR | This is not financial advice, just thinking out loud

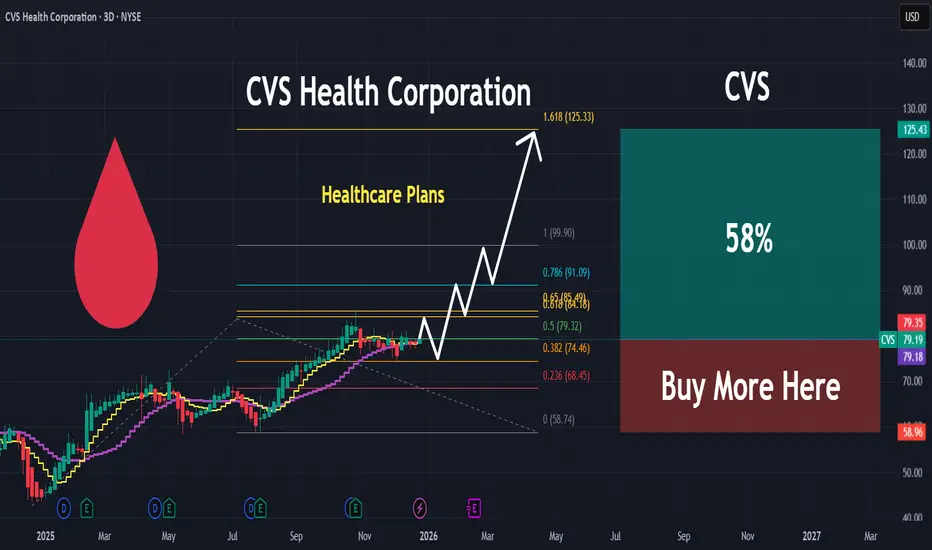
CVS | Rally Mode In Progress Into 2026CVS Health Corp. is a health solutions company, which engages in the provision of healthcare services. It operates through the following segments: Health Care Benefits, Health Services, Pharmacy and Consumer Wellness, and Corporate and Other. The Health Care Benefits segment operates as a health care benefits provider. The Health Services segment offers a full range of PBM solutions, delivers health care services in its medical clinics, virtually, and in the home. The Pharmacy & Consumer Wellness segment dispenses prescriptions in its retail pharmacies and through its infusion operations. The Corporate and Other Segment is involved in management and administrative expenses. The company was founded by Stanley P. Goldstein and Ralph Hoagland in 1963 and is headquartered in Woonsocket, RI.
AFX-002 | GBPUSD — Long | Daily Break + 3D POI TC ContinuationAFX-002 | GBPUSD — Long | Daily Break + 3D POI Teacup Continuation
📅 Timeframe: Daily (Bias) / 15M (Execution)
📊 Bias: Bullish
🔍 Setup Explanation
GBPUSD has delivered a daily break above the 12/19/25 daily high, confirming bullish continuation. Price is reacting from a 50% 3D Point of Interest (POI), supported by a strong 12/19/25 3D bullish engulfing candle.
On the lower timeframe, a 15M teacup structure is forming, suggesting continuation after a corrective move. The expectation is a sell-to-buy retracement into premium demand, potentially aligning with a 0.786 Fibonacci retracement before continuation higher.
🎯 Trade Levels
Buy Zone (Entry): 1.3356 – 1.3395
Stop Loss: 1.3320
Take Profit: 1.3540
📈 Risk–Reward (R:R)
Average Entry: ~1.33755
Risk: ~55.5 pips (1.33755 → 1.3320)
Reward: ~164.5 pips (1.33755 → 1.3540)
R:R: ≈ 1 : 3.0
📈 Target Logic
Take profit is set at the next daily expansion / liquidity objective, aligning with bullish continuation following the daily high break and higher-timeframe engulfing structure.
⚠️ Invalidation
A daily close below 1.3320 invalidates this bullish setup.
📌 Execution Notes (15M)
Look for confirmation such as:
Bullish engulfing candle at the POI
Strong displacement from demand
Clean 15M break and retest before entry
Signal Status: Active

2026-01-12our trade yesterday did hit the TP , congrats who whoever who follow that idea
today's outlook BUY BUY BUY
will not trade sell today , will simply buy the dip that's the game plan today

Opendoor Has Pulled BackOpendoor Technologies made a dramatic move over the summer, and now some traders may look for more upside.
The first pattern on today’s chart is the significant advance from under $1 toward $11. Our Fibonacci retracement starts on Friday, July 11, (before volume surged) and ends at the September 17 peak of $10.87. The resulting 50 percent retracement level of $5.82 was tested on November 7 and again on December 30. Both times OPEN closed above it, which may suggest the upward thrust remains in effect.
Second, the current price zone around $6 matches peaks in August 2022 and August 2023. Did old resistance become new support?
Third, Bollinger BandWidth has narrowed after the big move. That compression may create potential for more expansion.
Next, the macro environment could be improving for housing stocks after the White House took steps to lower mortgage rates.
Finally, OPEN is an active underlier in the options market. (Its average daily volume of about 258,000 contracts would rank 14th in S&P 500, if it were a member of the index, according to TradeStation data.) That could help traders take positions with calls and puts.
TradeStation has, for decades, advanced the trading industry, providing access to stocks, options and futures. If you're born to trade, we could be for you. See our Overview for more.
Past performance, whether actual or indicated by historical tests of strategies, is no guarantee of future performance or success. There is a possibility that you may sustain a loss equal to or greater than your entire investment regardless of which asset class you trade (equities, options or futures); therefore, you should not invest or risk money that you cannot afford to lose. Online trading is not suitable for all investors. View the document titled Characteristics and Risks of Standardized Options at www.TradeStation.com . Before trading any asset class, customers must read the relevant risk disclosure statements on www.TradeStation.com . System access and trade placement and execution may be delayed or fail due to market volatility and volume, quote delays, system and software errors, Internet traffic, outages and other factors.
Securities and futures trading is offered to self-directed customers by TradeStation Securities, Inc., a broker-dealer registered with the Securities and Exchange Commission and a futures commission merchant licensed with the Commodity Futures Trading Commission). TradeStation Securities is a member of the Financial Industry Regulatory Authority, the National Futures Association, and a number of exchanges.
Options trading is not suitable for all investors. Your TradeStation Securities’ account application to trade options will be considered and approved or disapproved based on all relevant factors, including your trading experience. See www.TradeStation.com . Visit www.TradeStation.com for full details on the costs and fees associated with options.
Margin trading involves risks, and it is important that you fully understand those risks before trading on margin. The Margin Disclosure Statement outlines many of those risks, including that you can lose more funds than you deposit in your margin account; your brokerage firm can force the sale of securities in your account; your brokerage firm can sell your securities without contacting you; and you are not entitled to an extension of time on a margin call. Review the Margin Disclosure Statement at www.TradeStation.com .
TradeStation Securities, Inc. and TradeStation Technologies, Inc. are each wholly owned subsidiaries of TradeStation Group, Inc., both operating, and providing products and services, under the TradeStation brand and trademark. When applying for, or purchasing, accounts, subscriptions, products and services, it is important that you know which company you will be dealing with. Visit www.TradeStation.com for further important information explaining what this means.

Breakout Momentum vs Higher-Timeframe DivergenceAfter analyzing the chart, I observe that price initiated a new trend on 5 January 2026 during the Asian session, leaving a breakaway gap, which typically marks the beginning of a strong directional move. Such gaps often remain open as price continues in the direction of the trend; therefore, an immediate gap fill should not be expected.
Following the breakout above the 4488 resistance level, now acting as support, further confirms trend continuation. Based on Fibonacci extension projections, the minimum target lies at the 141.40% level, with an extended target toward the 161.80% Fibonacci extension, as marked on the chart.
On the other hand, higher-timeframe signals indicate potential downside risk. A bearish divergence is visible on the weekly chart, while the monthly chart is trading in an extreme overbought zone. A breakdown below the 4400 level and the 21 SMA could trigger a stronger corrective move toward the 4271.39 support zone, which aligns closely with the 200 EMA.
⚠️ Traders should remain flexible and manage risk carefully as price approaches these critical levels.

SCCO watch $116-117: Double Golden fibs the ideal Support to buySCCO has been retracing with the general market.
Just hit a Double Golden Zone at $116.64-117.93
Looking for a clean bounce to resume uptrend.
.
See "Related Publications" for previous plots such as this PERFECT BOTTOM:
Hit BOOST and FOLLOW for more such PRECISE and TIMELY charts.
========================================================


COIN: substantial downside potential As long as price remains below the October lower high, I’m watching for structural potential pointing toward more downside in the coming weeks, with next key support levels at 240–200.
If price is able to start closing above 375, I will need to re-assess the suggested trend structure for a more immediate bullish upside that I don’t see clearly at this point.
Chart:

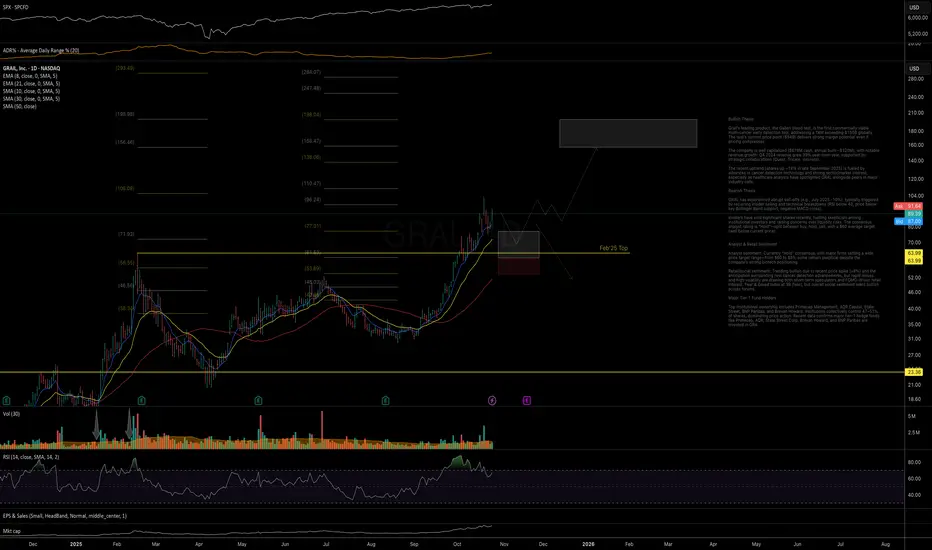
GRAL: strong linearity and decent upside potential strong linear trend structure with price reaching key mid-term resistance, where a new base formation or extended consolidation may be expected.
If the current pullback remains contained within the 77–60 support zone (after one potential leg down), it could complete the corrective phase and set the stage for a higher low formation, opening room for the next upleg toward 155–200 mid-term resistance.
Alternatively, a breakdown below 60 would raise the odds for a transition into a diagonal structure, implying a deeper and longer pullback into the 55–45 area before any new attempt to resume the uptrend.
Chart:
UBER- Uber Technologies, Inc. touched the bullish trend line
- Support aligned with trend line and Fibonacci levels
- I'm looking at $117 to $128 price soon

US30 SELL sideStrong sell move wait for clear point then we take a sell enter ,everything's I show here where to entry and where is TP and SL and please must be sure as per your conformation Rule then enter
