LiamTrading – XAUUSD: A New Trend Taking ShapeGold has entered a new phase, beginning a sharp correction following Chairman Powell’s announcement of a Fed rate cut. On the H1 chart, a bearish Dow structure is clearly forming, suggesting the potential for sustained downside in the medium term.
Most buy-side liquidity has now been cleared, leaving limited scope for a strong recovery – aside from a brief FVG that appeared immediately after the news. Market sentiment indicates that activity during that phase carried little weight. The appearance of a gap highlights growing confidence among sellers in seizing control after the Fed’s statement.
This decline could drive gold towards the 363x area, and potentially extend to the 361x region. A critical level to watch remains 3651, a strong support where price previously rebounded by more than 20 dollars immediately after the announcement.
Trading plan for today:
Sell 3656 – 3659, SL 3666, TP 3651 – 3646 – 3638 – 3634 – 3626 – 3615
Buy 3634 – 3632, SL 3628, TP 3640 – 3652 – 3660
Buy zone 3607 – 3604, SL 3600, TP 3616 – 3625 – 3638 – 3647 – 3660
This is my personal view on XAUUSD for today. Please use it as a reference for your own trading. If you find it useful, follow me for further updates and gold market scenarios.
Fibonacci Retracement

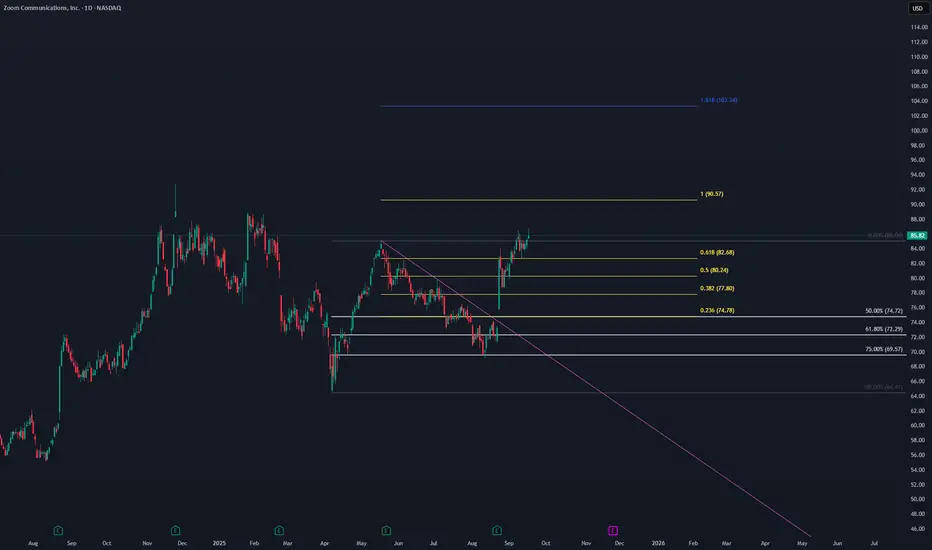
Zoom Update. Near ObjectiveLike previous analysis ZM is near to reach the objective.
FIB RETRACEMENT⮕PRICE RETRACEMENT⮕TRENDLINE CROSSING⮕FIB EXTENSION⮕TARGET THE OBJECTIVE
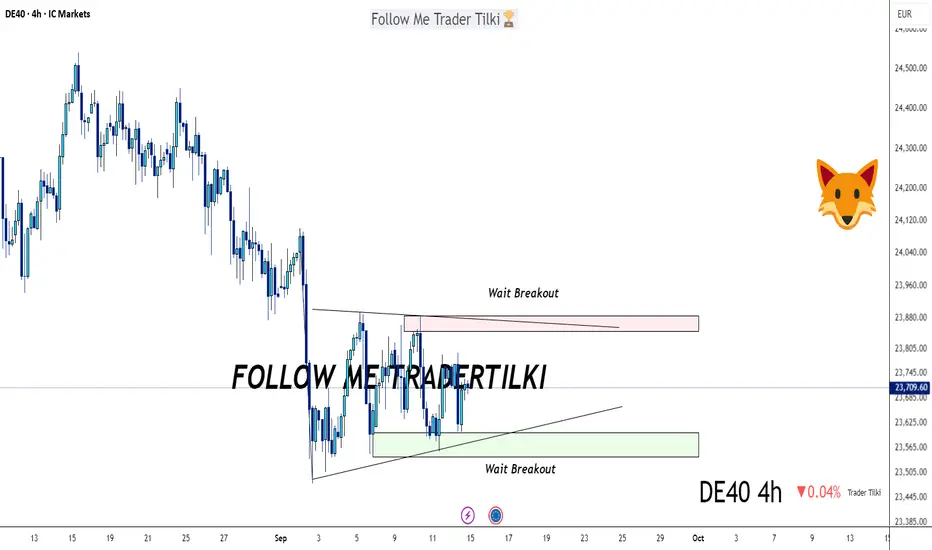
GER40 Loading the Break – Big Move Coming!Hey guys,
I’ve analyzed the GER40 index for you. Right now, it’s too early to drop a clear target—the price is stuck in a consolidation zone. It’s either gonna break down or break out. Once that move happens, I’ll share the exact target right away.
For now, just waiting on the breakout.
Also, every single like from you guys is what keeps me motivated to keep sharing these analyses. Big thanks to everyone supporting me with those likes.
GOLD → The market depends on the mood of the FED. Rate cuts FX:XAUUSD , after reaching 3700, entered a correction phase triggered by profit-taking ahead of important market news—the Fed's interest rate meeting.
Gold is falling and testing 3660-3650 after updating its ATH to 3703 ahead of the Fed's decision. All eyes are on Powell's forecasts and comments on future policy.
Fundamentally, a 25 bp rate cut is already priced in. Much more important is whether the Fed will hint at more than two cuts before the end of the year.
The market is expecting aggressive easing due to the risks of stagflation (weak labor market + persistent inflation).
If the Fed takes a dovish stance (three rate cuts), gold could hit new records.
If it is hawkish, i.e., a surprise (only one or two rate cuts), the dollar will strengthen and gold will correct
Resistance levels: 3674.7, 3686, 3700
Support levels: 3657, 3646.5, 3637
Technically, the further scenario for gold depends solely on the mood of the Fed and Powell's comments. The market still hopes to hear more positive hints and, before that, is forming a deep correction to the liquidity zones indicated on the chart in order to buy cheaper, if the situation allows...
Best regards, R. Linda!

XRPUSD → Will the rate meeting be a bullish driver for altcoins?BINANCE:XRPUSDT.P is consolidating above the previously broken boundary of the descending triangle formed within the bullish trend. Important news is ahead—the Fed's meeting on interest rates, which is highly likely to become a bullish driver for the cryptocurrency market.
The daily structure of the XRP market looks promising. The price is not updating global lows, is staying within the boundaries of the uptrend, and at the same time is breaking through the resistance of the downward correction, trying to consolidate above the fairly strong support level of 2.9535. But the market is waiting for a driver, namely fundamental background. If this background strengthens after Powell's speech, Bitcoin and altcoins may strengthen, including XRP. However, the fundamental background largely depends on the overall mood of the Fed and its comments. The market has already priced in an interest rate cut, as this is predictable given the economic data. But traders will be watching Powell's tone and how dovish or hawkish his view of the situation is.
Support levels: 2.9535, 2.8853
Resistance levels: 3.0577, 3.155, 3.359
Technically, at the moment, I am considering a scenario of a retest of support and the formation of a long squeeze at 2.9535 - 2.8853 against the backdrop of increased news volatility (manipulative nature). However, if this does not happen, the focus will be on 3.0577, and a close above this level could trigger further growth.
Best regards, R. Linda!

GOLD → Testing 3700. What to expect from the price going forwardFX:XAUUSD continues to rally. Ahead lies the psychological barrier of 3700, where the market may form profit-taking ahead of Tuesday and Wednesday's news...
Gold is testing 3700. The bullish trend remains unshakable thanks to a combination of macroeconomic and geopolitical factors.
Expectations of Fed policy easing: There is a high probability of a 25 bps rate cut (possibly even 50 bps) as early as this week. Trump's pressure on Powell reinforces these expectations.
Stagflation risks: Slowing growth amid steady inflation increases the appeal of gold as a hedge.
Risks: Profit-taking: After a sharp rise, a short-term correction is possible in the psychological target zone of 3700. Retail sales data (today): Weak data will support gold, while strong data may temporarily strengthen the dollar. Fed decision (tomorrow): Even if the rate is lowered, a “sell on the fact” reaction is possible.
Resistance levels: 3700, 3710
Support levels: 3685, 3675, 3657
Technically, since the opening of the session, gold has lost part of its daily ATR, and the upward movement may be zigzag-shaped, especially ahead of the news. I expect a correction from the market to 3685-3675 with the aim of rebounding upwards...
Best regards, R. Linda!

GBPJPY → Ascending triangle on an upward trend...FX:GBPJPY is attempting to break through the resistance of the ascending triangle consolidation pattern amid the strengthening of the pound sterling, driven by expectations of interest rate cuts...
The currency pair is breaking through consolidation resistance amid the growth of the pound sterling. The driver is the expectation of positive news...
An attempt to break through resistance is forming, with bulls forming a cascade of support and a local uptrend. If the price closes above 200.27, it will be able to move into a distribution phase.
Resistance levels: 200.27, 200.75
Support levels: 200.06, 199.65
Technically, the chart looks quite strong and aimed at continuing the uptrend. If the bulls can consolidate above the specified level of 200.0 - 200.27, then overall we will see a growth phase. Above the current levels, there is a free zone, and up to 208.0, there are practically no obstacles except for local levels that are not capable of reversing the trend...
Best regards, R. Linda!

GOLD → A s.triangle against the backdrop of a bullish trend... FX:XAUUSD is consolidating in anticipation of positive news from the Fed, namely a cut in interest rates. Against this backdrop, the dollar is falling, which only supports the price of gold...
Gold is trading in a sideways range around $3650 at the start of a week packed with central bank events. Despite the lack of a clear direction, the metal is finding support thanks to several factors.
Key drivers: Weak economic data from China, anticipation of the Fed's decision: On Wednesday, the Fed will almost certainly cut rates by 25 basis points, but there is a chance of 50 basis points. This supports gold.
The tone of Powell's comments will determine expectations for further cuts.
Technically, gold remains stable ahead of key events. China's weak economy and the Fed's dovish policy limit the potential for decline. A break above $3650 is possible with dovish signals from the Fed or an escalation of trade risks.
Resistance levels: 3646, 3657, 3675
Support levels: 3630, 3620, 3600
As part of the formation of a “symmetrical triangle” consolidation, I will consider a retest of the consolidation support with the possibility of further growth (distribution).
Sincerely, R. Linda!

BITCOIN → Consolidation in anticipation of a bullish driver...BINANCE:BTCUSDT is testing the 117K area as part of an upward movement triggered by the end of the bearish correction. The price is moving into consolidation. Focus on the range boundaries...
The market is awaiting the Fed's interest rate meeting. A rate cut could support the growth of the flagship, but before that, the market may form a manipulation in the form of a long squeeze.
The market is forming consolidation after breaking the local correction against the backdrop of a global bullish trend. Focus on the boundaries of the range.
Technically, I would highlight the support of local consolidation and the previously broken trend boundary as two key details that can be used in further trading: 114600, 113300. Behind this zone lies a pool of liquidity, and before a possible rise, the price may try to absorb it... Technically, we are seeing confirmation of a bullish market structure; all that remains is to wait for the appearance of a bullish driver and the market's readiness for growth.
Support levels: 114600, 113300, 110700
Resistance levels: 11700, 117860
A false breakdown of support followed by a close above one of the specified zones could attract buyer interest, which in turn could trigger a price increase within the global bullish trend.
Best regards, R. Linda!

LTCUSDT 1D chart review🔎 key levels
• Resistance resistance:
• 118.92 USDT (local resistance, recently tested several times).
• 126.05 USDT (stronger resistance - if it pierces, the trend is continued).
• Support (Support):
• 113.31 USDT (current level, currently defended).
• 109.28 USDT (SMA as dynamic support).
• 102.38 USDT (key support - if it falls, there may be a stronger decrease).
⸻
📉 Trend
• You can see the yellow inheritance trend line on the chart - the course respected it several times.
• Currently, the price is trying to stay above SMA200 (green line), which is a signal of a potential reflection.
⸻
📊 indicators
• MacD:
• The histogram has gone into a positive zone, which suggests growth moment, but the signal lines are close to each other → possible consolidation.
• RSI:
• Value around 50 → neutral zone, no clear purchase or sale.
• If he pierces 60, he may enter the upward trend.
⸻
📌 Scenarios
1. Bullish
• If it stays above 113.31 and breaks 118.92, the goal will be 126 USDT.
• Confirmation: RSI> 60 and MacD further opening up.
2. Bearish
• If the course drops below 113.31, subsequent support is 109.28 and 102.38.
• Confirmation: Macd Cross down + RSI <45.

HBARUSDT → Correction before the rally...After strong growth from the 0.14 zone, BINANCE:HBARUSDT HBAR updated its maximum to 0.30 and entered a correction phase, testing the intermediate and strong support level of 0.2300. A false breakdown has formed, and price consolidation above the key zone could trigger another rally.
HBAR currently has two key levels: 0.243 and 0.2337. The bulls are trying to keep the correction at the upper support level. However, there is a huge pool of liquidity hidden behind 0.2337, which could be tested (before growth resumes) if 0.243 fails to hold the price.
Locally, the coin is breaking the structure of the downward correction (consolidation in a bull market) and is trying to consolidate above support (in the zone of interest). The end of the current correction phase may lead to a resumption of distribution.
Support levels: 0.2432, 0.2337
Resistance levels: 0.2547, 0.26, 0.2763
The formation of a bullish structure relative to 0.2432 will confirm the presence of an interested, large buyer. This could trigger strong growth. Otherwise, I will wait for a retest of 0.2337, from where I will look for an opportunity to open long positions with the aim of medium-term growth.
Best regards, R. Linda!

ETHUSDT → Correction and hunt for liquidity ahead of growth BINANCE:ETHUSD is showing positive dynamics and breaking through the resistance conglomerate (consolidation boundary and downward correction line). The fundamental background is positive, and bulls are generally quite confident...
The cryptocurrency market, Bitcoin, and altcoins are awaiting a batch of positive news. Traders are waiting for interest rates to fall, which could attract additional capital to the cryptocurrency market, especially ETH.
The breakout of the correction resistance and consolidation resistance gives the market hope for growth. The global trend is bullish, and the fundamental background is positive. If the bulls hold their defense above 4488-4450, ETH may strengthen.
Resistance levels: 4661, 4783
Support levels: 4488, 4450
Technically, I expect a false breakdown of support (retest of the liquidity zone). If this maneuver ends with the price closing above 4488 and the formation of a confirming bullish pattern, then in this case, we can consider the continuation of growth.
Sincerely, R. Linda!

GOLD → Consolidation before continuing growth to 3700 FX:XAUUSD resumed its growth on Friday, approaching the $3,650 level, amid growing expectations of aggressive Fed rate cuts and geopolitical risks. The metal remains near record highs and is poised for a fourth consecutive week of gains.
Key drivers: Probability of a 25 bp rate cut on September 17 — 92%, chance of a 50 bp cut — 8%. Markets are expecting three cuts in 2024. US plans to impose new tariffs on India and China are supporting demand for safe havens.
Gold remains in a bullish trend. The weak US economy and geopolitics are pushing it to new highs, but profit-taking at current levels is possible.
There is no news today, so trading may be relatively calm.
Technically, if the price does not retest 3738 but begins to consolidate near 3657 and attempts a breakout, the chances of continued growth will increase.
Support levels: 3638, 3630
Resistance levels: 3649, 3657
I expect the market to reach the liquidity zone of 3638 before returning to retest the trigger. However, if MM deems this maneuver unnecessary and forms a trading range between 3657 and 3649, then closing above 3657 could lead to another bullish distribution.
Sincerely, R. Linda!

PLTR to 234Big weekly bullish engulfing candle to end the week after a perfect 0.618 rejection 2 week prior. Upside target is just short of 234, stop is 2 fib levels below. If this one doesn't work out, I will be looking for another entry lower.

ETH/USDT 1D chart review🔎 Technical analysis
1. Trend
• You can see a clear growth trend line (orange). The price consistently reflected from her, which means that the buyers defend this level.
• Currently, the price is above trendline, which is a bull signal.
2. Support and resistance
• Support:
• $ 4,429
• USDT $ 4,556
• resistance:
• $ 4.687 USDT (current price fight - this is where the market is testing)
• USD 4,793 (strong resistance)
• USD 4,954 (key psychological resistance - nearly 5K)
3. Candles
• We have a long green up move - the momentum is strong.
• The last candles show a little indecisive at 4.687 (upper shadows), i.e. possible consolidation or back.
4. STOCHASTIC RSI (oscillator at the bottom of the chart)
• enters the purchase zone (> 80).
• This often heralds correction, but in strong trends the indicator can last long.
⸻
📊 Scenarios
• bull (continuation of growth):
If ETH stays above 4.687 and pierces 4.793, the next goal is 4.954 (and then psychological 5,000).
• Bear (correction):
Rejection 4.687 and descent below 4.556 can open the way to the Trendline test around 4.430.
Puncting the trend down is a reversal signal and a possible drop towards 4.200.
⸻
📌 Summary
• Main trend: upward.
• Momentum: Strong, but the indicators show buying.
• Strategy:
• Careful entrances with support (4.556 / 4.430).
• confirmed breaking 4.793 = strong signal for further increases.
• Stop loss below Trendline (~ 4,400), because it will negate the current script of the bull

1D chart | XRP/USDT – Bigger 5th Wave in Play: or WXYXZ?I’m tracking the development of the larger 5th wave for OKX:XRPUSDT , which currently has a target range between 4.0600 and 5.4003 .
My main scenario is a standard 5-wave impulse. In this case, wave 3 should extend toward 4.2766 , with the full 5th wave likely pushing deeper into the broader target zone.
The alternative scenario is a complex W–X–Y–X–Z correction. This would imply a minimum target of 3.6618 , but more realistically it should go within the 4.4348–4.9888 zone before the structure completes.
For now, I lean toward the impulsive count, but I’ll be watching price behaviour near these key levels for confirmation.
💬 Which scenario do you think is more likely to play out?

$BTC The Correction is OVER - IH&S 50DMA Reclaim.VERY CONFIDENT THE ₿ITCOIN CORRECTION IS OVER 🤓
In other words, WE'VE SEEN THE SEPTEMBER LOWS.
Inverse Head & Shoulders reversal pattern closed outside of the Danger Zone and CRYPTOCAP:BTC reclaimed the 50DMA.

GOLD → Retest 3620 - 3600 (imbalance zones) on the uptrendFX:XAUUSD is consolidating ahead of important news. The market is currently testing support, but the bullish pattern remains intact despite the intraday correction.
Gold is trading near $3650 in anticipation of US inflation data (CPI), which will determine the further trend. So far, the metal is consolidating below a record high of $3675.
High CPI data: will strengthen the dollar and weaken gold (bets on Fed easing will decline).
Low data: will push gold to new highs (the likelihood of aggressive rate cuts will be confirmed).
At the moment, the probability of a rate cut on September 17 is 92% (25 bps), with an 8% chance of 50 bps.
Technically, the chart is forming a consolidation against the backdrop of a bullish trend, the market is testing support, and if the bulls hold their ground in the key zone, traders may return to buying.
Resistance levels: 3638, 3649, 3657
Support levels: 3620, 3607, 3600
There is a battle for the 3620 zone. Consolidation above this zone will confirm bullish strength; otherwise, we can expect a deeper correction to the 3607-3600 zone to retest the imbalance area before further growth.
Best regards, R. Linda!

NZDUSD → Correction before bull run to 0.600FX:NZDUSD , after breaking the downtrend, is forming a consolidation, the goal of which is the potential for continued growth...
The dollar is forming a small countertrend correction, to which the market is reacting, but overall sentiment on currencies is relatively bullish amid expectations of interest rate cuts...
NZDUSD is forming a trading range (consolidation) after breaking through the resistance of the downtrend. 0.5915 - 0.596. Before the growth, MM may form a liquidity capture at 0.5915 - 0.5f.
Support levels: 0.5915, 0.5884
Resistance levels: 0.5960, 0.5996
Interest rate cuts, especially aggressive ones, could trigger a fall in the dollar, which in turn would support forex currency baskets. Against this backdrop, NZDUSD could trigger medium-term growth from the specified support zone.
Best regards, R. Linda!

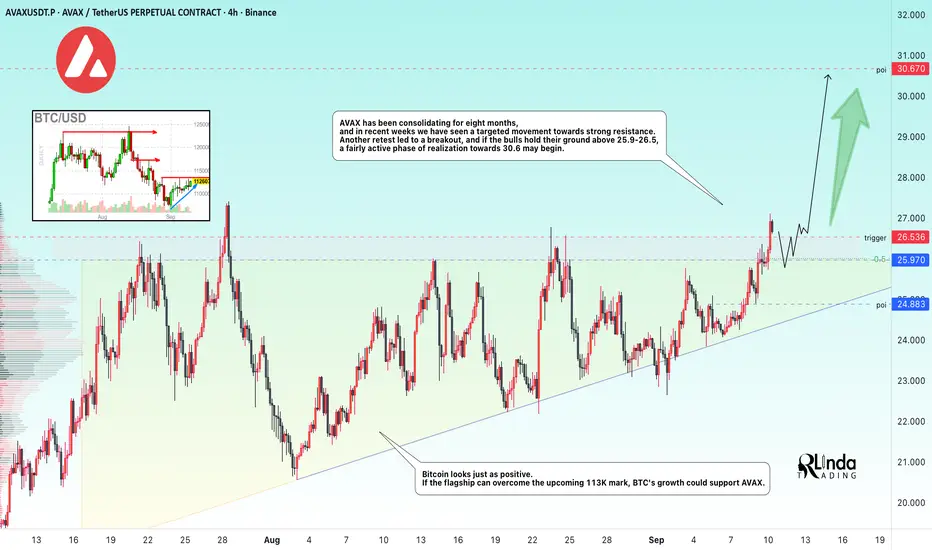
AVAXUSDT → Distribution of 8-month accumulationBINANCE:AVAXUSDT is testing the resistance of an 8-month consolidation. The market is showing positive signs that may indicate a possible rally...
Bitcoin looks positive. If the flagship can overcome the upcoming 113K mark, BTC's growth could support altcoins, including Avalanche.
AVAX has been consolidating for 8 months, and in the last few weeks, we have seen a directed movement towards strong resistance. Another retest led to a breakout, and if the bulls hold their defense above 25.9 - 26.5, a fairly active phase of realization towards 30.6 may begin.
Resistance levels: 26.550
Support levels: 25.97, 24.88
I do not rule out the possibility of a retest of the local support and liquidity zone, but a return to the zone of interest (above 25.97 - 26.55) and consolidation above the specified border could provoke a distribution towards 30.0 - 45.0.
Best regards, R. Linda!
EUR/USD 4H | Retest of Breakout Zone – Next Leg Higher?Market Structure:
EUR/USD has finally broken above its multi-week descending trendline and is now retesting the breakout zone. Price action has compressed into the 1.1680–1.1700 range, aligning with key technical factors.
Technical Confluence:
✔️ Fibonacci Retracement: Price sits at the 0.5–0.618 retracement (“golden pocket”) of the latest swing.
✔️ Moving Averages: 50 EMA and 200 EMA cluster at current support.
✔️ Trendline Retest: Old resistance flipped into potential new support.
✔️ Structure: Higher-low formation holding above 1.1640.
⚡ Key Levels to Watch:
Support / Buy Zone: 1.1680–1.1700
Invalidation (Stop-Loss Idea): Below 1.16080
Resistance / Targets:
TP1 → 1.1780 (previous high)
TP2 → 1.1825 (-0.27 Fib extension)
TP3 → 1.1885 (-0.618 Fib extension)
📌 Trade Idea:
(Swing Long Bias)
Entry Zone: 1.1680–1.1700
Stop: Below 1.16080
Targets: 1.1780 → 1.1825 → 1.1885
Risk/Reward: ~1:1.5 to 1:2.25
🧠 Bias:
Holding above 1.1690 = bullish continuation favored.
Losing 1.1680 could expose 1.1608, and deeper to 1.1485 monthly support.
🔮 Outlook:
The EUR/USD breakout + retest setup aligns fibs, EMAs, and structure into a strong confluence zone. If bulls hold this level, expect continuation toward 1.1825 → 1.1885 in the coming sessions.
What do you think traders does EUR/USD hold this breakout, or will sellers drag it back below 1.17?
#EURUSD #Forex #SwingTrading #PriceAction #Fibonacci #Breakout
@WrightWayInvestments
@WrightWayInvestments
@WrightWayInvestments

GOLD → Consolidation before continued growth FX:XAUUSD is undergoing a correction amid revised unemployment data, but this has not disrupted the overall technical situation. The market is still anticipating an aggressive reduction in interest rates...
The price resumed its growth on Wednesday amid escalating geopolitical tensions and a weakening dollar ahead of the release of US inflation data (PPI). The price is correcting after a record high of $3675, but retains the potential for further growth.
The escalation of the situation in Eastern Europe and the Middle East is increasing demand for safe assets. Expectations of Fed policy easing and a revision of employment data are weighing on the USD.
PPI inflation data: Today's release may temporarily support the USD if the figures exceed forecasts, but the overall trend remains bearish for the dollar.
PPI data is ahead, which may cause short-term volatility, but the long-term bullish trend remains intact.
Support levels: 3640, 3628
Resistance levels: 3657, 3675
Technically, I expect to see a correction from local resistance to the 3645-3640 area, from which growth may continue. A breakout of 3657 could trigger a continuation of the momentum.
Best regards, R. Linda!

EURUSD → Breakthrough of consolidation resistance. Rally?FX:EURUSD ends correction with a breakout of consolidation resistance. The market is waiting for a positive driver in the form of economic news that could support the growth of the euro...
A breakout of the correction (consolidation) resistance has formed. However, the momentum is being replaced by a correction aimed at consolidating in the bullish plane, which could trigger continued growth in the medium term.
The dollar looks weak, and expectations of interest rate cuts are supporting the euro. If the bulls keep the price above 1.17 - 1.172 within the current correction, the price may start to rally to highs...
Support levels: 1.173, 1.1703
Resistance levels: 1.178, 1.183, 1.190
Before continuing to grow, liquidity may be captured relative to the previously broken consolidation resistance. A false breakdown of support at 1.173-1.170 could trigger a resumption of growth towards 1.190.
Best regards, R. Linda!
