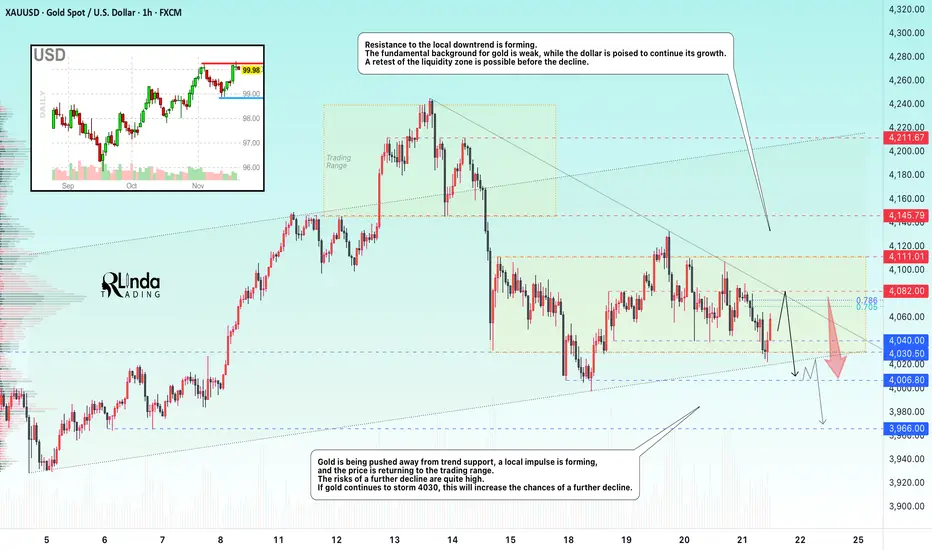
GOLD → Mixed data forms a symmetrical triangle FX:XAUUSD is bouncing off support at 4030, with bulls trying to maintain the current trend. The fundamental backdrop is currently weak for gold, which is why there are bears in the market. The PMI report is coming up...
Mixed US employment data (NFP growth to 119K, but unemployment rose to 4.4%) has created uncertainty. The probability of a Fed rate cut in December remains at 40%. Fed officials remain cautious, warning of the risks of premature easing.
Focus on the 4070-4082 area and local trend resistance...
Gold is awaiting new signals from PMI data. A breakout of the range is likely if there are significant deviations from forecasts (Manufacturing PMI: 52, Services PMI: 54.8)
Technically, a symmetrical triangle is forming on the chart, which could keep the market within its boundaries if the fundamental background remains unchanged. However, a breakout of either boundary could trigger a distribution in the direction of the break
Resistance levels: 4080, 4110
Support levels: 4040, 4030, 4006
In the medium term, gold currently looks weak. The reaction to support is weakening, a cascade of levels and a downward resistance line are forming. The market may test the 4080 area, but if the PMI is weak, gold will return to attack the trend support. However, a break above 4082 and a close above this zone could give us a chance for growth.
Best regards, R. Linda!
Fibonacci Retracement
NZDUSD → The hunt for liquidity. Bearish trend...FX:NZDUSD is forming a correction towards consolidation after updating its global minimum. Bears may play aggressively against the backdrop of a strong dollar.
The dollar is quite strong after Thursday's news. After retesting resistance, the index is not falling, but is gathering strength and may continue to grow.
The global trend is downward. After a long consolidation, the currency pair is breaking support and updating its low. The market sentiment is bearish. Against this backdrop, NZDUSD may continue to decline after retesting resistance at 0.560 and a false breakout...
Resistance levels: 0.5606, 0.5635
Support levels: 0.555, 0.55
A false breakout, lack of bullish momentum, and price consolidation below 0.56 could trigger a further decline in price within the current trend.
Best regards, R. Linda!

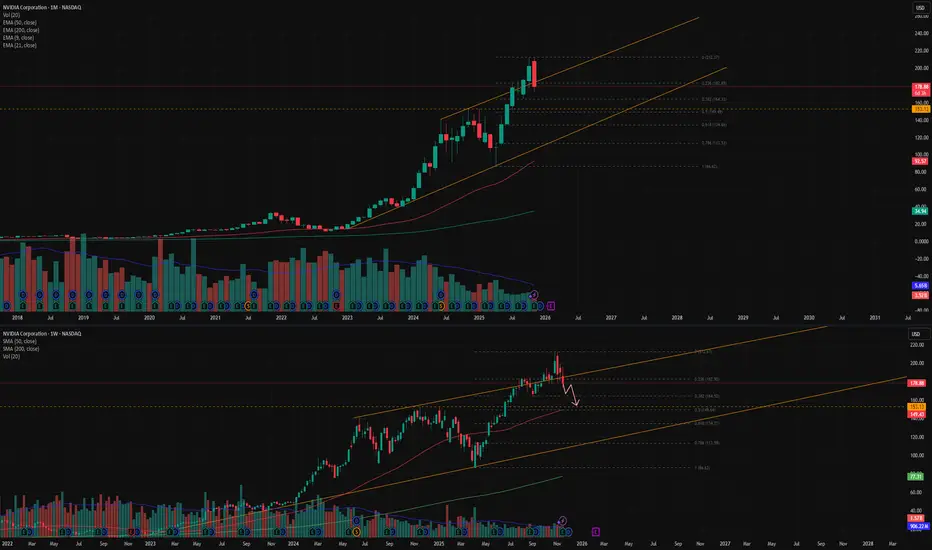
NVDA ALERT: Critical Drop AheadNvidia remains in a broader uptrend, but the chart shows a clear trendline breakout followed by the beginning of a pullback.
Using Fibonacci, a correction typically starts after a red candle forms following a sequence of green candles. In most cases, the pullback continues toward the 0.5 retracement level. In this setup, the 0.5 level aligns with a major key support, increasing its importance.
On the weekly timeframe, the 50 EMA is also converging at the same zone, which often acts like a magnet for price. This creates multiple confirmations pointing toward a potential move downward.
The weekly chart has printed a bearish engulfing , followed by three consecutive red candles, adding another strong confirmation for a continued correction.
Both MACD and RSI are sloping downward, supporting the bearish momentum.
If price reaches the expected zone, monitoring the reaction will be critical. A deeper decline into the global trendline is possible only if the key level is broken, though this scenario appears less likely.
Overall, NVDA shows several aligned signals indicating a move toward the correction zone before any potential recovery.
GOLD → Waiting for NFP... High importance level!FX:XAUUSD is stagnating ahead of the news. The market is in a phase of uncertainty, with long shadows and short candlestick bodies. The key factor will be the US employment data for September.
We have not seen unemployment data for more than seven weeks, which makes this data highly significant. Complete uncertainty. Significant deviations from forecasts could significantly change expectations for Fed rates. The probability of a Fed rate cut in December fell to 33% after the publication of the minutes, in which the regulator expressed concerns about inflation.
The market expects 50K jobs to be created in September, compared to 22K in August.
The unemployment rate is forecast at 4.3%, with wage growth at 3.7% year-on-year.
The further dynamics of gold depend on the NFP data. Weaker indicators may reinforce expectations of Fed policy easing and support price growth, while strong data will put pressure on the metal
Resistance levels: 4082 - 4111
Support levels: 4040, 4006
In the current circumstances, having only one scenario means narrowing your view of the situation as much as possible. The market can be aggressive on news. Weak data could lock the price within the current range (trading between graces). However, a breakout of resistance at 4082 - 4111 and a close above this level could trigger growth. Otherwise, a breakdown and consolidation below 4040 could break the current bullish trend and trigger a sell-off to 3930 (especially against the backdrop of the Fed's weak but hawkish stance).
Best regards, R. Linda!

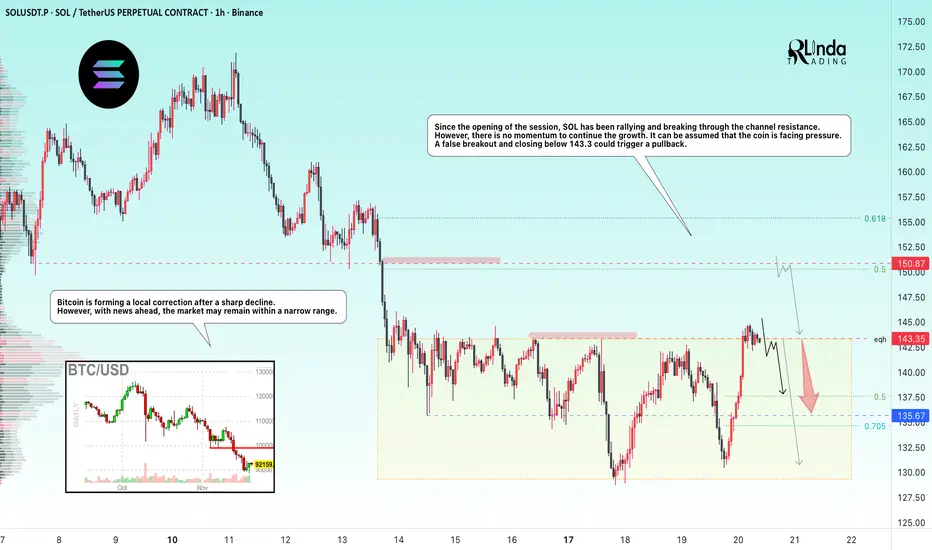
SOLANA → Manipulation - false breakout of resistance BINANCE:SOLUSDT.P flew up to resistance at 143.35 at the opening of the session and attempted to break through it, but bears may not let the price rise ahead of the news...
Bitcoin is forming a local correction after a sharp decline. However, news is ahead and the market may remain within a narrow range.
From the opening of the session, SOL rallies and breaks through the channel resistance, wasting 75% of its intraday growth potential. However, there is no momentum to continue the growth. It can be assumed that the coin is facing pressure. A false breakout and closing below 143.3 could trigger a pullback.
Resistance levels: 143.35, 150.87
Support levels: 135.67, 130.0
Two key levels for countertrend movement: 143.35 - 150.87. If the liquidity pool does not stop the price at the nearest level, then 150.87 can be considered as an additional level for trading a false breakout.
However, news on unemployment is coming soon, and the market may react quite aggressively. Therefore, if there are no trading opportunities before the news, I recommend refraining from action for an hour and waiting out the storm...
Best regards, R. Linda!
XAUUSD–FRIDAY BEFORE PMI: MAINTAINING HEAD AND SHOULDERS PATTERN💛 XAUUSD – FRIDAY BEFORE PMI: MAINTAINING HEAD AND SHOULDERS PATTERN, WAITING TO BREAK RANGE 4132–3998 🎯
🌤 1. Overview
Hello everyone, it's Lana here again 💬
Today is the last Friday of the week, the market is waiting for PMI and preparing to enter a phase with a lot of important data in December.
Meanwhile, BTC has been rising faster than XAU in recent weeks, indicating that speculative money is leaning towards crypto, while gold is temporarily moving sideways accumulating.
The US Department of Labor will release the November employment report on December 16, which is 6 days after the December Fed meeting. In other words, the Fed is in a "blackout" state regarding labor data for nearly another month – this forces the market to price in advance, making gold's volatility range wide but lacking a clear trend.
💹 2. Technical Analysis – Range & Head and Shoulders Pattern
On the H3/H4 frame, gold is fluctuating within the large range of 4132 – 3998.
The price wave is gradually narrowing towards the end of the triangle, represented by:
Lower highs,
Higher lows,
→ When one of the two boundaries is broken, a new trend is likely to explode in the direction of the breakout.
The inverse Head – Shoulders – Head pattern has not been broken:
Left shoulder – Head – Right shoulder are all above the rising trendline.
For the final wave of the pattern to follow the rhythm, the price needs to confirm surpassing 4109:
When closing a candle above 4109, the short-term uptrend is confirmed,
At that point, gold can aim for higher liquidity areas such as 4132 → 4145 → 4200.
Conversely, if gold breaks 3998, this will be both:
breaking the range bottom,
and negating the Head and Shoulders pattern,
→ opening the possibility of a deeper decline to the 3960–3920 area.
🎯 3. Reference Trading Scenarios
💖 BUY Scenario – following the pattern & range bottom support
1️⃣ Buy at support 3998–4000
Entry: 3998–4000
SL: below 3990 (depending on risk management)
TP: 4025 → 4040 → 4078
2️⃣ Buy when confirmed above 4109
Condition: Price closes a candle above 4109, confirming the Head and Shoulders pattern is maintained.
Entry: around 4100–4105
SL: 4090
TP: 4132 → 4145 → 4200
💢 SELL Scenario – trading the upper boundary of the range
Sell: 4130–4132
SL: 4138
TP: 4110 → 4095 → 4070 → 4045
Selling should only be considered as scalping against resistance within the range, not the main trend if the Head and Shoulders pattern is still valid.
⚠️ 4. Notes & Risk Management
Range 4132–3998 is still controlling the market:
Above 4109 → prioritize Buy according to the short-term uptrend.
Below 3998 → consider shifting bias to Sell following the breakout.
PMI, Fed expectations, and upcoming employment data may trigger unexpected volatility, therefore:
🌷Gold is at the intersection of technical patterns and macro stories 💛
Be patient and wait for reactions at 3998 and 4109, as these are the two key points that determine whether we enter a new upward wave or a deeper decline.
💛 Like – 💬 Comment – 🔔 Follow LanaM2 to follow gold with me every day ✨

ETH/USDT 1W review1. Broken uptrend
The black upward trend line has been clearly broken down.
➡️ This is a signal of a change in the market structure from uptrend → downtrend.
⸻
2. The current candle is under the important support of USD 3,070
You marked the ~3070 level as previous support.
Now the price is clearly below it, which suggests:
• breaking support,
• a retest from below may occur,
• continuation of declines is likely.
⸻
3. Another important support on the chart
I see strong levels:
🔴 #1 Support: $2,830 - $2,900 (current price)
This is the zone where the price is trying to hold – but it looks like there is a weak reaction.
🔴 Backer #2: $2,147
This is a wide zone where the upward impulse previously began.
➡️ If ETH drops below 2800-2830, the next logical target is 2150-2200.
⸻
4. RSI (1W) shows a downward trend
• RSI is around 40, which is close to the oversold zone.
• The RSI trend has been down for months.
• No bullish divergence (no trend reversal signal).
➡️ This supports the narrative of further declines.
⸻
5. Candle structure - clear downward momentum
Some previous candles:
• large red bodies,
• no aggressive buying,
• reflections are weak,
• The weekly candle currently looks bearish.
⸻
📊 Technical Summary
Based on the chart:
Short-term and medium-term trends: downward
The price broke key supports
Most likely scenario:
➡️ Continued declines to USD 2,150-2,200
if the 2830 level is broken and the weekly candle closes below.
⸻
📈 When would things look like they would turn around?
Only if:
✔️ Price will return above 3070
✔️ And will maintain a weekly close above this level
✔️ RSI will bounce up and divergence will appear
Then we can talk about a greater chance of returning to 3,500 and beyond.

GOLD - Elliott Wave AnalysisGold has now confirmed a breakout from the contracting triangle, completing the B wave of the corrective structure. This breakout supports the expectation that price is preparing for a C-wave advance toward the upper Fibonacci cluster.
Current Structure
• Triangle confirmed as wave B
• Breakout aligns with the internal subdivisions
• Wave (2) still unfolding as a W-X-Y / ABC-type correction
• C-wave upside targets: 4140–4180
• Key fib levels: 0.618 = 4153, 0.764 = 4188
What to Expect Next
A clean impulsive rise is anticipated as the C-wave develops.
Invalidation remains below the B-wave low.
Completion of Wave (2) in the highlighted zone would maintain the broader bearish sequence.
Structure remains clear and the roadmap is intact.

bitcoin Outlook after the Dip. What to expect NOW?After breaking out of the descending wedge, the price has reached a very strong PRZ (Potential Reversal Zone) support area. If the price holds this zone, there is hope for a rebound toward new highs. However, if this support fails, the price could drop below $70,000.
USDJPY breakout: Can the rally extend toward 155?The dollar-yen pair smashed through 150 with one of the strongest breakouts recently, confirming a new technical phase as it trades above the 61.8% Fib retracement. Here’s what’s fuelling the move and what traders should watch next:
Dollar strength returned as safe haven flows dominate, even with a US government shutdown, while Japan’s new prime minister’s dovish signals are sending the yen into freefall.
Key drivers
Safe haven flows : Investors seek shelter in the dollar as global uncertainty rises; DXY index hit a 6-week high.
Yield differentials : The Fed/BOJ spread powers further carry trade buying as Japanese rates remain ultra-low.
Japanese political shift : PM Takaichi’s win spurs fiscal stimulus and pushes back market hopes for BOJ tightening, deepening yen weakness.
Technical breakout : Clean break above multi-year resistance and 61.8% Fibonacci retracement; watch for support validation and continuation toward the next 78.6% Fib at 154.80.
What to watch
Holding above 150 and 61.8% Fib support sets the stage for a bullish continuation.
Profit taking is possible near 153.25–154.80, as RSI shows signs of overbought.
Tonight’s FOMC minutes, Thursday’s BoJ/Ueda speech, and political headlines could trigger sharp moves.
Cross-pair momentum : EURJPY at record highs, GBPJPY surging, confirming broad-based yen weakness.
The bulls are in control as long as USDJPY stays above 151.15–150.50. Pullbacks to support offer opportunities to buy dips, with 154.80 as the next bullish target. Keep stop losses disciplined, and don’t ignore the chance for sharp reversals if intervention or a dramatic shift in sentiment emerges.
For more actionable FX insight, follow ThinkMarkets.
This content is not directed to residents of the EU or UK. Any opinions, news, research, analyses, prices or other information contained on this website is provided as general market commentary and does not constitute investment advice. ThinkMarkets will not accept liability for any loss or damage including, without limitation, to any loss of profit which may arise directly or indirectly from use of or reliance on such information.

It Needs a Correction in 6MMy annotations are very simple, and they speak for themselves. The market is over-extended in 6M temporality and needs a correction, the first red candle in 6M in a long time is confirming this.

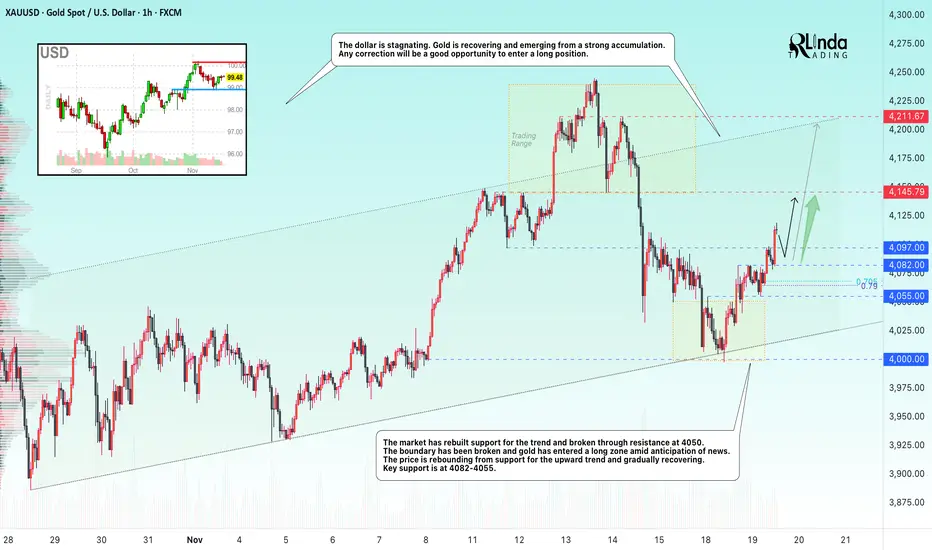
GOLD → Market support, exit from consolidationFX:XAUUSD is feeling market support ahead of the news. The price is rebounding from trend support, breaking through strong resistance and enjoying high interest from bulls...
The rise in demand for defensive assets is driven by concerns about the overvaluation of technology stocks and weak US labor market data. The number of applications for unemployment benefits rose significantly in October. Private employers cut jobs for four weeks. The Fed minutes may show disagreement over the regulator's future policy, and the probability of a rate cut in December is estimated at 50/50. The market's attention is focused on September NFP data (forecast: +50K).
Gold is awaiting signals from the Fed and employment data. The Fed's cautious stance and weak NFP data could support further price growth.
Resistance levels: 4145 - 4211
Support levels: 4097, 4082, 4055
Gold is entering a long zone. Any correction could be a good opportunity to enter the market. Pay attention to key support levels for trend trading...
Best regards, R. Linda!
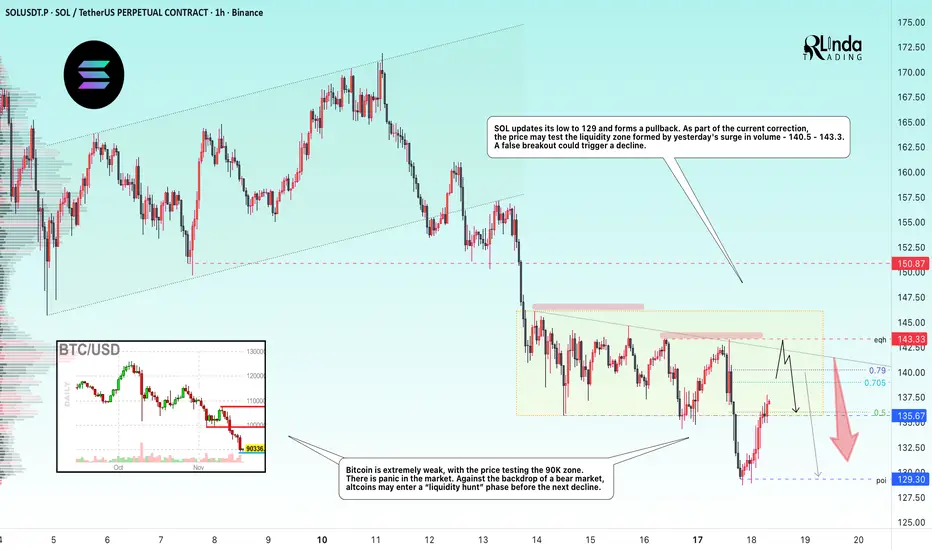
SOLANA → Hunting for liquidity in a weak market BINANCE:SOLUSDT is forming a countertrend correction. Zone of interest: 140.0–143.5. The lack of bullish potential and positive fundamentals could cause another decline...
Bitcoin is extremely weak, with the price testing the 90K zone. There is panic in the market. Against the backdrop of a bear market, altcoins may enter a phase of “liquidity hunting” before another decline.
Solana's price on D1 broke through fairly strong support at 141.3-138.5. The trend is bearish, and the breakout of support confirms the weakness of buyers (strength of sellers) at the moment.
SOL is updating its low to 129 and forming a pullback. As part of the current correction, the price may test the liquidity zone formed by yesterday's surge in volume - 140.5 - 143.3
Resistance levels: 139.0, 140.2, 143.3
Support levels: 135.67, 129.3
Consolidation is forming above the support range - 135.67. Most likely, bulls may flood the volume and provoke another rise to the liquidity zone, but there may not be enough potential for continued growth. A false breakout and lack of bullish momentum could trigger a decline to 135.5 - 129.3.
Best regards, R. Linda!
GBPJPY → Attempt to reverse the local trend to bullish FX:GBPJPY breaks the structure of the local downtrend amid the fall of the Japanese yen. The price may continue the global bullish trend...
The yen continues to fall, the pound is rising. A breakout of the trend resistance is forming. The global trend is bullish. Key support is 203.500 - 203.260. Consolidation above this zone will confirm the bullish structure and may support further growth. If the bulls keep the price above 203.500, it could trigger growth.
Resistance levels: 204.06, 205.32
Support levels: 203.52, 203.26
There is a battle between the bulls and bears for the 203.5 area. Consolidation is forming above 203.0, confirming the importance of the current zone. Now the focus is on the bulls; if they can keep the price above 203.5, the growth will continue. Otherwise, the price may test support...
Best regards, R. Linda!

GBPCHF → Countertrend correction. Retest of resistance FX:GBPCHF is testing key resistance at 1.0515 as part of a countertrend correction. Bears are behaving quite aggressively in the current market...
The global trend is downward. After retesting the local bottom, the currency pair is forming a correction to the previously broken consolidation border.
The key area of interest is 1.0515, and bears are trying to hold it. The battle for the zone has been going on for several hours. In extreme cases, a retest of 1.054 is possible before a decline.
A false breakout of resistance (consolidation border) is forming as part of a countertrend movement...
Resistance levels: 1.0515, 1.0542
Support levels: 1.0486, 1.0443
If the bears keep the price below 1.0515, completing the reversal pattern, this could trigger a further decline. Otherwise, the currency pair may form a short squeeze and test 1.0542 before declining...
Best regards, R. Linda!

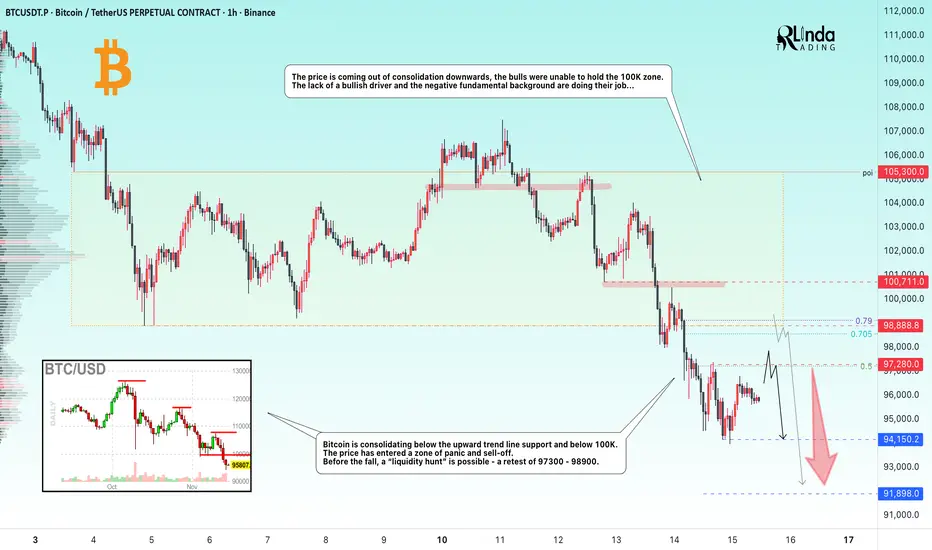
BITCOIN → 100K broken. Consolidation in the short zone...BINANCE:BTCUSDT.P broke through the 100K support level and is consolidating within the local range of 94,150 - 97,280. The decline may continue if the market does not receive support (news or other bullish drivers).
Bitcoin is consolidating below the upward trend line of support and below 100K. The price has entered a zone of panic and sell-off. Before the fall, a “liquidity hunt” is possible - a retest of 97300 - 98900.
The price is coming out of consolidation downwards, the bulls were unable to hold the 100K zone. The lack of a bullish driver and the negative fundamental background are doing their job...
Resistance levels: 97280, 98900, 100700
Support levels: 94150, 91900
Before further decline, the market may test the previously broken support zone relative to the upward lower trend line. Focus on the 97280 - 98990 zone. A false breakout and lack of bullish momentum could form a reversal pattern and trigger a decline to 94150 - 91900.
Best regards, R. Linda!
TECHNICAL ANALYSIS – BTC (4H)📉
1. Main trend – still down
I see a clear downward trend channel (yellow lines) on the chart. The price is moving in the lower half of the channel, which means that supply pressure is still dominant.
2. Rebound, but under strong resistance
The recent upside breakout looks more like a correction in a downtrend than a reversal.
The closest resistance levels I see on the chart:
94,500 – 95,000 → EMA + local level
96,000 – 96,500 → next EMA
98,000 – 99,000 → key level where the SMAs are located
Until BTC breaks above 96,500–97,000, there's no way a sustained trend reversal will occur.
3. Current Reaction at the SMA/EMA
The price touched the red moving average (SMA?) but was rejected—a classic reaction in a downtrend.
This signals:
a lack of buying power,
a predominance of supply in the 93,300–94,500 area.
4. Support Levels I See
At the bottom, you have specific lines that make sense:
89,900–90,000 → key support
89,500 → marked level
87,600–86,500 → lower part of the channel + previous bounce
If BTC loses 89,500, a move to the 87,000–86,500 area is very likely.
5. MACD – early, but cautious signal
The MACD has started to move up, but:
there is no clear crossover yet,
the histogram is weak.
Interpretation:
The rebound continues, but there is no confirmation of a trend change.
6. RSI – slightly bullish, but neutral
RSI ~49, so:
it is not oversold,
it is not overbought,
there is room for both a further rebound and a decline.
The RSI does not provide a strong directional signal.
📌 Summary – what looks most realistic?
Baseline scenario (60% chance): continued decline
Price will rebound to:
94,000–95,000,
possibly to the upper band of the channel (95–96K),
and be rejected → a decline to 89,500, and then 87,000–86,500.
Bullish scenario (40%): breakout of the channel
We need to see:
a 4-hour candle close above 96,500,
preferably a retest and hold,
only then can we talk about a trend reversal and a move towards 98,500–100,000.
📈 Market assessment (neutral–bearish)
Everything indicates that we are only in a correction within the descending channel. Until BTC breaks ~96.5K, the advantage is on the bears' side.

GOLD → Retest 4050 in a weak market...FX:XAUUSD is bouncing off support at 4000 and forming a correction towards 4050, an important resistance level. The market's main focus is on the September employment report (NFP), which will be released on Thursday.
Key pressure factors:
The strong dollar is supported by hawkish statements from the Fed and risk aversion. The probability of a rate cut in December has fallen to 42%.
Support for gold: Demand for government bonds has lowered the yield on 10-year Treasuries, allowing gold to rebound to $4045.
A series of negative labor market reports keeps risks alive.
Gold remains under pressure. A break below $4000 will open the way to $3950, while a rise above $4050 will require weak NFP data or dovish Fed rhetoric. The week will determine the direction
Resistance levels: 4050, 4090
Support levels: 4000, 3965
The market is beginning to doubt the local bullish structure. Strong trend support is breaking down and the previously broken level is being retested. If the bears keep the price below 4045-4050, gold could continue to decline. However, it is worth keeping an eye on the news in the second half of this week...
Best regards, R. Linda!

What will be the next gold trend on November 18th?1. Trend and Trend Lines
Prices are trading below a major descending trend line.
→ The overall trend remains down.
The long-term ascending trend line (red) has already broken out,
signaling weakening buying pressure and increased downward pressure.
2. Key Resistance
4.103 – 4.105:
Strong resistance zone where the Fibonacci (0.618–0.5), horizontal resistance, and EMA overlap.
→ Selling is likely to reassert itself in this price range.
3. Key Support
3.932 – 3.940:
This is the strongest support zone, overlapping the Fibonacci extension at 2.618.
This is an important low point in the bearish structure.
4. Price Scenario
If prices fail to retest the resistance at 4.103,
→ A continued decline along the downward trend is likely.
The next target is around 3.932 – 3.950.
Summary
Major Trend: Downward
Strong Resistance: 4.103 – 4.105
Target Support: 3.932 – 3.950
Structure: Trendline Break + Fibo Extension → Prefer Downward Scenario
BUY GOLD: 3932 – 3930
Stop Loss: 3922
Take Profit: 100–300–500 pips
SELL SCALP GOLD: 4064 – 4066
Stop Loss: 4073
Take Profit: 100–300–500 pips
SELL GOLD: 4103 – 4105
Stop Loss: 4115
Take Profit: 100–300–500 pips

GOLD → Consolidation while awaiting the driverFX:XAUUSD is consolidating after a sharp decline. Bulls are consolidating above 4050. Important US data is ahead, including the employment report (NFP) on Thursday.
Decrease in bets on Fed easing: The probability of a cut in December has fallen to 46% (from 67% a week ago) after cautious statements by Fed officials. However, we have not yet seen inflation and employment data, so the situation may change... The September NFP report will be released on Thursday after a 43-day hiatus.
The market is waiting for clarity from the US data. Weak indicators (NFP, inflation) could bring back interest in gold, while strong data would strengthen the dollar and reinforce the correction.
Gold is in the $4030–4100 range. A break above $4100 will require weak US data or unexpectedly dovish rhetoric from the Fed. The $4030–4045 level is key support.
Resistance levels: 4097, 4110
Support levels: 4071, 4046, 4032
I think the market may remain in the current range while awaiting economic data or other drivers. A correction to support may form from resistance. It is important to monitor the levels from below; if the bulls keep the price above support during the correction, gold will be able to strengthen...
Best regards, R. Linda!

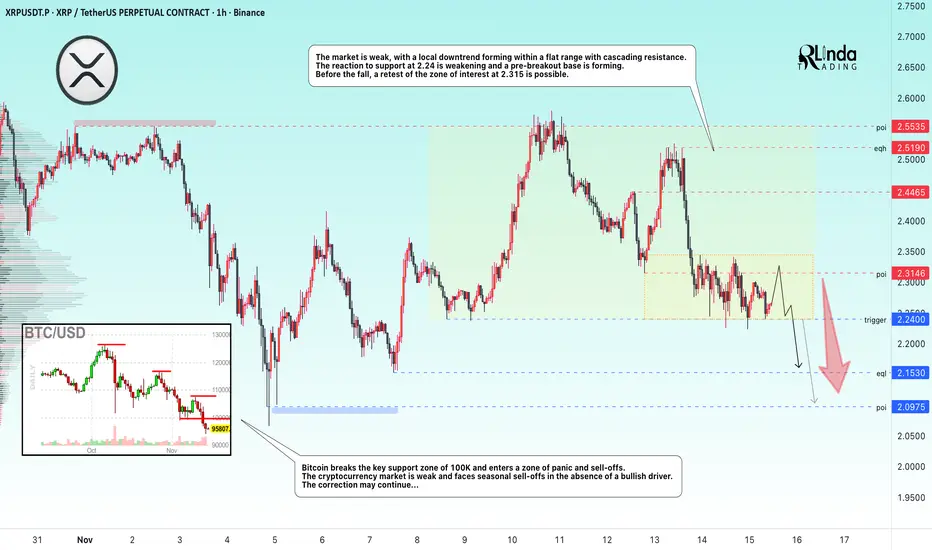
XRPUSDT → Consolidation before breaking through support BINANCE:XRPUSDT continues to storm the 2.24 support level amid a downtrend and a weak market. There is no bullish driver, and the fundamental background is also weak...
Bitcoin breaks through the key support zone of 100K and enters a zone of panic and sell-offs. The cryptocurrency market is weak and facing seasonal sell-offs in the absence of a bullish driver. The correction may continue...
XRP is forming a local downtrend with cascading resistance within a flat. The reaction to the 2.24 support is weakening and a pre-breakout base is forming. Before the fall, a retest of the 2.315 zone of interest is possible.
Resistance levels: 2.315, 2.4465
Support levels: 2.24, 2.153, 2.097
A false breakout of 2.3146 could trigger a further decline, but a close below 2.153 could trigger a sell-off and a subsequent decline to the 2.153-2.097 zone.
Best regards, R. Linda!
$BTC Halfway to Confirming Bear Market - BUT There's HOPE!BAD NEWS ⚠️
₿ITCOIN IS HALFWAY THERE TO CONFIRMING A NEW BEAR MARKET.
🚨 This is the first-time that CRYPTOCAP:BTC has closed below the 50WMA since Dec ’21. We all know what happened after that.
🚨 If we get another consecutive Weekly close below the 50WMA, I am confident this is the beginning of the end for the bull market.
If that happens, I will discuss my new exit strategy and POI in another post.
GOOD NEWS 🙌
⚡️ The long-awaited DEATH CROSS on the Daily Chart has occurred, which historically marks the bottom.
⚡️ PA is sitting at VERY strong support on the .618 Fib
⚡️ RSI is LOWER than the Liberation Day madness Feb - April ’25, and the lowest it’s been since July ’22.
NOTE: This is the smallest correction we’ve had all bull market.
TL;DR 📖
✅ This is the absolute best time to buy CRYPTOCAP:BTC
✅ Just make sure to follow the 50WMA invalidation if you do take a position.
Remember, we have the most insanely bullish macro / regulatory backdrop in crypto’s entire existence.
MY THOUGHTS 🤓
🐂 I truly believe this is the biggest fake-out we’ve ever seen. There’s way too many tailwinds on the horizon to let this go to waste.
🐂 Bulls need a $10k Mega-Candle THIS WEEK to reclaim momentum.
🐂 I’m still a MEGA-BULL until my thesis is invalidated.
⛔️ We could get one last flush ~$92k to grab CME Gap liquidity.
🛑 DO NOT USE LEVERAGE EVER AGAIN!!!

BTC/USDT 1H Short-Term (maintaining support)📉 MARKET STRUCTURE
1. Trend
The chart shows a clear falling wedge, which statistically is a pro-growth pattern—breakouts most often occur upwards.
Upper wedge line: ~96,400 USDT
Lower wedge line: ~93,750 USDT
The price has just rebounded from the lower edge—this is a key demand level.
📊 SUPPORT AND RESISTANCE LEVELS
Support (demand):
93,750 – lower wedge line
93,300 – strong chart level
92,650 – lower support, strong volume reaction
Resistance (supply):
95,000 – 95,450 – local resistance (supply often returns here)
96,400 – resistance key + upper wedge line
📈 INDICATORS
Stoch RSI (1h)
We have rebounded from the oversold level.
The %K line is breaking the %D line upwards → a signal of a potential short-term rebound.
MACD
The histogram is decreasing, but the first signs of flattening are visible.
The MACD line is still below the signal line, but is approaching → momentum for a reversal is beginning.
Volume
Volume increased on bearish candles, but near the bottom, two demand candles with increased volume appeared → buyers reacted at support.
📌 CONCLUSIONS
✔️ Bullish short-term scenario (more likely at this point):
Bounce from 93,750 + rising indicators = local upward correction.
Targets:
94,800 – 95,000
95,450
96,400 (upper band of the wedge — an important decision point)
❌ Bearish scenario (if support breaks):
A drop below 93,750 on strong volume opens the door to:
93,300
92,650 (a large defensive level — aggressive demand could enter here)
