BTC/USDT 1H Chart Short-Term📉 Descending Channel (black lines)
The price previously moved within a clear descending channel, which was broken upward.
A breakout from the channel signals a change in the short-term trend – from supply pressure to an attempted rebound.
From a technical perspective, a breakout from a descending channel often leads to an upward correction, the extent of which is at least the midpoint of the previous downward impulse.
🔷 Triangle Formation (blue lines)
After breaking out of the channel, the price formed a symmetrical triangle (consolidation) – a sign of market indecision.
Triangles of this type are often trend continuation patterns, but in this context – after a breakout from a descending channel – an upward breakout (i.e., a further upward rebound) is more likely.
The key resistance level to watch is $111,145 – a breakout with volume confirmation would open the way to $112,320 and then $113,921.
🧭 Key Technical Levels
Resistance:
$111,145 – local resistance (upper boundary of the consolidation/triangle).
$112,320 – another strong resistance level from the previous local high.
$113,921 – major medium-term resistance.
Support:
$110,442 – lower boundary of the triangle (short-term support).
$108,793 – support after the recent bounce.
$107,285 – next demand level.
$104,969 – bulls' defensive boundary in the broader context.
📊 Stoch RSI (bottom of the chart)
The Stoch RSI oscillator is currently in a rebound phase from the neutral level (~40–60).
If the lines (blue and orange) cross upwards and enter the zone above 80, this could confirm bullish momentum and a breakout from the triangle to the upside.
However, a rejection from 60 and a further drop below 20 would signal a false breakout and a possible retest of USD 108,800.
🔎 Scenario Summary
➡️ Upside Scenario (more likely):
Breakout from the triangle to the upside (confirmed by a 1-hour candle above USD 111,150).
Potential move to USD 112,300 → USD 113,900.
Momentum indicators support a rebound if the Stoch RSI maintains its upward trend.
⬇️ Downside scenario (alternative):
Unsuccessful breakout and return below $110,400.
A correction to $108,800 can then be expected, and if this level is broken, a further decline to $107,300.
Fibonacci Retracement

GOLD → Consolidation. The fundamental backdrop is changing...FX:XAUUSD stabilizes after a week-long decline, failing to consolidate above $4050. The market is taking a pause before new impulses. Focus on 4030 and 3980...
Investors are closing positions before the end of the week and month, the reason being the uncertainty surrounding the deal with China and Powell's less dovish stance on policy: a 25 bp rate cut is already priced in. The probability of a December cut has fallen to 72.8% (from 91.1% a week ago). Powell emphasized that decisions depend on data, which is not available due to the shutdown.
The strong dollar (2-month highs) is putting pressure on gold. Weak data from China (PMI fell to 49.0) is reducing demand from the largest consumer.
The balance is tipping towards weak fundamentals...
Resistance levels: 4030, 4085
Support levels: 3982, 3955, 3915
Technically, bears are keeping the market below 4030 - strong resistance. If buyers enter the market (there are currently no fundamental reasons for this) and the bulls are able to break through 4030 and keep the price above this level, we will have a chance for growth. But under the current circumstances, I expect a correction to support before a possible rise.
Best regards, R. Linda!

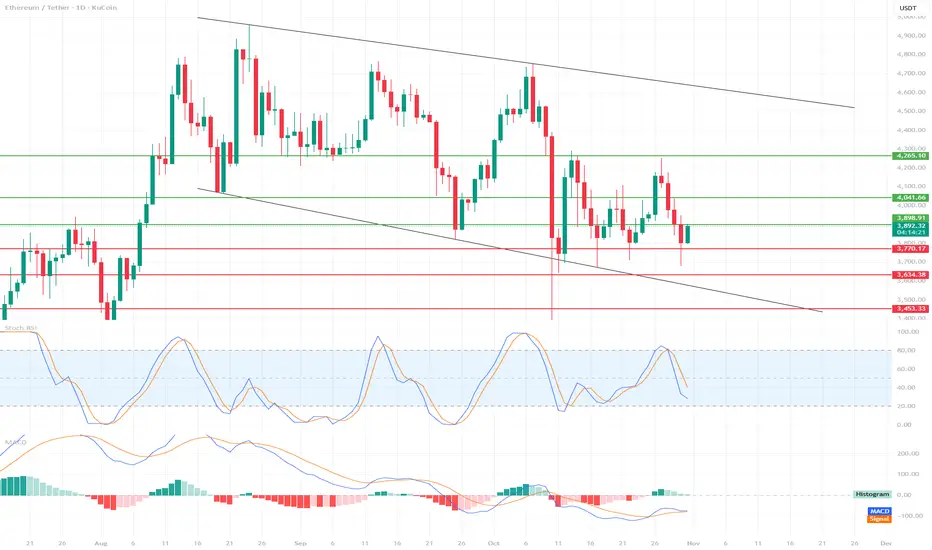
ETH Tests Support – Is This the Beginning of a Rebound?📉 Market Structure
We see a descending channel, bounded by two black trend lines.
Upper Boundary: ~$4,700
Lower Boundary: currently around $3,700, representing strong dynamic support.
The price is currently hovering slightly above the lower edge of the channel, suggesting a possible rebound, but the market remains in a medium-term downtrend.
🔍 Support and Resistance Levels
Support:
$3,770 → currently being tested, crucial in the short term.
$3,643 → next strong support from previous lows.
$3,453 → last line of defense against a steeper decline.
Resistance:
$3,889 → closest resistance, current local ceiling.
$4,041 → strong resistance resulting from prior consolidation.
USD 4.265 → a line that, if broken, could signal a change in the medium-term trend.
📊 Technical Indicators
Stochastic RSI
Located near the oversold zone (below 20), with a slight upward curve.
🔹 Signal: Potential upside move (bounce) in the short term if the %K and %D lines cross upward.
MACD
The MACD line is slightly below zero, but is starting to curve upward and may soon cross the signal line.
🔹 The histogram is starting to decline on the negative side – this is often an early bullish signal (possible change in momentum).
⚖️ Scenarios
🔹 Bullish
If ETH holds above USD 3,770 and the Stoch RSI confirms the rebound, a possible move towards:
3,889 → USD 4,041 → USD 4,265.
A break above USD 4,265 could open the way to USD 4,500+ (upper band of the channel).
🔻 Bearish
Loss of support at USD 3,770 → a signal of weakness.
Then the next downside targets:
USD 3,643, then USD 3,453.
If USD 3,453 breaks, possible tests of the lower band of the channel – even around USD 3,300.
🧭 Summary
Main trend: downward (descending channel).
Short-term bias: neutral-bullish (potential for a rebound from support).
Key level to watch: USD 3,770 – maintaining this level could trigger a rebound, loss = risk of a steeper decline.
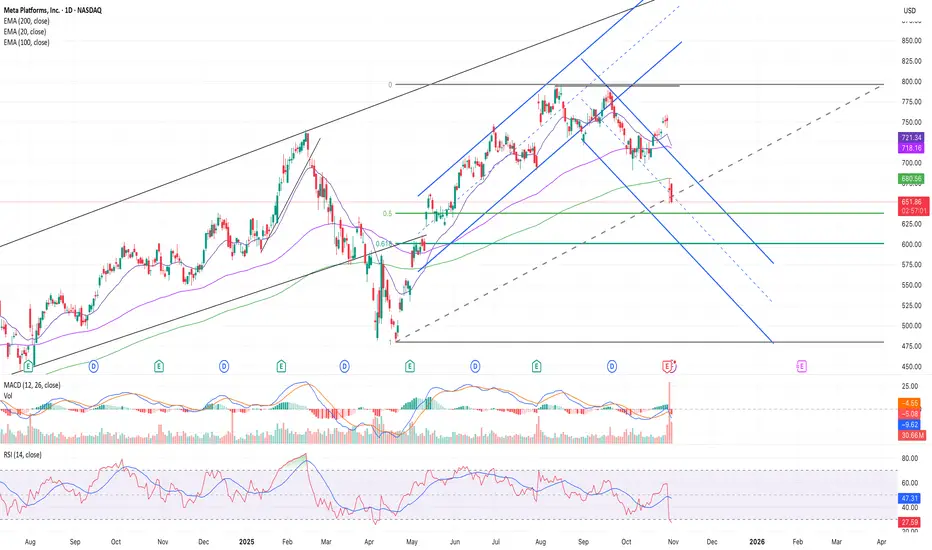
META | Descending Channel & 0.618 Fib SupportMETA is trading inside a descending channel after breaking its main uptrend. Price recently rejected the upper boundary with strong sell volume and a bearish MACD crossover, showing short-term weakness.
The 0.5 Fibonacci level is acting as current support — if price breaks below this, expect a retrace toward the 0.618 Fib zone ($400–$405) which aligns with key channel support. Holding this level could trigger a rebound toward $450–$470, but a close below $400 opens the door to $380–$360.
RSI is near oversold, suggesting a potential bounce if the 0.618 level holds. Medium-term correction within a larger bullish structure.
USDJPY → Attempt to break through trend resistance FX:USDJPY breaks through the resistance of the bullish pattern and attempts to remain in the long zone. There is a possibility of price growth against the backdrop of the dollar's rise following Powell's speech.
The dollar is recovering after the Fed meeting, and against this backdrop, the Japanese yen is losing ground, breaking through resistance at 153.23. The currency pair is trying to capitalize on the chance for growth.
The Japanese yen is forming a breakout of the resistance of a bullish pattern: an ascending triangle + consolidation on a bullish trend.
If buyers keep the price above 153.23, the market will have a chance to grow to 154.7.
Resistance levels: 153.23, 154.7
Support levels: 151.85, 152.37
On D1, the currency pair is trying to overcome the resistance of a multi-month downward correction. Locally, on H1, there is a breakout of the bullish pattern structure, which indicates interest from buyers. The chances of growth from 153 will appear if the price consolidates above the specified level.
Best regards, R. Linda!

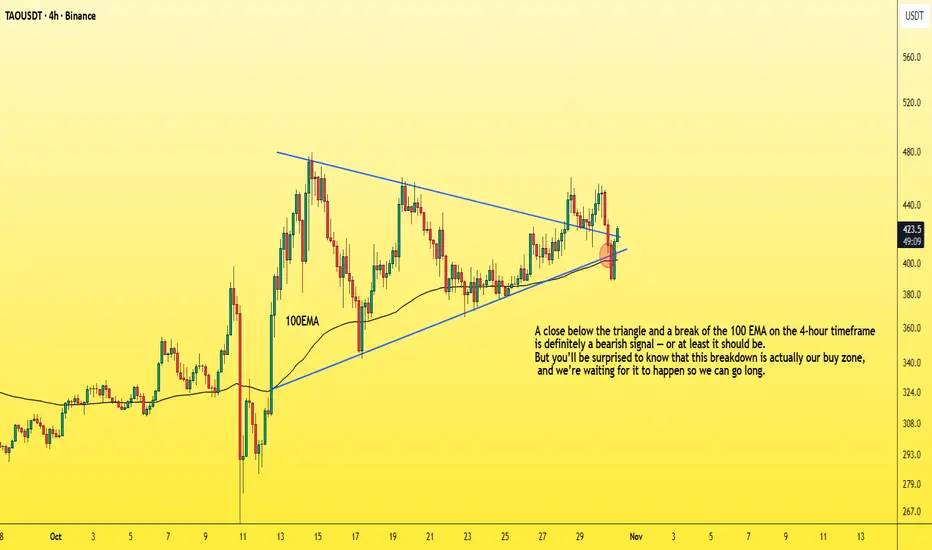
How to enter a successful futures tradeDrop everything and let me show you how to enter a successful long position with the lowest possible risk.
You need to understand that the market maker usually acts against us at major support areas on the chart — like the 100 EMA, 0.618 Fibonacci level, or a trendline.
To make this clearer, let’s take TAO as an example and I’ll explain why.
TAO has strong momentum and a large market cap,
so don’t apply what I’m about to say to meme coins, for example.
Now let’s go step by step on how to enter a futures position after choosing the coin 👇
1. First, wait for a bullish pattern to form — like a triangle — and for the coin to break it upwards with increasing long momentum.
2. The price will then retest the trendline, encouraging people to enter with larger positions, and those who missed the first breakout will likely place buy orders at the retest zone.
3. Then, the market surprises them — it drops back inside the triangle, giving a small bounce at the lower side.
4. But it doesn’t stop there — it continues dropping, breaking below the triangle and closing below the 100 EMA on the 4-hour chart.
This makes you panic and close your long position.
Others start entering shorts thinking it’s a real breakdown.
5. That’s when the market reverses sharply upward,
trapping short traders in losses,
while long traders who exited too early also lose.
In the end, only those who placed buy orders slightly below the strong support level (not directly on it, like under the 100 EMA) — and of course the market maker — end up winning.
So basically, the long traders lose, the short traders lose,
and only a small percentage of smart traders and the market maker win.
Small things to pay attention to 👇
-Your entry point should be slightly below the support, not too far below it.
(That support could be the 100 EMA, below the triangle pattern, or the 0.618 Fibonacci level, as we mentioned.)
-Don’t use high leverage — x5 should be your maximum.
-Place your stop loss 5% below your entry zone,
which equals about 25% loss if you’re using x5 leverage.
And with that, you’ve got yourself a long setup with over a 90% success rate,
and you can apply the same logic in reverse when taking a short position.
Best Regards:
Ceciliones🎯
BTC/USD 1D Chart📉 Trend Structure
Bitcoin is currently in a medium-term downtrend, as evidenced by the descending channel (black trend lines).
Each bounce from the upper edge of the channel has ended in a decline, and recent tests of the lower boundary suggest that the market is respecting this channel as a primary structure.
⚙️ Key Technical Levels
Resistance (green lines):
$123,345 – strong resistance from the previous high and the channel breakout boundary.
$115,179 – local resistance that has been tested several times and rejected.
Support (red lines):
$107,482 – currently tested support level; breaking it could strengthen supply pressure.
$104,929 – next strong support level near the local lows from September.
USD 98,841 – critical support – lower channel zone, potential capitulation or rebound zone.
📊 Volume
Volume is increasing on the declines, suggesting that the current downward move is supported by seller activity.
No significant accumulation volume at the lows – the bulls have not yet taken control.
🔄 Stoch RSI Oscillator
The Stoch RSI is approaching the oversold zone (around 20), but has not yet reached it.
If the %K and %D lines extend below 20 and then cross upward, this will signal a potential technical rebound.
For now, momentum is negative (bearish).
🧭 Scenarios
🟥 Bearish Scenario (more likely at this point)
A breakout of the $106,000 level opens the way to $104,900 and then $98,800.
Continuing the downward movement within the downward channel could lead to the lower edge of the channel around $100,000 in November.
🟩 Bullish Scenario (Bounce)
Defending the $106,000 level and a positive signal from the Stoch RSI could lead to a bounce around $115,000.
Only a breakout of the upper edge of the channel (~117,000–118,000) with volume confirmation would signal a trend reversal.
⚠️ Summary
Trend: Downtrend (descending channel)
Momentum: Bearish
Key level to watch: USD 106,000
Potential rebound area: USD 104,900 – USD 98,800
Stoch RSI: Near oversold → possible short-term rebound

GOLD → Price stuck in range after Fed speech FX:XAUUSD continues to battle for the $4,000 zone. The fundamental backdrop has a hint of unpredictability following the Fed's statement. Technically, the range of 3,915-4,015 is developing
Key factors: US shutdown (4th week): Weighs on the economy and the dollar, supporting gold as a safe haven. However, the Fed toughened its tone yesterday: It cut rates by 25 basis points, but Powell ruled out guarantees for a cut in December. Trump and Xi meeting: Agreements reached on soybeans and rare earths, reducing demand for defensive assets.
Gold balances between shutdown risks and monetary policy tightening. Growth is only possible if macro statistics deteriorate or geopolitics escalate.
Resistance levels: 4015 - 4050
Support levels: 3980 - 3960 - 3915
Gold may continue its correction from the 4015 - 4050 zone to 3950 - 3900 if the bulls are unable to keep the price within the upper range. However, if the market continues to buy the metal (there are no fundamental reasons for this yet) and the price closes above 4015, there may be a chance for growth to 4050 - 4085.
Best regards, R. Linda!

BCHUSDT → Consolidation ahead of news. Target 600?BINANCE:BCHUSDT.P is consolidating above key resistance. Consolidation is forming ahead of news. Are the bulls in play?
Bitcoin is consolidating, trading above key support at 111650. News ahead, a positive outcome could support the market, including altcoins...
As for BCHUSDT, the coin is breaking through the strong resistance zone of 549.15 as part of a bullish trend and is forming consolidation in the range of 549-570. A liquidity pool has formed below 549. There is a high probability of a long squeeze before growth.
Resistance levels: 570, 600, 612
Support levels: 549.15, 533, 511.25
The market is bullish, which is clearly visible on the D1 timeframe. After a strong rally, the coin is entering a consolidation phase, which is forming above the previously broken resistance. A retest of support could trigger growth in the direction of the trend.
Best regards, R. Linda!

ETH/USDT 1W🔹 Overall Trend
We are still in an uptrend (trend line maintained from the March low).
However, momentum is weakening—a series of lower highs is forming, suggesting a local correction within the main trend.
🔹 Key Technical Levels
🟢 Resistance:
4,179 USDT – the current level that the price is testing as resistance.
4,407 USDT – the next strong resistance, where previous rejections occurred.
4,877 USDT – the main resistance resulting from the August highs.
🔴 Support:
3,916 USDT – almost identical to the above (demand zone).
3,561 USDT – key structural support; loss of this level = possible trend change.
🔹 Formation and Structure
The current pattern could form a potential ascending triangle, with the trendline (black) connecting the lows and the horizontal resistance lines marking the upper boundary of the consolidation.
If a breakout occurs above 4,180–4,400, a move to 4,800+ is possible.
However, if we break the trendline and 3,900, a move to 3,560–3,400 could occur, or even a test of 3,000 with significant selling pressure.
🔹 Volume
Volume is decreasing during consolidation → typical of an accumulation or distribution phase.
No clear breakout signal – the market is waiting for a trigger (e.g., macroeconomic data, ETFs, news about ETH 2.0).
🔹 Stochastic RSI (Bottom of the chart)
Located in the oversold zone (<20).
The %K line (blue) is attempting to cross the %D line (orange) from below – a signal of an early rebound.
If confirmed next week, a local rebound from the 3,900–4,000 zone could occur.
🔹 Scenarios:
✅ Bullish:
Breakout from the trendline + breakout above 4,180 → target 4,400, then 4,880.
Confirmation by increasing volume and the Stoch RSI emerging from oversold territory.
❌ Bearish:
Breakout of the trendline and 3,900 → target 3,560, then 3,200.
Increasing downward volume + no bullish reaction at the support levels.

GOLD → The market is testing 4K ahead of the Fed's decision FX:XAUUSD is testing $4,000 ahead of the Fed's decision, partially recovering from a 3.5% drop this week. The fundamental backdrop is mixed, but technically, the signs of a bull market are positive.
Key factors : Fed decision (today): A 25 bps rate cut is expected, but the main focus is on the vote count and Powell's comments.
A dovish scenario (emphasis on risks to the labor market) will support gold. A hawkish surprise will reinforce the correction. Trump-Xi meeting (tomorrow): Statements about lowering tariffs weaken demand for defensive assets.
Gold is in limbo; in the second half of the European session and the beginning of the US session, the market may enter a phase of stagnation. Growth is only likely if the Fed takes a soft tone, while progress in trade negotiations or a hawkish surprise from the Fed will prolong the correction.
Resistance levels: 4015, 4050, 4085
Support levels: 3975, 3945, 3900
If the bulls can hold their ground above 4K, we will see strong support, in which case growth to 4050-4100 may be triggered. Otherwise, the market may form a correction to 3975-3945. It is worth keeping an eye on comments from Powell and Trump... Volatility will be high...
Best regards, R. Linda!

GOLD → Sell-off due to uncertainty FX:XAUUSD is falling, the trend is downward, and we have confirmation of this. Profit-taking is leading to a decline, which is causing buyers to exit the market...
Caution ahead of the Fed: Markets are pricing in a 25 bp rate cut, but the main thing is the tone of the statement and Powell's comments on further steps. The USD is not ready to continue its growth and is starting to look downwards. The US government shutdown continues, adding uncertainty, which supports gold.
However, an important issue is the trade deal between the US and China; a positive outcome could put pressure on gold.
Gold is balancing between hopes for a trade truce and risks from Fed policy.
Support levels: 3895, 3820
Resistance levels: 3943, 3975, 4015
Since the opening of the session, the price has fallen by 2.3%, which is an intraday range. The 3900-3895 area may see a reaction in the form of a false breakdown and a correction to the imbalance zone before a possible further decline.
Best regards, R. Linda!

AUDUSD → Attempt to reverse the trend to bullish FX:AUDUSD is forming a correction after breaking through the resistance of the downward channel. The market needs a trading range or consolidation above 0.6526.
The dollar is consolidating but is not ready to continue growing. Pressure on the currency is emerging ahead of the Fed meeting. This may support the growth of the Australian dollar.
The currency pair is entering a distribution phase after consolidation. The breakout of 0.6526 triggered a break of the downward channel resistance. An attempt to change the trend is forming. If the bulls keep the price above 0.6526, this could trigger further growth.
Resistance levels: 0.6567, 0.661
Support levels: 0.6526, 0.6493
At the moment, an attempt to change the trend has been initiated. Consolidation and distribution are a good sign, but above the previously broken trend line, a trading range should form, which will confirm the fact of a change in the local trend.
Best regards, R. Linda!

$GOLD is COOKED! Rotation into $BTC Soon!!MARKETS ARE SIGNALING RISK-ON 🔥
TVC:GOLD is so unbelievably COOKED 👨🍳
3 Black Crowes printed on the Daily, with a decisive close below the 20MA 🗡️
Waiting on the final nail in the coffin to close below the DANGER ZONE ~$3,900 where we will then see GOLD retest the 50MA along with the 50% Gann retrace $~3,750 ⚠️
I very much expect the rotation into CRYPTOCAP:BTC soon 👑

Fibonacci Beyond the ObviousFibonacci Beyond the Obvious
The Professional Approach — WerkTrader Edition 🎯
1️⃣ Introduction – More Than Just a Sequence
Fibonacci is not magic, myth, or a decorative tool for colorful charts.
It is a mathematical ratio that appears in nature, architecture, music – and yes, in markets.
If you only know Fibonacci as the 61.8 retracement, you understand the concept,
but not the depth.
A true analyst doesn’t use Fibonacci to draw lines –
he uses it to measure structure,
to see where the market stands in relation to itself.
2️⃣ The Principle of Self-Similarity
Markets are fractal.
They move in repeating proportions, regardless of timeframe.
A 38.2 pullback on the 15-minute chart can have the same character
as a 61.8 retracement on the daily.
Professionals call this Fractal Alignment –
multiple timeframes reacting to the same ratio,
and that’s exactly where the decisive moves occur.
3️⃣ Fibonacci Timing – The Invisible Factor
Most traders measure price, not time.
But Fibonacci also works horizontally.
13, 21, 34, 55 – not as price levels,
but as candle intervals between significant highs and lows.
These Fibonacci Time Projections reveal
when market cycles overlap –
often the moment before price reacts to a known zone.
Institutional models use this quietly,
while retail traders almost always overlook it.
4️⃣ Fibonacci in Orderflow
Fibonacci zones are not magical support lines –
they are points of liquidity interaction.
At 61.8 %, three groups often collide:
1️⃣ Retail shorts fading the retracement,
2️⃣ Smart-money algorithms collecting liquidity,
3️⃣ Position builders using the pullback for entry.
Fibonacci is not a signal – it’s a trigger area,
a place where energy releases.
5️⃣ Asymmetry and Precision
The famous ratio φ ≈ 1.618 is mathematically perfect,
but markets are not.
A professional observes the deviation from the ideal –
often just 1–2 %.
Those small over- or undershoots reveal who dominates:
reaction or manipulation.
This is called Fibonacci Deviation Bias –
a subtle detail that shows whether a zone was merely tested
or truly broken.
6️⃣ Cluster Theory – The Art of Overlap
A single level is coincidence.
But when multiple retracements or extensions
align within the same price area,
a cluster is formed.
This overlap of different swings is called Confluence.
The more Fibonacci relationships converge,
the stronger the reaction.
A professional doesn’t look for the “perfect number” –
he looks for the connection of proportions.
Mathematics confirms itself where ratios intersect.
7️⃣ Fibonacci & Harmonic Patterns – Geometry of Confirmation
Harmonic patterns are the advanced geometry of Fibonacci relationships.
They consist of several precisely measured retracements and extensions,
forming a geometric reversal structure –
like the Gartley, Bat, Butterfly, or Crab.
Each one is built on the same base ratios:
XA → AB = 61.8 %,
BC = 38.2–88.6 %,
CD = 127–161.8 %.
When these measurements meet at a single point,
they create the PRZ (Potential Reversal Zone) –
the mathematical intersection between order and chaos.
The more Fibonacci connections overlap,
the stronger the confirmation.
That’s not coincidence – that’s confluence in its purest form.
8️⃣ Fibonacci as a Language
Fibonacci is not a strategy – it’s a language of proportion.
It doesn’t tell you where to buy,
it tells you where to listen.
The market doesn’t speak in words,
it speaks in ratios.
Those who understand them see structure
where others see only lines.
9️⃣ Conclusion – The Silence of Numbers
Fibonacci is not a myth.
It is the quietest form of truth in the market.
Numbers themselves do not speak –
but they show you where the market reacts,
where mathematics meets psychology,
and where patience becomes power.
Fewer lines.
More meaning.
This is Fibonacci – beyond the obvious.
WerkTrader 🎯

XRP/USDT 1D Chart Review🔹 1. General Trend
A long-term downtrend is visible, confirmed by the descending trendline connecting the peaks (black diagonal line).
The price continues to respect this trend, and the current rebound looks like a test of this line from below.
🔹 2. Key Levels
✅ Resistance:
2.77–2.80 USDT – current strong resistance (being tested now, with the price trying to break through it).
→ This is the confluence zone: downtrendline + horizontal level.
2.85–2.86 USDT – next resistance (previous local high).
3.12 USDT – main weekly resistance, where the last major downward wave began.
✅ Support:
2.48 USDT – key daily support from which the market rebounded.
2.13 USDT – lower support that halted the earlier crash (large wick).
🔹 3. Stochastic RSI
Currently in the overbought zone (80–100), and the %K and %D lines are close to crossing.
→ This signals that upward momentum may be weakening – a local correction or consolidation is possible.
🔹 4. Scenarios
🟢 Bullish (breakout of resistance 2.77–2.80)
A confirmed breakout and close of the candle above 2.80 USDT will signal a continuation of the move to:
🎯 2.85–2.86 (first target)
🎯 3.12 (second target)
🔴 Bearish (rejection of resistance)
If the daily candle closes below 2.65 USDT, a possible pullback to:
🎯 2.48 (key support)
🎯 2.13 (deeper retest)

DXY Approaching 98.900 — Weak Labor Market Could Push Fed DovishHey Traders, in today’s trading session we’re monitoring DXY for a potential selling opportunity around the 98.900 zone.
The index continues to trade within a descending channel and is currently in a correction phase, approaching the upper boundary near 98.900, which aligns with channel resistance.
Fundamentals: Recent data continues to show signs of a weakening U.S. labor market, with job growth slowing and unemployment ticking higher. This softening backdrop increases pressure on the Federal Reserve to adopt a more dovish stance in upcoming meetings, potentially weighing further on the dollar.
Next move: Watching for bearish confirmations around the 98.900 zone — rejection here could resume the broader downtrend.
💬 What’s your outlook on the Fed’s next move? Drop your thoughts in the comments!

Is Nasdaq Set for a Pullback? | Fibonacci Resistance Zone ahead!In this video I map out the idea of the Nasdaq being over extended and on route to approaching a key Fibonacci resistance level 27000 ,
This may set up a potential correction in the week ahead."
This is a counter-trend setup within a larger uptrend, so risk management is key. I'm not calling a top to the entire rally, but rather a healthy pullback to bring in new buyers."
I demonstrate how i see the price action moving forward over the course of the month ahead with valuable insights.
Tools used in this video Standard Fib , Fib Expansion, Fib extension + Anchored vwap and Volume profile and TPO chart

GOLD → A psychologically important level of $4,000 lies aheadFX:XAUUSD continues to correct, unable to consolidate above $4,100, with the 4K mark ahead. Pressure is intensifying due to hopes for a trade deal between the US and China, as well as profit-taking ahead of the Fed's decision on interest rates...
Key factors:
Progress in trade negotiations: the US has withdrawn the threat of 100% tariffs, and China may support the situation. Thursday's meeting between Trump and Xi Jinping increases the chances of a deal.
Bets on two rate cuts in 2024 are almost fully priced in. US inflation (3% y/y) was lower than forecast (3.1%), but did not change expectations.
The correction may continue if the positive backdrop for the trade deal remains. The Fed's decision on Wednesday will be a key catalyst.
Technically, the 4K zone is ahead, and it is too early to talk about a break of this support, as we do not know how the market will react. However, at the moment, the price is in the range of 4000-4163, and from a technical analysis point of view, it is logical to consider a false breakdown and a pullback.
Support levels: 4000, 3975, 3944
Resistance levels: 4060, 4090, 4163
As part of the decline, the market may test one of the specified zones: 4000, 3975, 3944. However, since a liquidity pool has formed below 4K, the reaction to the psychological support level may be aggressive. It is important to monitor the situation, as closing below 4K and consolidating below a strong level could trigger a further decline. Otherwise, if the bulls manage to hold their ground above 4K and bring the price back above 4050, the market may have a chance to grow.
Best regards, R. Linda!

XRPUSDT → Pre-breakout base. Are the bulls back?BINANCE:XRPUSDT is attempting to break through the resistance of the trading range as part of a bullish run across the entire market. There is a chance that a breakthrough could form after a pullback...
The market is gradually buying back the liquidation that occurred on October 10. Bitcoin is breaking the structure, which indicates a possible return of the bulls. This sets a positive tone for the cryptocurrency market.
XRP is testing resistance and entering a consolidation phase. The trigger that could provoke growth is 2.661. However, as part of the consolidation, the market may test support before growth in order to hunt for liquidity.
Resistance levels: 2.661, 2.739
Support levels: 2.587, 2.547, 2.500
Since the opening of the session, the market has formed a fairly strong momentum, and at the beginning of the European trading session, a correction may form before the growth continues. As part of the correction, XRP may form a pullback to 2.587 - 2.500.
Best regards, R. Linda!

GOLD → Technical analysis of the current situation FX:XAUUSD is consolidating, and the daily market behavior pattern is not particularly positive, but it does have bullish implications. Market sentiment largely depends on the fundamental background
This week, the Fed is expected to hold a meeting on interest rates, where it will most likely decide to lower them, which could generally support the dollar (but this news is most likely already priced in). Accordingly, the rest depends on decisions regarding the shutdown, trade war, and inflation. The resolution of the first two issues may weaken the price.
As for the technical side, since the price is currently within the trading range, it is worth considering trading within these limits first. However, a breakout and closing above/below one of the key levels: 4060 - 4150 could trigger further movement in the direction of the breakout, which in turn could push the price into another (bearish or bullish) trading range. Below, there is the 4000 zone, and there is a possibility of a retest of this area, with a potentially aggressive reaction.
Resistance levels: 4150, 4218, 4275
Support levels: 4060, 4015, 3944
While uncertainty remains, the market may continue to hold the price between 4060 and 4150. Another retest of the range boundary and the reaction to this retest will show the market's intentions for further movement.
Best regards, R. Linda!

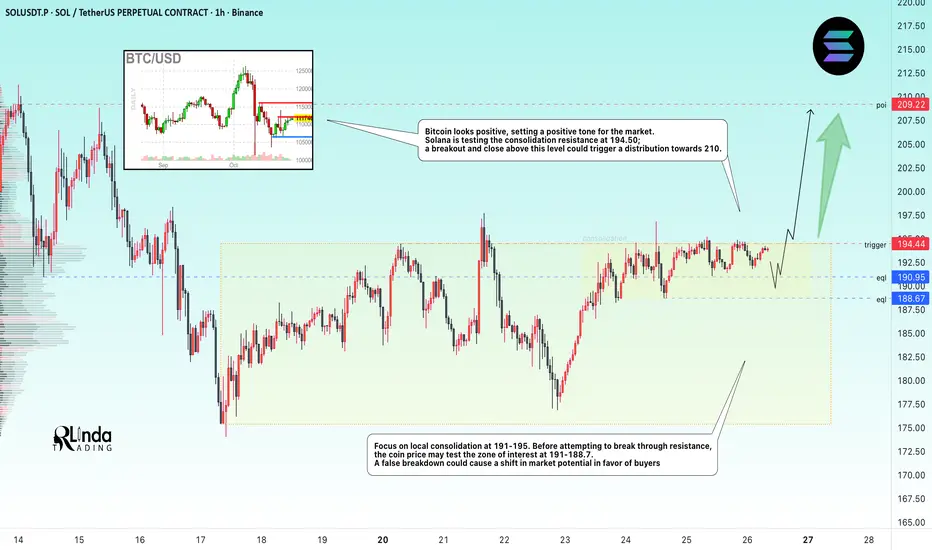
SOLANA → Consolidation before resistance. An attempt at growth?BINANCE:SOLUSDT.P is testing the resistance of the trading range, with pre-breakout consolidation forming, indicating that buyer interest in the coin is emerging.
Bitcoin looks positive, which sets a positive tone in the market. Solana is testing the resistance of consolidation at 194.50; a breakout and close above this level could trigger a distribution to 210.
Focus on local consolidation at 191-195. Before attempting to break through resistance, the coin price may test the zone of interest at 191 - 188.7. A false breakout could cause a shift in market potential in favor of the buyer, which in turn could trigger a breakout of 195 and growth.
Resistance levels: 194.5, 209
Support levels: 190.1, 188.7
A retest of resistance, consolidation after growth, and no reaction to bears are positive signs that a breakout attempt may be realized. A close above 194.5 - 195.0 would be a good sign for growth.
Sincerely, R. Linda!
$SOL Bullish Engulfing Weekly CloseSolana is looking good here 👍🏽
Reclaimed the 50WMA and closed above the 50% Gann Level.
Note the Bullish Engulfing candle for the Weekly Close.
However CRYPTOCAP:SOL Still trading within the DANGER ZONE ⚠️
Need these next couple weeks to close outside of this POI.
You can see the Liberation Day lower trendline still remains intact for support and we had the Bullish Cross a few weeks ago on the 20 / 50 WMA 🤓
