FX Professor 101: How I Start My Charts with Trendlines & FibFX Professor 101: How I Start My Charts with Trendlines & Fib Levels 🧠📈
Some of you asked me to show my charting process again — so here it is, strictly educational, using Pepper as the example (because a few of you believe in it and asked about it). Let’s build this chart together from scratch. 🛠️
Step 1: Get Full Historical Context 📜
I always start by selecting a chart with the most data available. More history = more structure to work with. No shortcuts here.
Step 2: Anchor with Horizontal Trendlines 📏
I look for a clear support → resistance → support pattern with no manipulation. That becomes my anchor level.
Then I scan for secondary levels – if they’re too close or manipulated, I keep them dotted and as references.
Zooming in helps. Don't hesitate to get granular when needed. 🔍
Step 3: Respect the Manipulation 🤨
If a chart feels overly manipulated (wicks, fakeouts, no clear rejections), I lose trust in it. But sometimes even within manipulation, valid levels emerge — and I mark them clearly.
Step 4: Fibonacci Confirmation 🔢✨
Once I place the trendlines, I overlay Fibonacci retracements to see if they align. In this case, one of my levels landed exactly on 0.618 – no cap! 😂 That’s when experience meets structure.
Final Notes 🧘♂️
• Only two levels made the final cut
• Secondary levels marked with dotted lines
• 0.618 Fib validated the primary structure
• Support at 929 is looking strong as of now
This is my process. It’s how I start every serious chart. Nothing fancy — just history, structure, and experience. If it helps even one of you out there, I’m happy. 💙
One Love,
The FXPROFESSOR 💙
Food for Trading Thought:
From my experience as an AI developer, I’ve come to one firm conclusion — AI will never replace us. It can assist, but it can’t see what you see or feel what you feel. The real edge in trading is your human intuition, patience, and discipline.
Trading is a game — a risky game. Play it right if you're going to play it at all.
Stay human and remember: the best Blockchain is YOU, the best Altcoins are your loved ones and your work/creation/purpose in life. 🎯
Fibonnacci

MPWR | Another Long Term Runner | LONGMonolithic Power Systems, Inc. designs, develops, and markets integrated power semiconductor solutions and power delivery architectures for computing and storage, automotive, industrial, communications, and consumer applications markets. It offers direct current (DC) to DC integrated circuits (ICs) that are used to convert and control voltages of various electronic systems, such as portable electronic devices, wireless LAN access points, computers and notebooks, monitors, infotainment applications, and medical equipment. The Firm also provides lighting control ICs for backlighting that are used in systems, which provide the light source for LCD panels in notebook computers, monitors, car navigation systems, and televisions, as well as for general illumination products. The company was founded by Michael R. Hsing, and James C. Moyer on August 22, 1997, and is headquartered in Kirkland, WA.

ETHUSD - 250905 - LONG - Binance - Algo Target - 1WTake Profit: $5,800 - $6,000
Likely Market Cycle Top

SOLUSDT- 250905 - LONG - Binance - Algo Target - 1WSOLUSDT- 250905 - LONG - Binance - Algo Target - 1W

LETS GIVE BTC A LITTLE BREAK SHALL WE, LET IT BOUCE A BIT, YEAH Expect a bit of bounce from this point !! Retailers have sold all their coins and now MM is gona buy back from these poor souls. BUT the end is inevitable for the ALGOS have spoken (Sorry about the messy chart guys, didn't get the time to clean it up!)

EURUSD - Is there more bearish momentum ahead?Introduction
Last Friday, the EURUSD experienced a sharp move to the upside following Jerome Powell’s speech, which fueled optimism and created strong bullish momentum. However, the market could not sustain this rally, and by yesterday all the gains were fully retraced. Price dropped back into the bullish inversion fair value gap (FVG), ultimately filling it entirely. While this retracement has cooled off the bullish pressure, it has also introduced some new dynamics into the market that traders should be aware of.
Liquidity sweep
During Friday’s impulsive rally, EURUSD swept liquidity above the recent highs and simultaneously filled all the bearish fair value gaps. This move, while initially strong, did not manage to establish a sustainable break above those highs. As a result, bearish momentum began to reappear, suggesting that the rally was more of a liquidity grab rather than the start of a prolonged bullish trend.
Bullish case scenario
The bullish scenario from here would require EURUSD to reclaim strength and invalidate the recently formed bearish 4-hour FVG. For this to happen, the pair would need a decisive 4-hour candle close above this zone, signaling renewed upside momentum. Should buyers manage to achieve this, the next logical target would be another attempt at the highs that were swept on Friday. A confirmed break above those levels would strengthen the bullish case and potentially open the path to higher price levels.
Bearish case scenario
On the other hand, the bearish scenario appears more probable if EURUSD faces rejection at the bearish 4-hour FVG. A failure to break above this area would confirm that the bearish momentum is still in play. If that occurs, price will likely seek liquidity by moving lower, potentially targeting the bullish 4-hour FVG that sits beneath the liquidity zone. This move would align with the broader bearish structure and reinforce the idea that the market remains under selling pressure despite Friday’s rally.
Final thoughts
In conclusion, EURUSD is currently at a critical juncture, with both bullish and bearish scenarios still on the table. The decisive factor will be how price reacts around the bearish 4-hour FVG. A strong close above could set the stage for a continuation to the upside, while rejection from this zone would likely lead to a liquidity grab to the downside and a revisit of lower fair value gaps. Traders should remain cautious and patient, waiting for clear confirmations before committing to a direction, as the market continues to balance between bullish hopes and bearish pressure.
-------------------------
Disclosure: I am part of Trade Nation's Influencer program and receive a monthly fee for using their TradingView charts in my analysis.
Thanks for your support. If you enjoyed this analysis, make sure to follow me so you don't miss the next one. And if you found it helpful, feel free to drop a like 👍 and leave a comment 💬, I’d love to hear your thoughts!

FETUSDT Resistance Lower High, Swing Low, Swing HigherRide The Next 2 Months of The AI Sector’s Corrections & Next Breakout, short the correction on a macro time frame ignoring the intraday noise. Take Profits & begin buying the dip, accumulating a sizable position to be long on throughout Q4.

GBPAUD Bearish Trend ContinuationDears,
This is my HTF 2RR trade idea for next week. I believe the chart is self-explanatory.
The price rejected a strong resistance after sweeping liquidity, and then the short-term uptrend has been broken, signaling a long-term downtrend continuation going forward.

EUR/USD Possible LongEUR/USD tested a key Fibonacci retracement level and is now retesting the trendline, where it has paused. The next move will depend on whether it can break through with volume and momentum, potentially targeting the key Fibonacci extension levels.

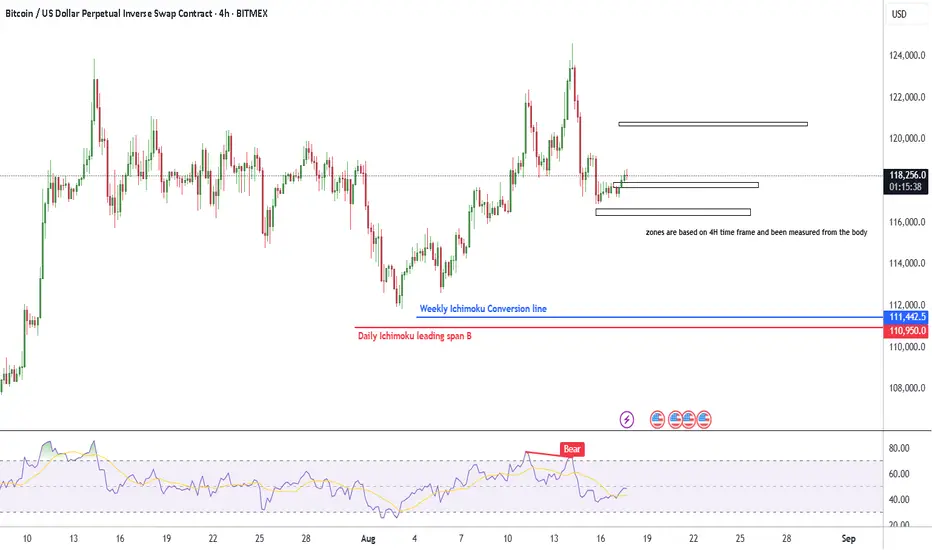
My analysis on BTC based on Fibs and IchimokuPic is self explanatory , my bet is short term short and long term long , If the price breaks through the highest zone then the possibility of retracing lower shrinks
If it fakes it , then the chances are rising
Gold Price Drops After Rally – What’s Next?Hello everyone, let's take a closer look at today's gold price
Gold has unexpectedly dropped significantly today after a notable rise early last Friday. The market's initial concerns stemmed from rumors that the U.S. would impose an import tax on gold, which caused some panic. However, after the White House officially clarified its position and assured the market, the initial worries eased
From a technical perspective, gold has broken through the upward trendline and is moving swiftly. According to Dow Theory, a short-term correction might occur soon, but if the price remains below key resistance levels, the decline could extend toward the Fibonacci 1.272 region, or even down to the Fibonacci 1.618 level if the downtrend persists.
Do you agree with this outlook? Share your thoughts in the comments below.
Good luck and happy trading!

EURUSD - Major resistance ahead with the fair value gaps!The EUR/USD pair remains firmly within a prevailing downtrend, characterized by a consistent pattern of lower highs and lower lows. This bearish momentum has resulted in the formation of several significant Fair Value Gaps (FVGs) on the 4-hour chart, which now act as potential resistance zones on any pullbacks. These FVGs not only coincide with important technical structures, but also align with key Fibonacci retracement levels, adding confluence to their strength. In the analysis below, we’ll walk through these zones and discuss the most probable scenarios based on the current price action.
First resistance zone
The first major resistance lies within the 4-hour FVG in the 1.1600 to 1.1650 region. This zone coincides with the golden pocket, which is formed between the 0.618 and 0.65 Fibonacci retracement levels. This overlap strengthens the likelihood of price reacting bearishly here, should the market manage to retrace upwards into this area. Given the strong downward momentum, this level may be enough to trigger a continuation to the downside, making it a critical area to monitor for rejection signals.
Second resistance zone
The second key resistance is found in the upper 4-hour FVG, ranging from 1.1690 to 1.1750. This zone aligns closely with the 0.786 Fibonacci retracement level and marks a former support zone that has now been broken, indicating a potential structure break. Price returning to this level would be retesting the underside of broken market structure, which often acts as a powerful resistance area. Given this, a deeper pullback into this region may serve as a trap for late buyers and potentially offer a high-probability short setup.
Bullish bounce area
On the bullish side, the most relevant support is currently found within the 1-hour FVG that was formed last Friday, during the release of the U.S. unemployment rate data. This zone is positioned below current price levels and is likely to act as a strong short-term demand area. It is reasonable to anticipate a bullish reaction from this zone if the market retraces downward, making it a favorable area to seek long opportunities for a potential move into the higher resistance levels described above.
Final thoughts
While the broader trend remains bearish, short-term bullish bounces are likely within defined fair value gaps. Traders should keep a close eye on the 1-hour FVG for possible long entries, while watching the 4-hour FVGs, particularly those aligning with key Fibonacci levels, for signs of bearish continuation. If resistance holds firm, the EUR/USD could resume its downtrend, but any structural breaks or sustained closes above these levels would challenge that view. As always, price action around these zones should guide the final decision-making.
-------------------------
Disclosure: I am part of Trade Nation's Influencer program and receive a monthly fee for using their TradingView charts in my analysis.
Thanks for your support. If you enjoyed this analysis, make sure to follow me so you don't miss the next one. And if you found it helpful, feel free to drop a like 👍 and leave a comment 💬, I’d love to hear your thoughts!

ETC 4H Analysis : V-Pattern Breakout , $23M Buy & Key Fib LevelsHey , how's it going? Come over here — Satoshi's got something for you !
⏱ We are analyzing Ethereum Classic (ETC) on the 4-hour timeframe .
👀 After breaking above the $19.1 level, Ethereum Classic started a strong and high-momentum bullish move and reached the $25.28 resistance, where it was rejected and entered a deep correction .
A V-pattern support has now formed, and a breakout of this pattern could serve as a signal for the end of the correction .
🎮 We're observing the key Fibonacci zones , drawn from the breakout level and its pullback area .
The 0 level is considered our support base , while the other Fibonacci levels act as resistances and potential long-entry triggers .
The most important upcoming resistance is at $21.16 , which serves as the main trigger for our long position .
We will now monitor whether ETC forms a higher low before reaching this resistance , or reacts to it and then forms a higher low — both scenarios would be valid setups for a long position .
As for the 0.236 Fibonacci level , it's the nearest support, and a pullback to this zone is also possible .
⚙️ The RSI oscillator previously had a key resistance at 57.78 , which has now been broken to the upside , and RSI is currently holding above this level .
🔼 Volume may increase again tomorrow during the New York session .
Today, in the marked candle , $23 million worth of Ethereum Classic was bought , and this market maker buy helped save ETC from a deeper correction .
🖥 Summary :
The breakout of the V-pattern allowed ETC to push upward and form a higher low .
Once the pullback to the identified Fibonacci zone completes , we can open our long position , or alternatively , set a buy stop at that level with a wider stop-loss to manage risk properly .
💡 Disclaimer :))) .

One Last Dip Before the Pop?On the daily timeframe, we anticipate two possible scenarios for USOIL’s movement. In the red-labeled scenario, USOIL is expected to undergo a correction to test the 63.71–64.03 area. However, in the best-case scenario, if USOIL manages to hold above 64.03, it has the potential to strengthen toward the 68.27–72.53 range.

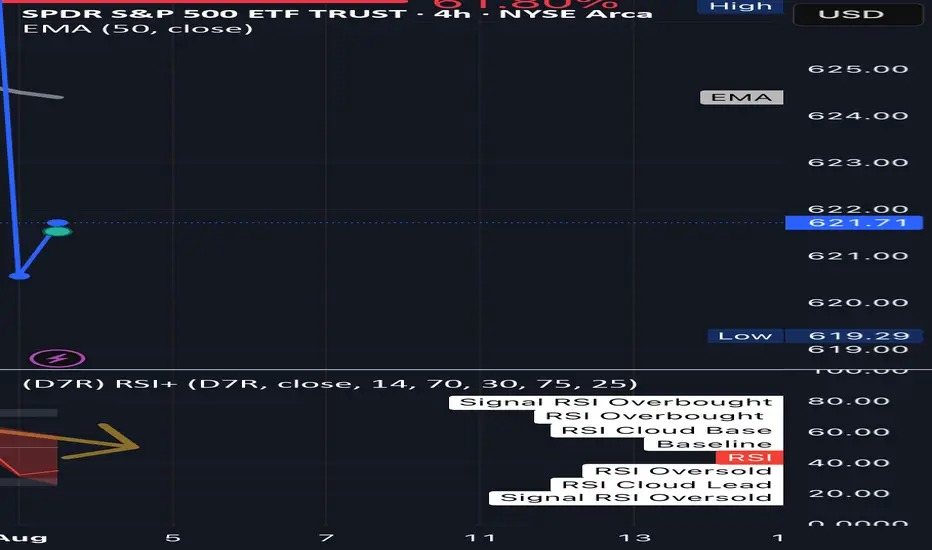
SPY 4H – Broke the Fib… Now What? Just Sharing What I See Hey People,
not an expert, just showing what i’m seeing on the 4H chart 👇
🧭 quick breakdown:
SPY ran up to around 639, then started dumping.
i dropped a fib from top to bottom and it hit the 61.8% level (626.66)… then lost it.
right now we’re sitting around 621, so it already broke a big level.
🧠 what that might mean:
if price gets back above 626, maybe we bounce back toward **629**
if not, and it keeps chilling under that **50 EMA (around 624)**, it’s probably still weak
nothing confirmed yet, i’m just watching how price moves around those spots.
⚠️ RSi is sketchy too:
rsi is making lower highs, even when price was up; that’s called bearish divergence
basically means momentum isn’t really behind the move
📉 If it keeps dropping:
if we lose 621, next support might be around **615**
and if that breaks? maybe even **610 gets swept** before any bounce
📝 Just how i’m seeing it rn:
not calling anything, just building my plan out loud
Still learning. open to feedback if you see something different
what levels are you watching?
I want everyone to win. 💛
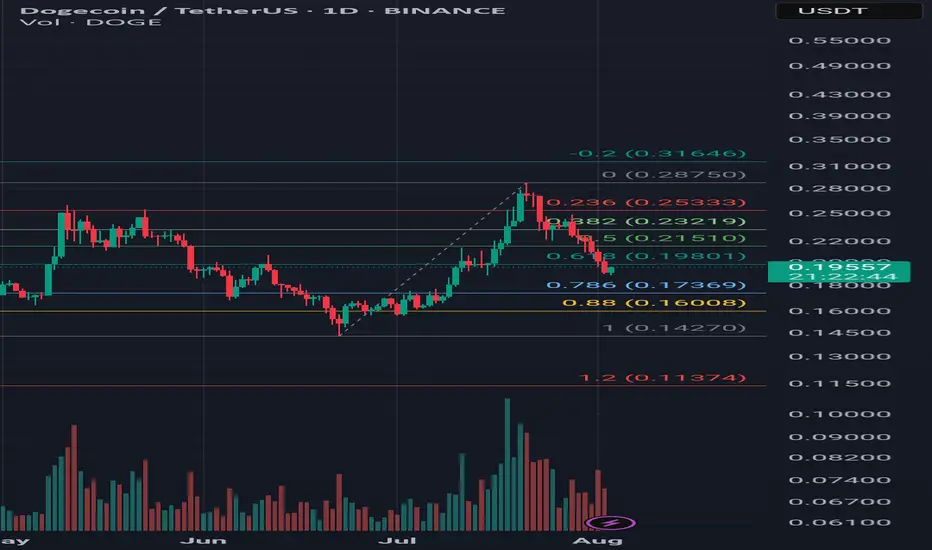
DOGE/USDT Trade Idea – Potential Cup & Handle Pattern Timeframe: Technical Analysis:
Price rallied from 0.142 to 0.287 and is currently forming the handle of a potential cup & handle pattern.
Price is sitting at the key 0.618 Fibonacci retracement level (0.198 USDT).
If this support holds and price breaks above resistance levels with strong volume, the cup & handle pattern may activate.
---
🎯 Targets:
1. First resistance: 0.215 USDT (50% Fib)
2. Second resistance: 0.232 USDT (38% Fib)
3. Key breakout level: 0.287 USDT
4. Classic pattern target: 0.432 USDT
---
🛡 Stop Loss:
Below 0.170 USDT (slightly under the 0.786 Fib & handle bottom)
---
✅ Entry Confirmation Criteria:
1. Hold above 0.198 support
2. Break and close above 0.215
3. Breakout above 0.287 with strong volume
---
💡 This analysis is for educational purposes only and is not financial advice. Always use proper risk management.
Ethereum Price Target $3,120 by Sunday?Ethereum short position Price Target $3,120 by Sunday ? Negative divergence on the hrly RSI.
Exhausted the 15 minute positive divergence when bouncing off the EMA 200 on the 1 Hour chart. First profit target is $3,350 second is $3,120. I am usually wrong with my estimations... I would recommend the opposite. So go long!

Fake Pump, Real Dump?On the daily timeframe, XAUUSD is expected to be vulnerable to a correction toward the 3253–3325 area as the minimum retracement zone to potentially form a triangle pattern. However, in the worst-case scenario, indicated by the black label, XAUUSD may experience a deeper correction toward the 3093–3191 range.

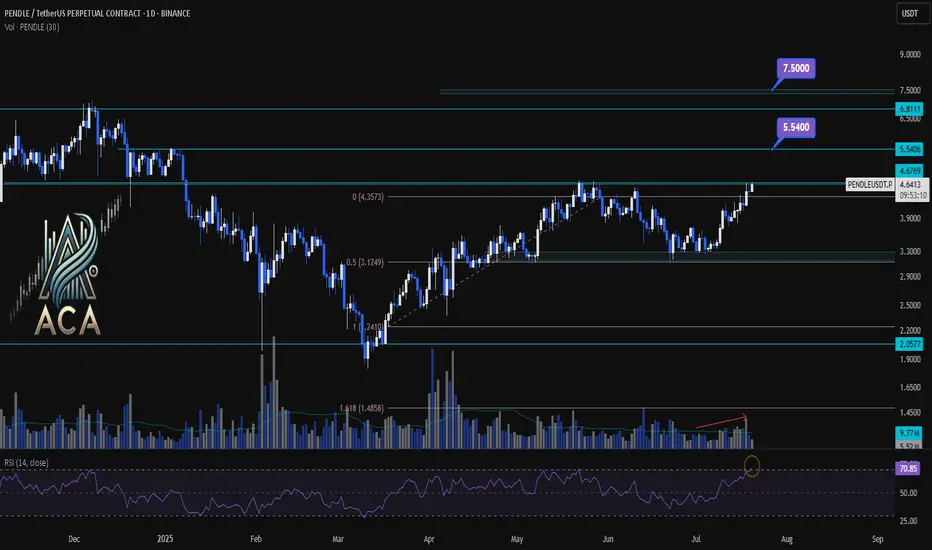
PENDLEUSDT 1D Chart Analysis|Bullish Breakout Eyes Higher TargetPENDLEUSDT 1D Chart Analysis | Bullish Breakout Eyes Higher Targets
🔍 Let’s break down the PENDLE/USDT daily chart, focusing on breakouts above key resistance, Fibonacci retracement dynamics, RSI momentum, and volume confirmation for a comprehensive bullish setup.
⏳ Daily Overview
PENDLE has staged a powerful recovery after pulling back to the 0.5 Fibonacci retracement level (around $3.12). Price is now testing the critical $4.68 resistance—the ceiling from the last corrective wave. RSI has jumped above 71, entering the overbought zone, a classic precursor to strong momentum moves. Volume is rising as bulls attempt a breakout, confirming participation behind the price action.
📈 Technical Convergence and Trend Structure
- Fibonacci Structure: The correction held the 0.5 retracement, a textbook bullish reversal zone in rising trends.
- Resistance Breakout: Price is challenging the $4.68 resistance. A daily close above, especially with high volume, would confirm the breakout and trigger bullish continuation.
- RSI Indicator: RSI has cleared the 70 mark, reinforcing strong momentum. Overbought RSI often supports further rallies when backed by breakout moves and rising volume.
- Volume Confirmation: Volume surged as PENDLE reclaimed lost ground and is now accelerating into the resistance test, suggesting trend conviction and confirming the move.
🔺 Bullish Setup & Targets
- First target: $5.54 — the next resistance based on historical supply and Fibonacci extension.
- If macro conditions like interest rate cuts align, the next potential target: $7.50 — the major extension target where price discovery is likely.
- Key trigger: A strong daily (or weekly) close above $4.68, combined with breakout volume, is likely to ignite the next leg up.
📊 Key Highlights
- Correction held at the 0.5 Fibo, signaling trend health and resetting momentum.
- A bullish daily structure aligned with a weekly breakout confluence.
- RSI and price action both making new local highs — strong uptrend indication.
- Volume confirming the move—a real breakout is underway, not a false start.
🚨 Conclusion
PENDLE/USDT looks primed for continuation higher. The blend of a successful 0.5 retracement retest, breakout attempt above $4.68, robust RSI, and volume surge all point to bullish follow-through. Watch for a confirmed close above resistance as the catalyst for further upside, with $5.54 and $7.50 the next logical targets if momentum persists.
Gold Futures ($GC1!) — US Session Setup: Bearish Retest from 618🟡 Gold Futures ( COMEX:GC1! ) — US Session Setup: Bearish Retest from 0.618 Fib in Bullish Breakout Context
⏳ Pre-US Session Playbook
We're currently watching Gold Futures ( COMEX:GC1! ) for a potential short opportunity into the US session open. While the broader structure has broken bullish, we're anticipating a bearish retest scenario from a key Fibonacci level — aligning cleanly with last week’s breakout structure.
No positions have been taken yet — we are setting up for the US session — and are closely monitoring price action near the 0.618 retracement zone before committing.
📍 Setup Breakdown
• 0.618 Fib Retracement from the last bearish impulse aligns with:
○ Recent volume shelf resistance
○ Retest zone from prior breakout
○ An overextended local push into thin volume above 3380
• Bullish Context:
○ HTF breakout from descending wedge structure remains valid
○ Macro buyers still in control
○ Upside continuation risk is high if sellers don’t show up
• Short Bias Conditions:
○ Rejection or absorption in the 3385–3390 zone
○ Weak follow-through above 0.618 (failed breakout scenario)
○ Breakdown of LTF higher low structure post-test
🧠 Strategy Commentary
Although we’re in bullish breakout mode, this is a tactical short setup — a fade into prior structure with clear invalidation. We're not fighting trend, but looking to short into exhaustion at a defined level, with tight risk parameters.
Confluence Factors:
• 0.618 fib alignment
• VRVP volume shelf
• Prior breakout structure retest
• LTF divergence or absorption confirming the fade
🎯 Trade Parameters (Planned)
• Entry Zone: ~3385–3390
• Stop Loss: Tight, 3395–3400
• Target Zone: 3342–3337 (full structure retest)
📌 Patience is key — this remains a setup until confirmed. We'll post live if and when conditions are met.
Let the market come to you.

fuboTV $5.00 price target Positive Divergence Multi time frameMy trade on fuboTV has a $5.00 price target. With positive divergence multiple time frames 15,1hr, 4hr. An RSI scoop where the hrly RSI with a length setting of 36 shows upward momentum? The Chande momentum oscillator with a setting of 24 indicates the price may not stall at $4.50.

Got filled at the bugattiMy hedge short is filled
continuation of my other chart
IF this is good the target it the!!....
key levels will be longed if data aligns.
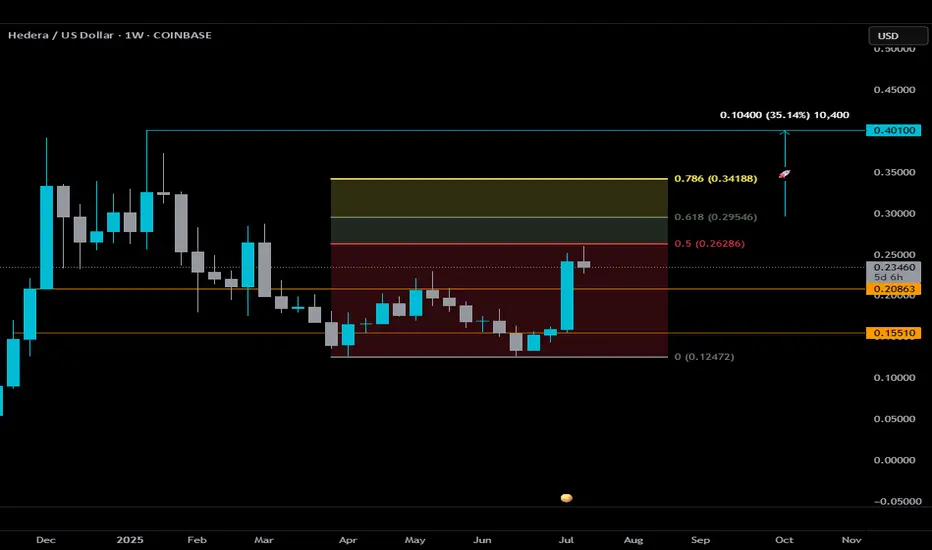
$HBAR Weekly Outlook — Key Levels to WatchHedera is attempting to catch some momentum alongside the broader ISO20022 narrative, but from a technical standpoint, here’s what matters right now:
🔍 The 0.5 Fib level at $0.26286 is critical.
During last week’s #bUCKmOON the candle came close but ultimately failed to close above it — a clear sign of rejection. Until we see a confirmed weekly close above that level, this move remains a potential fakeout rather than a breakout.
⚠️ If HBAR can secure that close, the next key area is the golden zone. A break into this zone would suggest bullish momentum is gaining strength, with a potential target at $0.401 — roughly 35% from the .618 Fib.
🟥 On the downside, as long as price stays under the 0.5 Fib and in the “red zone,” don’t expect much follow-through. Price will likely continue to range between the two well-defined orange lines:
• Support: $0.15510
• Resistance: $0.20863
These levels have held consistently throughout 2025 and should continue to act as key pivots.
📌 In summary:
— No weekly close above the Red Zone = range-bound behavior
— Break and hold above the red zone = potential entry into bullish continuation
— Golden Zone = area to monitor for acceleration or reversal
Stay Sharp and Disciplined. Wait for the setup, confirmation is 🗝️.
THIS IS NOT FINANCIAL ADVICE. DrAnkin Smöökëē Whizkee. Edumacational Purpiz Only!