✅EUR_USD MOVE DOWN AHEAD|SHORT🔥
✅EUR_USD has formed a
Bearish flag pattern while
Trading in an a downtrend
So I think that IF a bearish
Breakout happens then we
Will see a further move down
SHORT🔥
✅Like and subscribe to never miss a new idea!✅
Flag-breakout

EUR-JPY Wait For Breakout! Sell!
Hello,Traders!
EUR-JPY is about to reteset
A strong horizontal resistance
Level at 148.000 and has
Formed a bearish flag pattern
So IF we see a bearish breakout
Then I believe the pair
Will go further down
Sell!
Like, comment and subscribe to help us grow!
Check out other forecasts below too!

Gold flag breakout expected i am expecting higher prices on Gold it was in a very good bullish momentum seems like making falling flag this is what we hav right now but the patter can change we can only confirm at the killzones if there is any update i will post further keep follow for more

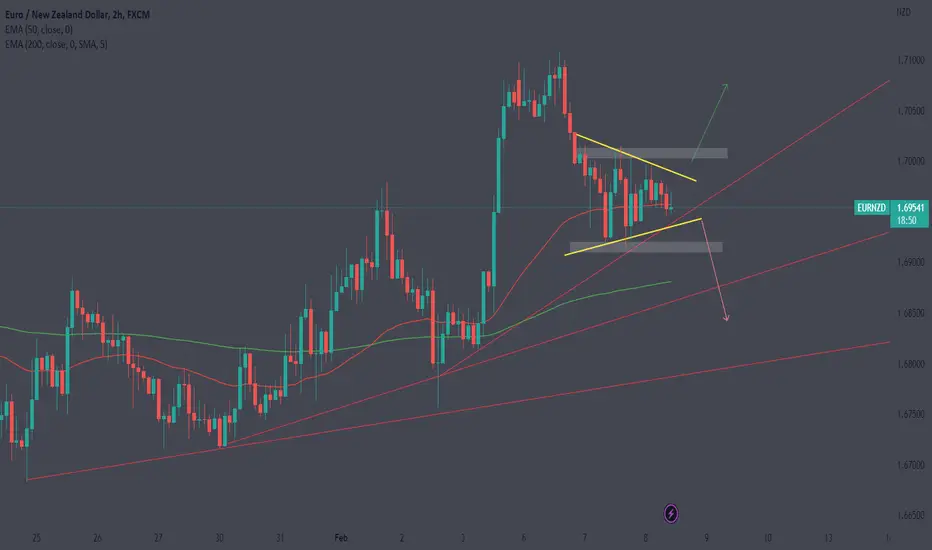
EURNZDEURNZD - A break to either direction
Pennant/ Inverse Cup & Handle / Bear flag - Whatever is on your trade plan...
It's a break above Highs of: 1.70115 It would take you towards 1.70725
A break below the lows of: 1.69170 it would take you towards 1.68560
Ideally wait for the break for further confluence. However, be sure to stick to your own trade plan.
Trade Journal
BTC/USDT [Short movement expected]technically btc looking bearish
before btc can go down they will fakeout of bullish peanut
1.25% stoploss
5.50% take profit

✅NZD_USD BEARISH FLAG|SHORT🔥
✅NZD_USD is going down now
And the pair has formed
A bearish flag pattern
Which makes me bearish biased
And after the breakout
I believe we will see bearish continuation
SHORT🔥
✅Like and subscribe to never miss a new idea!✅

EUR-CAD Bearish Flag! Sell!
Hello,Traders!
EUR-CAD is going down now
After the retest of the horizontal resistance
And the pair has formed a bearish flag pattern
So IF we see a bearish breakout
Then a further move down is to be expected
Sell!
Like, comment and subscribe to boost your trading!
See other ideas below too!

EUR-USD Wait For Breakout! Sell!
Hello,Traders!
EUR-USD has formed a bearish flag pattern
While trading in a downtrend
Which makes us bearish biased
And we will be waiting for the breakout
Of the flag to go short on the pair
Sell!
Like, comment and subscribe to boost your trading!
See other ideas below too!

NZD-USD Downtrend Short! Sell!
Hello,Traders!
NZD-USD is trading in a local downtrend
And the pair broke out of the bearish flag pattern
Then proceeded to fall down
So we are bearish on the pair
And I think that we will see a retest
Of the support below next week
Sell!
Like, comment and subscribe to boost your trading!
See other ideas below too!

goev flaganticipating double top break to clear 5 pivot level.
4.17 double bottom entry or an intraday setup with clear risk/reward.

S&P500 Breakout Long! Buy!
Hello,Traders!
S&P500 broke out of the bullish flag pattern
Which makes me locally bullish biased
And I think that after the pullback
And retest of the broken level
We will see a move up
Towards the target above
Buy!
Like, comment and subscribe to boost your trading!
See other ideas below too!

SOL flag breakoutPrice broke and held weekly zone. Formed consolidation flag, had a 61.8% retracement before breaking flag with bb break - high volume on 30 min chart. Need 1h bb break to confirm trade.
Take profit: 150 (psychological level), also at 0.272 extention level - just below daily resistance.
Stop loss: Within channel, below s/r level, below previous structure

AXS flag breakoutPrice had nice daily close, wicking down to 20 day ema, closing with a moderate bullish spread. Price made impulsive move up followed by a very clean flag - channel printed on the 4 hour. Price broke out on the 30 min time frame with ultra high volume to the upside.
Stop loss: Just below daily s/r and vpvr level, inside of previous channel, and in trough of volatility zone measured thru out channel
Take profit: At next daily zone, aligning with the 0.272 fib extension level of flag

NZD-USD Will Fall! Sell!
Hello,Traders!
NZD-USD is trading in a downtrend in bear flag pattern
With the top of the flag facing the horizontal resistance
All of which makes me bearish on the pair
So I think that if we see a bearish breakout
Then the pair will fall further down
Sell!
Like, comment and subscribe to boost your trading!
See other ideas below too!

Huge upside potential in TATA POWERNSE:TATAPOWER is forming a flag after a quick rally. Such consolidations post rally usually occur at 50% of the move which mean rest of the 50% move is still pending and may come into play on breakout from the triangle consolidation. It could be a 125 points move as per the distance of consolidation top from the the point rally started. Keep an eye for the breakout!

KDAUSDT Breakout and UpdateSo, if you jumped on this when I first mentioned it, you made quite a large return. After a nice long consolidation period, its on the move yet again to my major target. Now, there will be some resistance along the way so if you are swing trading this, you will likely be taking profit at those areas and re-entering etc. Anyways, it looks good from here and I expect the asset to move past my major target throughout this leg of the bull cycle. Thanks again everyone!

Onward and UpwardPlease excuse the lack of TA. Just a price target and break out to focus on here. A small scalp up if you will, not financial advice.
Blessings!


EURCHF 31 August 2021Waiting for confirmation for EURCHF to break the bullish flag pattern.
When pattern break. Then we are looking for prices to go up as targeted.
Manage your own risk.
Disclaimer: This content is intended to be used and must be used for information and education purposes only. It is very important to do your own analysis before making any investment based on your own personal circumstances. Accordingly, the writer will not be liable in respect of any damage, expense, or other loss you may suffer arising out of such information or any reliance you may place upon such information.

SQ Nice setupIt seems that we are forming a descending channel,
We broke out of a larger time frame descending channel and now it seems it is setting up for another leg to the upside after the restest
I want to see how it is going to act at 270.50 level, with 274.20 target

✅NZD_CHF SWING LONG🚀
✅NZD_CHF broke out of the bullish flag pattern
That the pair formed on the 1D chart
And now we are seeing the retest of the broken resistance
That has now become the support
After the correction and a retest
I am expecting growth to continue as I am now bullish biased
LONG🚀
✅Like and subscribe to never miss a new idea!✅

NZD-CHF Breakout! Swing Buy!Hello,Traders!
NZD-CHF was trading in a downtrend
In a rising channel, that is also a bullish flag
And we are seeing a bullish breakout
Which makes me bullish biased
And I think that after a retest of the broken level
We will see a move up
Towards the next resistance
Buy!
Like, comment and subscribe to boost your trading!
See other ideas below too!

Price Action Analysis of AMD (1hr)AMD has provided us with amazing trading opportunities over the past several days. Largely in part due to it's breakout to ATH and surpassing $100 for the first time.
This has been quite a large breakout, giving us a nice and tight bullish channel on the lower timeframes. Of course, this rally has to come to an end at some point to form a larger bull channel. Yet, based off this chart analysis, I do believe that AMD may make another leg upward tomorrow.
This is only valid if it holds the channel line. It could just as easily break the trend and begin it's descent .
AMD has given us flags that begin forming near the end of the day and continue forming in the post/premarket. Each time they move to higher highs the next day. We'll see if AMD can continue this trend for at least one more day.
