EURUSD Attempts Final Breakout Ahead of 1.20Fed rate cut expectations for 2025 have nearly reached three cuts after Friday’s payrolls data. Despite political risks in France and negative pressure on JPY following Ishiba’s resignation, the dollar remains weak. The euro and yen together account for 71.2 percent of the dollar index.
EURUSD is about to break the trendline from the top. This could be interpreted as either a flag or a reverse head-and-shoulders formation. In either case, if the 1.17 support holds, the door to 1.20 is likely to open.
Flag

Bullish flag The bullish flag pattern has formed .
and based on FiboNachi and Ichimiko data, it can also rise.

Flag EURGBPThis is a very nice week traders I have been waiting for a week like this for over a month.
We have a clear flap here even though it does not come from a very strong uptrend.
I want us to take a good look at this divergence it is a sign that our downtrend might be coming to an end.
Do not aim for the highest point of this flag.

EURJPY bullish view
OANDA:EURJPY interesting chart, BULLISH FLAG pattern visible, currently after ECB from last week here still will be bullish.
SUP zone: 172.800
RES zone: 1.74000, 1.74300

FREE SIGNALHello friends
You see that after a great growth we had, the price formed a flag and now the resistance has been broken and you can enter the trade with risk and capital management and move with it to the specified targets.
*Trade safely with us*

NZDCAD: Move Up Confirmed?! 🇳🇿🇨🇦
Another intraday bullish confirmation that I spotted today is on NZDCAD pair:
the price violated both a neckline of an inverted head and shoulders pattern
and a resistance line of a bullish flag pattern on an hourly time frame.
I expect a rise at least to 0.8265 level now.
❤️Please, support my work with like, thank you!❤️
I am part of Trade Nation's Influencer program and receive a monthly fee for using their TradingView charts in my analysis.

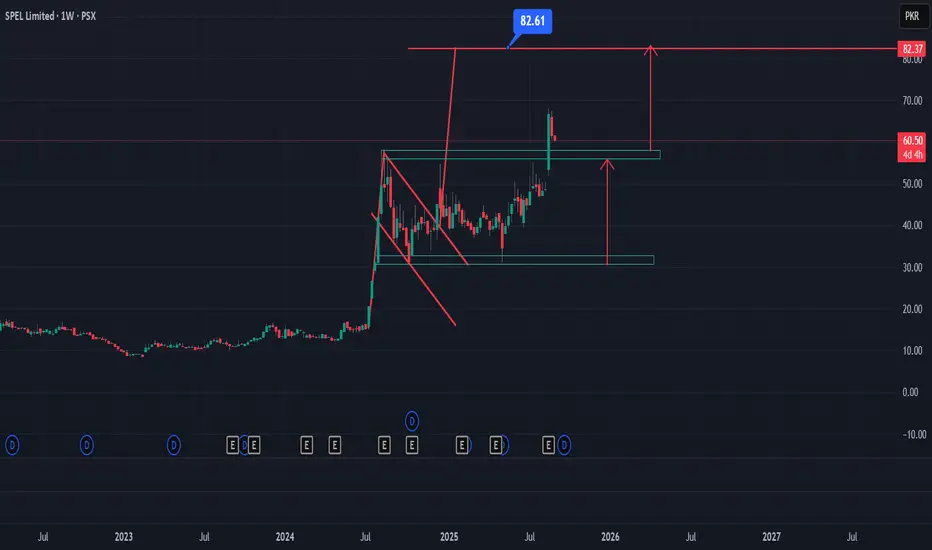
SPEL Limited (PSX: SPEL) – Weekly Chart📌 Pattern: Flag + Range Breakout
📌 Entry Zone: 58–62 PKR
📌 Target (TP): 82–84 PKR
📌 Stop Loss (SL): 50 PKR
📌 Bias: Bullish
Analysis:
SPEL has broken out of both a flag pattern and a range consolidation zone, with both patterns pointing to the same target. This confluence adds strength to the bullish outlook, as long as the breakout zone holds as support.
ENS Ready for 100% Up MoveNow the price is at the Weekly support and forming a wedge pattern and ready to break from this pattern , enter after the strong candle close in weekly .
and at the same time Bitcoin dominance is decreasing and altcoins dominance is started increasing , so look on all the altcoins
and follow proper risk management , it has very good chances to move UP side but first we have to protect the down side , where risk management comes into game .
Follow for more Ideas and potential coins/ Stocks .

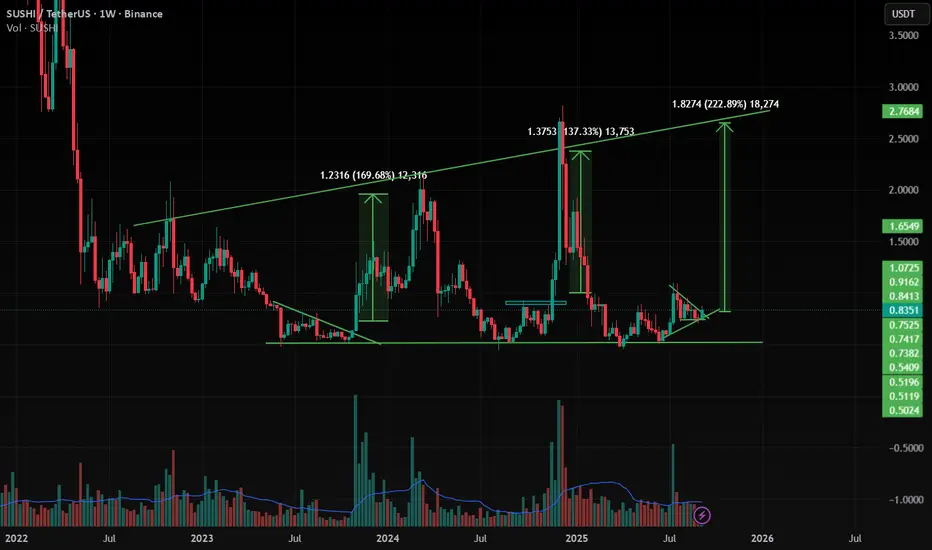
SUSHI Ready for 200 % Up Move SUSHI is forming expansion channel and moving inside that pattern and now it is at support and breaking from a pattern at support , so we can expect 200 % Up move from that breakout .
and at the same time Bitcoin dominance is decreasing and altcoins dominance is started increasing , so look on all the altcoins
and follow proper risk management , it has very good chances to move UP side but first we have to protect the down side , where risk management comes into game .
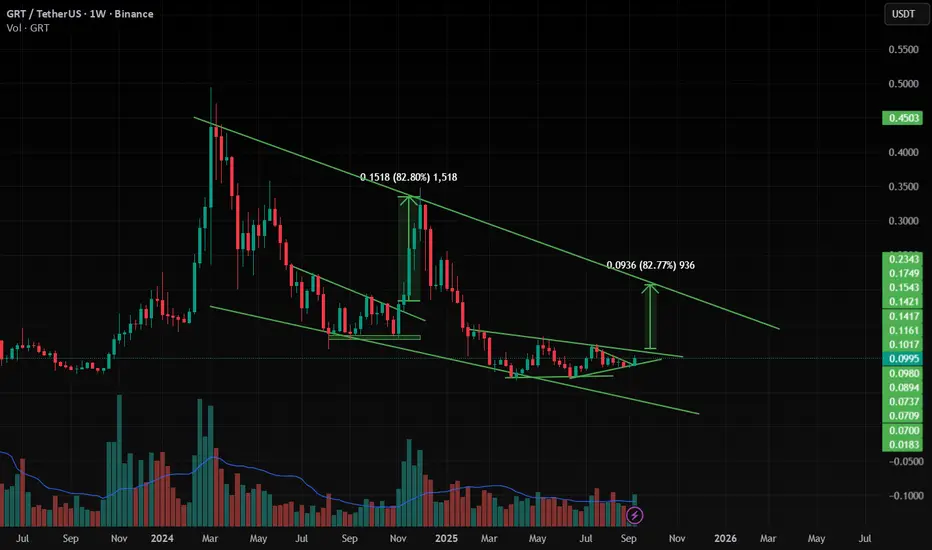
GRT is ready to move 80% Up GRT is moving inside the Triangle or Flag or wedge , and when it is breaking from pattern at support giving good move .
and at the same time Bitcoin dominance is decreasing and altcoins dominance is started increasing , so look on all the altcoins.
and follow proper risk management , it has very good chances to move UP side but first we have to protect the down side , where risk management comes into game .
LRC/USDTLRC is moving inside the channel pattern in weekly , Now it is at support zone from where it can give amazing move (140% nearly) if the altcoins gain volume in market-cap .
and at the same time Bitcoin dominance is decreasing and altcoins dominance is started increasing , so look on all the altcoins
and follow proper risk management , it has very good chances to move UP side but first we have to protect the down side , where risk management comes into game .

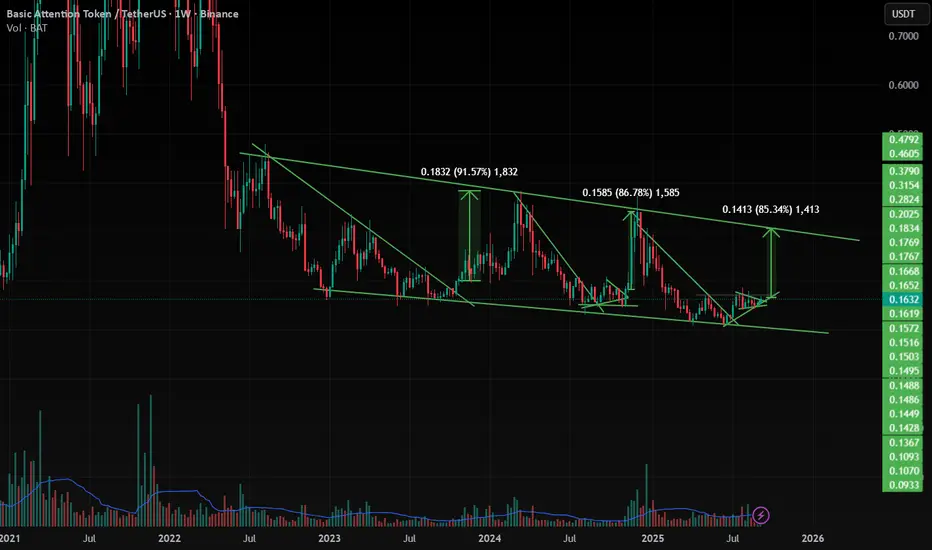
BAT/USDT , 1W BAT has moving same as previous moves , so it will give nearly 85 % UP move very strong if it breaks the upper trendline in Weekly and strong candle close .
Main important points are
1. BTC Dominance is falling Daily
2. ETH Dominance is increasing
3. Altcoins Dominance is Increasing
Means Volume is moving from BTC too Altcoins Slowly , soo Altcoins season is coming soo , look on Breakouts in altcoins , they will perform vey well .
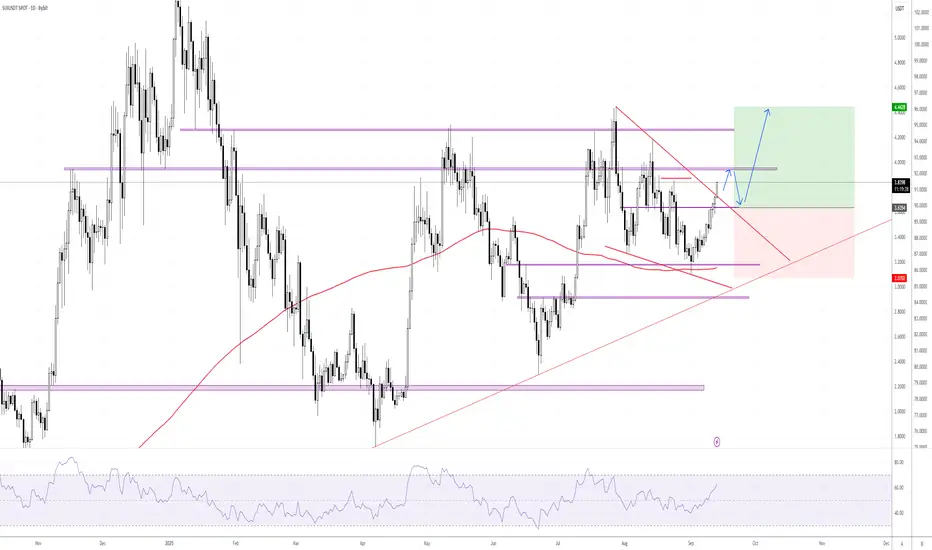
SUI Wedge BreakoutSui formed a bullish Wedge and it broke out.
If the price established above 3.63, We can expect a bullish move up to 4.4 area.
Stops at 3.07.
CRV Bullish FlagCRV is forming a bullish Wedge.
If the price broke the resistance level at 0.86 and Established above, We can expect a bullish move up to 1.11 area.
Stops at 0.71.

SEI - MASTERCALL AGAIN! - +30% up.Another mastercall on NYSE:SEI - +30% up already ✅🔥
You know what's coming??? 🤑
Whyyy aren't you following me yet????

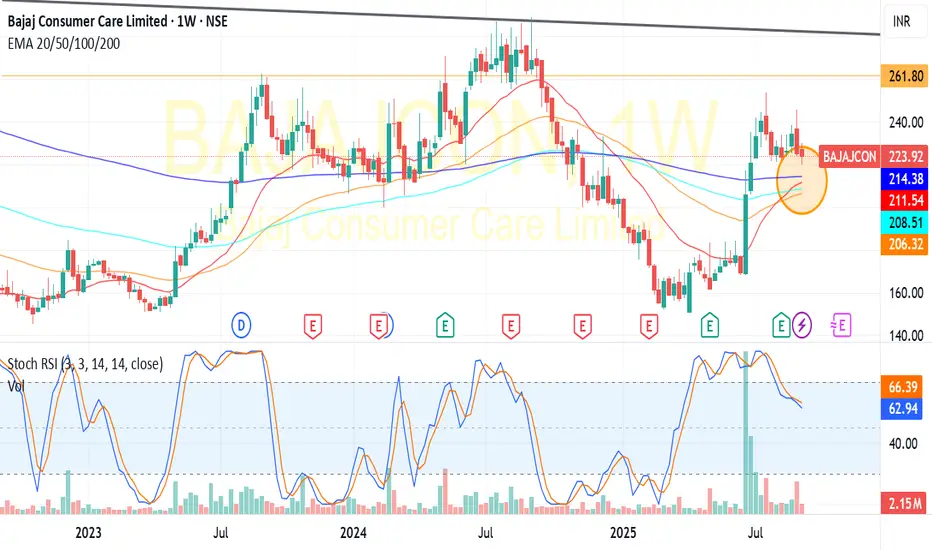
BAJAJ CONSUMER CARE:Likely flag pattern breakoutBAJAJ CONSUMER CARE:Trading at 223-after consolidation ,now trading above all its DEMA viz 20/50/100/200.DEMA Golden ross over and flag pattern formation in weekly chart suggests a move towards 300 ,once it gives neckline breakout at 240 levels.Based on the long term chart pattern,my positional target would be around 300(For educational purpose only)
HRTG Bull Flag BreakoutBull flag has been forming since May and looks to be breaking out. Targeting first trim @ 25, has potential to hit 25.5 and 26 based on previous levels.
17Oct2025 22.5c @ 2.45

$INTC the next leg to $34-44I took a trade last month that ended up going 500%, now I think it's time for the next leg of the move to play out.
The chart shows a recent breakout of a bull flag and price now testing a key resistance level.
I think once price breaks resistance here and can make it above that $26 resistance level, we'll see a large move higher start.
I think the move has the potential to reach $34-37, but can potentially make it all the way up to $44-45 level.
Let's see how it plays out.

GBPJPY still bullish expectations
OANDA:GBPJPY price is make bullish push, then we are have BULLISH FLAG created, in this week price is making zig-zag moves in zone, today its make break, which taking for bullish confirmation.
SUP zone: 199.400
RES zone: 200.600, 201.400

CRUDE OIL (WTI): Strong Bearish Pressure
WTI Crude Oil is under a strong bearish pressure after
US CPI release today.
A bearish breakout of a support line of a flag pattern
in a clear intraday downtrend on a 4H time frame leaves
a strong confirmation.
I think that the price will reach 62.0 level soon.
❤️Please, support my work with like, thank you!❤️
I am part of Trade Nation's Influencer program and receive a monthly fee for using their TradingView charts in my analysis.

Familiar antics.Very similar to many others, a bullish flag,
preparing to break through the price ceiling.
Let's see what awaits us in uncharted territory.

Positive attitudeThe listing formed a ceiling level of 7 cents,
and it is clear that the bullish flag we are currently
seeing and the RSI rebound are designed to break through this ceiling.
Beyond that lies uncharted territory.

XAUUSD 1H – Rising Channel | Possible Rejection | CORRECTIONFOREXCOM:XAUUSD
Structure | Trend | Key Reaction Zones
Price is trading inside a rising channel, recently hitting an overextended zone near 3675 where sellers stepped in. Current movement shows bearish rejection with downside pressure.
Market Overview
Gold has been making higher highs (HH) and higher lows (HL), confirming bullish structure. However, the latest rejection from the channel top signals weakness, with sellers taking control in the short term. Demand zones below may provide temporary support, but risk of a breakdown remains if 3626/3613 levels are breached.
Key Scenarios
✅ Bullish Case 🚀 → Bounce from 3626 zone could send price back toward 3649 and possibly retest 3675.
❌ Bearish Case 📉 → A clear break below 3626/3613 opens the path toward 3575, with extended downside into 3511 liquidity zone.
Current Levels to Watch
Resistance 🔴: 3649 – 3675
Support 🟢: 3626 – 3613 | 3575 | 3511
Trade Setup (Short-Term)
🎯 Target 1: 3626
🎯 Target 2: 3613
🎯 Target 3: 3575
⛔ Stoploss: 3675 (Invalidation above channel top)
⚠️ Disclaimer: For educational purposes only. Not financial advice.
