BTCUSD Another Bullish Flag & Retest of a Demand Zone | NEW ATHsLooks like the bull run has only just begun.
Bullish confirmations upon bullish confirmations.
This particular setup for another impulse will only become invalidated when or if the demand zone is violated.
Ride the trend.
Flag

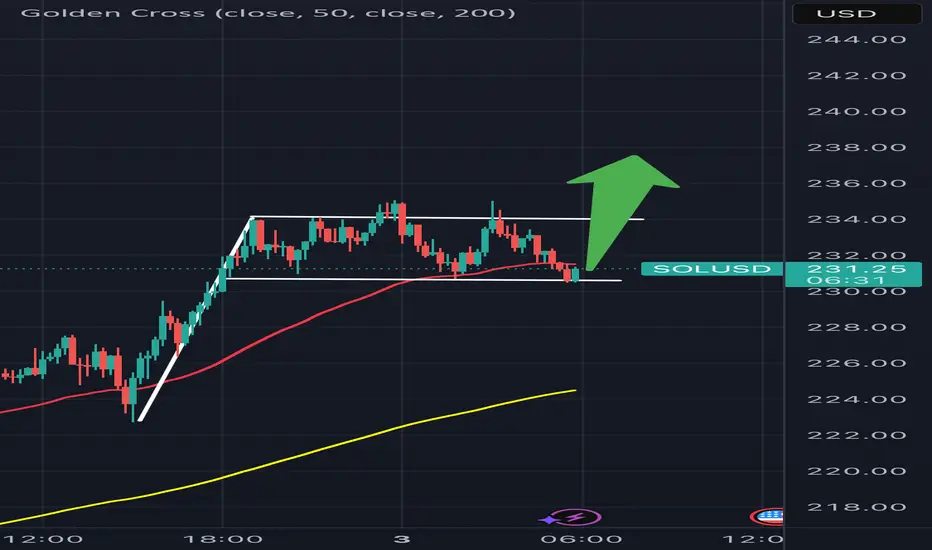
Bull flag / bullish rectangleWhen BTCUSD will come out of the (bullish) descending channel pattern (I think it wil) then SOLUSD will play it out this way too. Let’s go!
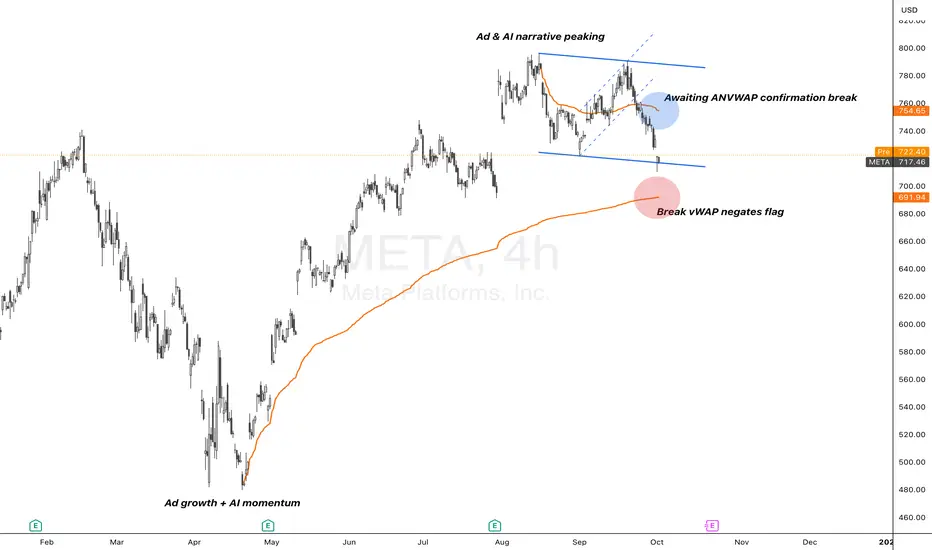
META | AI Capex Drive vs $754 Decision PointMeta’s recent earnings reinforced the AI and ad monetisation story, with revenue growth, margin expansion, and aggressive capex guidance ($64–72B). Deals like the $14B CoreWeave cloud agreement and plans to personalize ads via AI chats keep the structural AI narrative alive. These catalysts provide fuel for investors to stay engaged with the stock despite higher spend.
On the 4H chart, META’s bullish flag structure has retraced toward anchored VWAP support. The $754 anchored VWAP is the key decision point:
If price reclaims and holds above → structure remains constructive with scope for continuation.
If price stays capped below → flag negation risks deeper correction into VWAP trendline support.
Takeaway: $754 anchored VWAP is the line that separates continuation from correction.
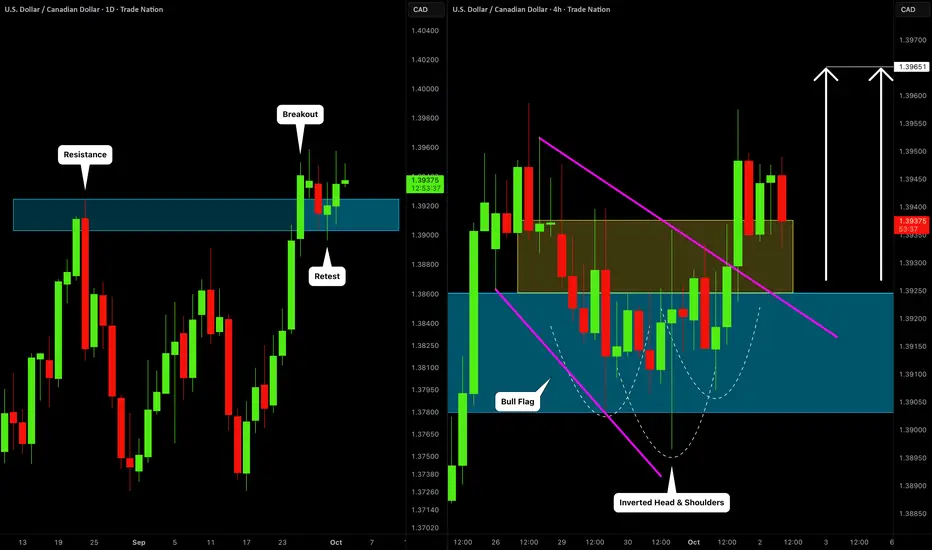
USDCAD: Correction is Over?! 🇺🇸🇨🇦
USDCAD may complete a correctional movement after a confirmed
breakout of a major daily resistance.
A bullish violation of a trend line of a bullish flag pattern and a neckline
of an inverted head & shoulders pattern provides a strong confirmation.
Next goal - 1.3965
❤️Please, support my work with like, thank you!❤️
I am part of Trade Nation's Influencer program and receive a monthly fee for using their TradingView charts in my analysis.
XAUUSD’s next target = $4059Because of the bullflag with the long pole it is currently breaking up from *not financial advice*

GBPUSD | Retest of Broken Channel Reinforces Bear CaseDespite market hopes for multiple BoE rate cuts, the September meeting disappointed. The Bank held rates at 4% and slowed its QT pace — a signal of policy caution rather than hawkishness.  Two committee members pushed for cuts, but the broader tone emphasized sticky inflation — especially in services and food — keeping constraints on GBP strength.
Technical Lens
• Price has broken decisively below the ascending channel that had underpinned the recent GBPUSD rally.
• The pair is now retesting the lower trendline of that channel from below, which is acting as resistance — a classic break-then-retest setup.
• Momentum indicators (e.g. RSI) show room for further downside, with no signs yet of bullish divergence.
• Should resistance hold on the retest, it would add weight to the view that the earlier upside leg is exhausted and that the next impulse is lower.
Scenarios
• If resistance holds (retest fails): The broken channel becomes a barrier. We lean toward a resumption of downside — targeting the ~1.3100 region as the next structural zone.
• If buyers reclaim the channel (close back inside): A short-term bounce is possible, but the macro framework and internal momentum remain hostile to sustained GBP upside. Any rebound is likely capped by the same former channel boundary.
Catalysts to Watch
• UK inflation data (CPI, PPI, services inflation) — stickiness could delay dovish expectations.
• BoE communication or minutes — changes in nuance could shift market expectations.
• US / Dollar strength or weakness (as GBPUSD also reacts to broad USD moves).
• Risk sentiment or spillovers from global macro shifts.

ServiceNow: Potential Bearish FlagServiceNow has struggled as the broader market hits new highs, and some traders may see downside risk.
The first pattern on today’s chart is the failed rally after the last earnings report in late July. That may reflect negativity toward its longer-term fundamentals.
NOW bottomed under $850 before clawing back to stall around $975 last week. The resulting series of higher lows may be viewed as a bearish flag that’s now breaking.
Third, the software company’s recent peak occurred at its 200-day simple moving average (SMA). That may reflect longer-term bearishness.
Next, the 50-day SMA had a “death cross” below the 200-day SMA in mid-August. That could also reflect longer-term bearishness.
Finally, NOW made a 52-week low of $678.66 in April. Could traders expect a move toward that level if selling intensifies?
TradeStation has, for decades, advanced the trading industry, providing access to stocks, options and futures. If you're born to trade, we could be for you. See our Overview for more.
Past performance, whether actual or indicated by historical tests of strategies, is no guarantee of future performance or success. There is a possibility that you may sustain a loss equal to or greater than your entire investment regardless of which asset class you trade (equities, options or futures); therefore, you should not invest or risk money that you cannot afford to lose. Online trading is not suitable for all investors. View the document titled Characteristics and Risks of Standardized Options at www.TradeStation.com . Before trading any asset class, customers must read the relevant risk disclosure statements on www.TradeStation.com . System access and trade placement and execution may be delayed or fail due to market volatility and volume, quote delays, system and software errors, Internet traffic, outages and other factors.
Securities and futures trading is offered to self-directed customers by TradeStation Securities, Inc., a broker-dealer registered with the Securities and Exchange Commission and a futures commission merchant licensed with the Commodity Futures Trading Commission). TradeStation Securities is a member of the Financial Industry Regulatory Authority, the National Futures Association, and a number of exchanges.
TradeStation Securities, Inc. and TradeStation Technologies, Inc. are each wholly owned subsidiaries of TradeStation Group, Inc., both operating, and providing products and services, under the TradeStation brand and trademark. When applying for, or purchasing, accounts, subscriptions, products and services, it is important that you know which company you will be dealing with. Visit www.TradeStation.com for further important information explaining what this means.

AUDCAD: Important Breakout Confirmed 🇦🇺🇨🇦
AUDCAD completed a correctional movement within a bullish flag pattern.
A confirmed violation of its resistance line with a daily candle close above that
suggests a highly probable bullish continuation.
The next strong resistance is 0.925.
It will be the next goal for the buyers.
❤️Please, support my work with like, thank you!❤️
I am part of Trade Nation's Influencer program and receive a monthly fee for using their TradingView charts in my analysis.

ExxonMobil (XOM) – Why I see a 3x potential in 5 yearsExxon has built a structural edge no other major can replicate: a centralized AI system running on decades of proprietary geological, operational, and financial data. This isn’t PR – it drives real efficiency gains: +20% recovery in key assets, optimized plants/logistics, and $30B extra cash flow targeted by 2030.
Technically, the 3M chart shows a long-term uptrend with a bull flag consolidation. Historical 30–40% drawdowns to the 36-period SMA suggest a possible retest at $85–90 – which I view as a Strong Buy zone.
With AI as a core advantage, diversified energy investments (H2, lithium, LNG), and relative undervaluation, I believe XOM is one of the strongest 5-year plays in the energy sector.

WIF back to $3Complete look at Dog WIF Hat
We had some pretty nice technical setups on this meme.
#HVF
#DoubleTop
#InverseHeadandShoulders
#BullFlag
Currently it has two active patterns ...

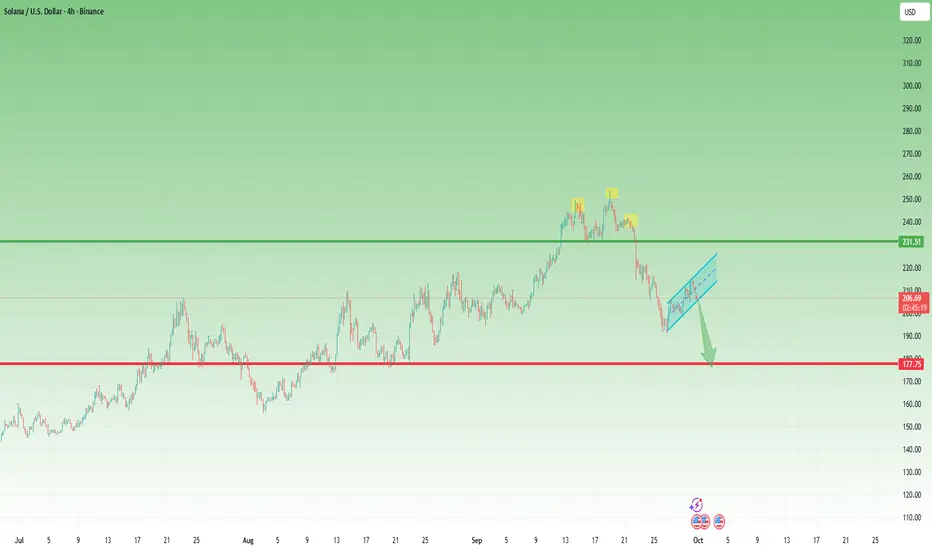
Solana: From 254 Highs Back to the 200 Line – What’s Next?At the end of August, I wrote that as long as 190 remained intact, Solana had room to rise toward 250, and I suggested a buy around the 200 level. That trade worked beautifully, with price reaching as high as 254.
From there, Solana started to roll over. At first, it looked like a normal correction, but the picture changed after a weak bounce attempt. Price broke decisively below 230, and the recent low was set right back at 190.
Currently, Solana is recovering once again. However, the structure of this bounce looks corrective in nature, forming what appears to be a bearish flag.
🔑 Key levels to watch:
• A break below the flag’s support – and more importantly below 200 – would likely trigger another leg down.
• In that case, the market could head toward a 175–180 major support zone, which is the next critical area for buyers to defend.
Until then, the bias remains cautious: Solana must prove it can break free from the corrective structure before bulls can regain control. 🚀
HINDPETRO:LIKELY FLAG PATTERN B/OUTHindpetro:
I)Trading above all its 2ODEMA,50DEMA,100DEMA,200DEMA Moving averages
II)20DEMA Golden crossover above 50/100/200 DEMA
III)Consolidating around 423 and has formed a flag pattern in long term charts
Above factors suggest a break out at this level for a positional target of 435-440+levels(For educational purpose only)

BTCUSD Another Bullish Continuation PatternAnother bull flag has formed. Meaning another bullish impulse is loading.
Every time you see one of these, do not hesitate. Ride the trend.

BTCUSD Another Bullish Impulse LoadingLooks like price is getting ready to break out again into another bullish impulse. Bullish flag and break of supply are my confirmations for going long.

DXY (U.S. Dollar Index) – Bearish MomentumPrice is giving us signs of Bearish Momentum while respecting the larger descending channel structure, having recently tapped the upper trend line with a strong rejection.
Expecting:
A lower time frame correction to confirm continuation.
Targeting 90% if price breaks impulsively to the downside.
If price taps into our area of interest, we might expect a potential bullish reversal, depending on price action and correction quality.
Let price do the work, wait for the correction before entering short.

#BTCUSDT.P (1H Chart)#BTCUSDT.P
(1H Chart)
🔹️ Bitcoin Analysis Update 🔹️
The bullish outlook from the previous analysis remains valid.
The yellow box resistance has been engulfed, and I expect the bullish move to continue.
📌 Best entry zone: Blue Box
🎯 Main target for this long setup: Red Box (114,000 – 114,500)
🚀 If you enjoyed this analysis, please give it a boost 💙
and to not miss any new analyses or setups, make sure to follow me 📊
🆔️ @Rasoolahmadi


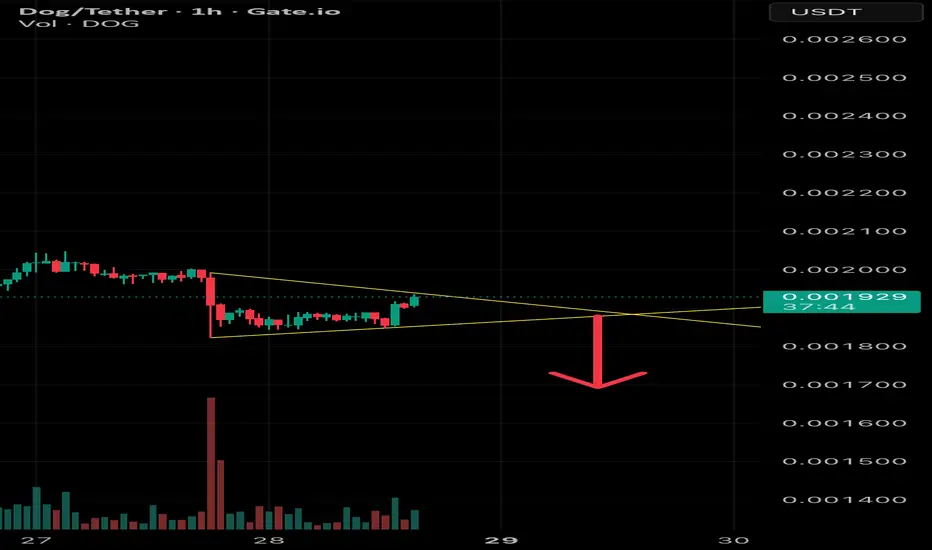
Bear pennant trade setup for $DOGAMEX:DOG trade setup Bear pennant
Entry at breakout (wait for retest most fakeouts fail here)
Look for increased volume.
Target $0.0017 (take partial profits on its way down)
Price above $0.002 (flagpole) makes the trade invalid.
ETH Salaam
Just see and share a possible scenario.
ETH could make a bull flag on daily time frame just below the weekly key level of 4,000.
Also in weekly time frame, ETH broke the large triangle to the upside and now retesting, it should build it there is any will to contribute rise!
Look at 4h candle with high volume make it like accumulation.
For now confirmation wait for daily and weekly close above 4k.
Break the bill flag, retest and go for tp1 and 2.
Have great trade
Consider risk management

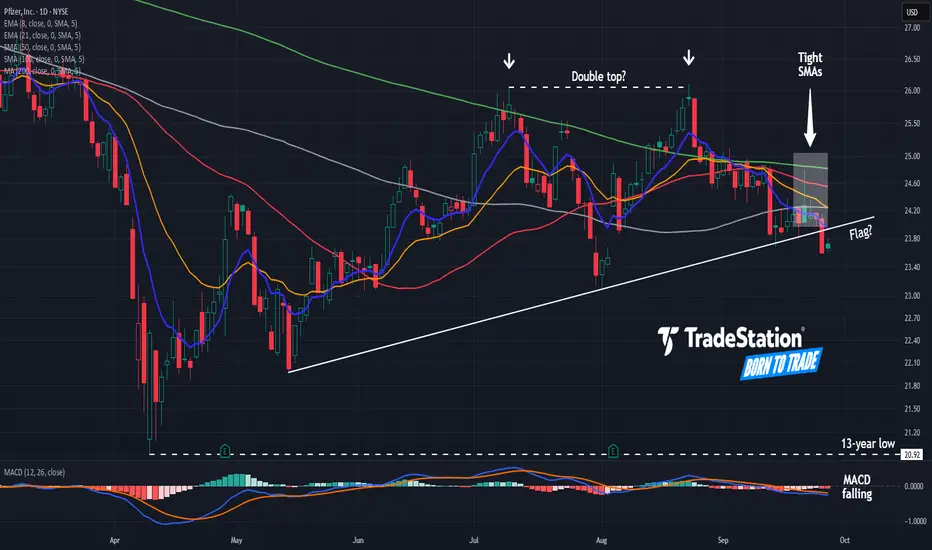
Pfizer: Long-Term Downtrend Still in Effect?Pfizer has spent almost two years consolidating after a major slide. Now some traders may see the long-term downtrend reasserting itself.
The first pattern on today’s chart is the pair of highs in July and August just above $26, which could be viewed as a double-top reversal pattern.
Second, the drugmaker made a series of higher lows since May. It closed yesterday under that trendline: a potential bear-flag breakdown.
Third, the 50-, 100- and 200-day simple moving averages are close to each other. That illustrates the long period of consolidation, which may open the door to renewed movement.
Fourth, MACD is falling and the 8-day exponential moving average (EMA) is below the 21-day EMA. Those signals could suggest that bears are taking control in the short-term.
Next, technicians may see odds favoring a retest of April’s low under $21.
Finally, PFE is an active underlier in the options market. (It trades more than 100,000 contracts per session, according to TradeStation data.) That could help traders take positions with calls and puts.
TradeStation has, for decades, advanced the trading industry, providing access to stocks, options and futures. If you're born to trade, we could be for you. See our Overview for more.
Past performance, whether actual or indicated by historical tests of strategies, is no guarantee of future performance or success. There is a possibility that you may sustain a loss equal to or greater than your entire investment regardless of which asset class you trade (equities, options or futures); therefore, you should not invest or risk money that you cannot afford to lose. Online trading is not suitable for all investors. View the document titled Characteristics and Risks of Standardized Options at www.TradeStation.com . Before trading any asset class, customers must read the relevant risk disclosure statements on www.TradeStation.com . System access and trade placement and execution may be delayed or fail due to market volatility and volume, quote delays, system and software errors, Internet traffic, outages and other factors.
Securities and futures trading is offered to self-directed customers by TradeStation Securities, Inc., a broker-dealer registered with the Securities and Exchange Commission and a futures commission merchant licensed with the Commodity Futures Trading Commission). TradeStation Securities is a member of the Financial Industry Regulatory Authority, the National Futures Association, and a number of exchanges.
Options trading is not suitable for all investors. Your TradeStation Securities’ account application to trade options will be considered and approved or disapproved based on all relevant factors, including your trading experience. See www.TradeStation.com . Visit www.TradeStation.com for full details on the costs and fees associated with options.
Margin trading involves risks, and it is important that you fully understand those risks before trading on margin. The Margin Disclosure Statement outlines many of those risks, including that you can lose more funds than you deposit in your margin account; your brokerage firm can force the sale of securities in your account; your brokerage firm can sell your securities without contacting you; and you are not entitled to an extension of time on a margin call. Review the Margin Disclosure Statement at www.TradeStation.com .
TradeStation Securities, Inc. and TradeStation Technologies, Inc. are each wholly owned subsidiaries of TradeStation Group, Inc., both operating, and providing products and services, under the TradeStation brand and trademark. When applying for, or purchasing, accounts, subscriptions, products and services, it is important that you know which company you will be dealing with. Visit www.TradeStation.com for further important information explaining what this means.
GBP/NZD bullish flag breakout on 12h chart + risk controlCandle still need to close above breakout 1 to consider success. Pending few hours more. Hope for the best. Set S.L to breakeven first for dynamic risk control measure & free up margin. This is a volatile pair. Gd luck guys.

CRUDE OIL (WTI): Strong Intraday Confirmation
A quick follow-up for the yesterday's analysis on WTI Crude Oil.
The price went up as I predicted.
The market managed to violate a resistance line of a bullish flag pattern
on an hourly time frame, providing a strong intraday confirmation.
The price will likely grow more and reach 65.58 level after a completion of a retracement.
❤️Please, support my work with like, thank you!❤️
I am part of Trade Nation's Influencer program and receive a monthly fee for using their TradingView charts in my analysis.

Gold Bull Flag and new ATHsBullish Signs are showing a high probability of new All Time Highs around 3800. Let's ride the trend till the wheels fall off.
