ETH — [2D] WEEK 49 TREND REPORT | 12/05/2025ETH — WEEK 49 TREND REPORT | 12/05/2025
Ticker: BINANCE:ETHUSDT
Timeframe: 2D
This is a reactive structural classification of ETH based on the weekly chart as of this timestamp. Price conditions are evaluated as they stand — nothing here is predictive or forward-assumptive.
⸻
1) Current Trend Condition [ Numbers to Watch ]
Current Price @ 3,030
• Trend Duration @ +70 Days ( Bearish )
• Trend Reversal Level ( Bullish ) @ 3,689
• Trend Reversal Level ( Bullish Confirmation ) @ 3,534$
• Pullback Resistance @ 3,914
• Correction Support @ 3,096$
• Structural Support @ 1,946$
⸻
2) Structure Health
• Retracement Phase:
Testing Structure (approaching 38.2%)
• Position Status:
Unstable (price below both structural layers)
⸻
3) Temperature :
Cooling Phase
⸻
4) Momentum :
Bearish
⸻
Author’s Note
DOWNWARD STRUCTURAL ALIGNMENT
This mark identifies a moment where the market showed clearer alignment with downside direction. It does not predict future movement, but acknowledges where weakness became more evident within the prevailing structure. Its relevance remains only while price continues to hold beneath key structural boundaries.
⸻
Methodology Overview
This classification framework evaluates directional conditions using internal trend-interpretation logic that references price behavior relative to its structural layers. These relationships are used to identify when price movement aligns with the framework’s criteria for directional phases, transition points, or regime shifts. Visual elements or structural labels reflect these internal interpretations, rather than explicit trading signals or preset indicator crossovers. This framework is observational only and does not imply future outcomes.
Flags

BITCOIN Weekly line charttells a story of 4 discernible patterns and 4 log targets.
1) The inverse head & shoulders to end the bear market
2) A broadening rising flag .... which at the time, many thought it was head and shoulder's top on the candle chart.
3) A small sideways flag
4) and the current frustrating broadening descending bull flag. Which has cause much grief to participants but will likely gives an explosive quick large moves.
As you can see putting the chart can help in identifying trends.. key highs and lows and also gives patterns that may not be visible on a candle chart.
Another tool in your toolbox.

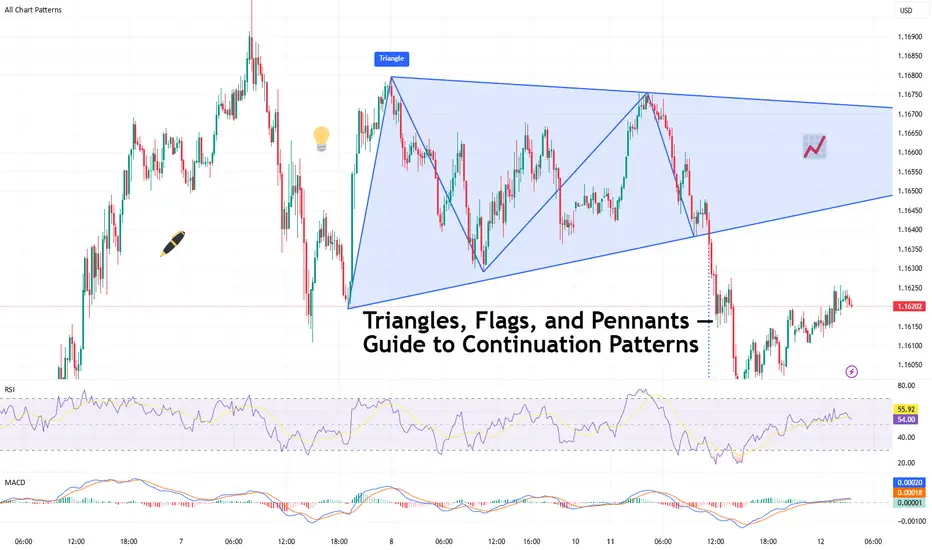
Triangles, Flags, and Pennants — Guide to Continuation PatternsChart patterns can be mysterious — until they’re not. Let’s break down the technical trio that tells you when a trend’s just taking a breather before it flexes again.
So your chart’s been pumping higher for weeks, and then… nothing. Price starts scribbling sideways. Cue panic? Maybe. But more likely, you’re staring at a continuation pattern.
Triangles, flags, and pennants are the subtle “hold my beer before I try to pull a move” signals of technical analysis. They show up when markets pause — not reverse. That pause could mean your trend is catching its breath, not dying in a ditch.
In other words: don’t close your longs just because things go quiet. Sometimes the market is just stretching before it sprints again.
⚠️ Symmetrical, Ascending, Descending
Let’s talk triangles, the Swiss Army knife of consolidation. These shapes come in three stylish varieties:
● Symmetrical triangle: Higher lows, lower highs. Traders call this the indecision pattern, but don’t get it twisted — it may just be winding up for a breakout. Wanna see how these look in practice? Dive into our community’s symmetrical triangle ideas .
● Ascending triangle: Flat top, rising bottom. Buyers are aggressive, their patience is running out. Resistance looks like it’s begging to be broken. Check the ascending triangle ideas for your viewing consideration.
● Descending triangle: Flat bottom, falling top. This one’s more bearish than your boomer uncle who knows zero about Bitcoin BITSTAMP:BTCUSD , and yes — it’s often a precursor to a breakdown. Follow the descending triangle ideas and make sure you DYOR.
Key tip : Wait for the breakout. Don’t front-run triangles unless you like volatility surprises and emotional damage.
🚩 Flags: Fast Moves, Tight Consolidations
Flags form after a sharp price move — the “flagpole” — followed by a tight, slightly sloping channel that moves against the prevailing trend. They’re short-term patterns that act like pit stops during a race.
● In a bull flag, price rallies sharply, then consolidates lower in a downward-sloping rectangle. If price breaks above the upper boundary, the uptrend is likely to resume. Jump straight into the bullish flag ideas .
● In a bear flag, price crashes, then drifts higher or sideways, forming an upward-sloping consolidation. A breakdown below the lower support hints at a continuation lower. What goes up must go down — bearish flag ideas for thought.
Flags are prized for their reliability and tight risk-to-reward setups. The breakout is typically swift, and traders often use the length of the flagpole as a projected target.
🎏 Meet the Pennant: The Flag’s Cousin
Pennants are like mini-triangles that form after a strong price move, usually in high-volume conditions. Unlike regular triangles, they’re smaller and more compressed — a tight consolidation in the shape of a tiny symmetrical triangle.
What makes a pennant different from a flag? The structure. While flags are rectangular, pennants are more pointed — a converging pattern rather than parallel lines.
Pennants are often seen in high-momentum environments, and when price breaks out of the consolidation zone, it often does so with force. Get some pennant ideas straight from our community.
🧐 How to Actually Trade These Patterns
Spotting a continuation pattern is one thing. Trading it with discipline is another.
Here’s a basic checklist:
● Identify the trend. Continuation patterns only work when there’s a clear preceding move. If the chart is a sideways mess, maybe skip it.
● Draw your levels. Use trendlines or horizontal support/resistance to outline the pattern. Keep it clean — if you’re forcing a pattern, it probably isn’t there.
● Wait for the breakout. Don’t jump in too early. Let the price confirm your bias. Breakouts are more credible with a volume spike.
● Set your stop wisely. Most traders place stops just outside the opposite side of the pattern — below the lower trendline in an uptrend, or above the upper trendline in a downtrend.
● Target projection. Many use the height of the pattern or the flagpole to estimate a target price, though market conditions should influence your approach.
🤔 So, What Could Go Wrong?
Glad you asked. Plenty.
● Fakeouts: Just because it looks like a breakout doesn’t mean it’s real. Wait for confirmation — volume, a close outside the pattern, or your favorite indicator giving the green light.
● Shaky patterns: Not every triangle-looking pattern is a triangle. Sometimes it’s just noise. Don’t make up patterns. The market doesn’t care about your geometry.
● Overleveraging: Continuation patterns look reliable, but no pattern is bulletproof. Position sizing still matters. Don’t bet the farm because a pennant gave you butterflies.
💡 Pro Tips from the Chart Trenches
● Set alerts on trendline breaks so you’re not glued to the screen like a caffeinated hawk.
● Use pattern recognition tools if you’re a newer trader — but verify manually. No software is a crystal ball.
● Trade continuation patterns in the direction of the trend. Countertrend flags are usually bear traps in disguise.
📌 One Last Thing: Pattern ≠ Prediction
Chart patterns don’t tell the future. They tell a story about buyer and seller behavior. Continuation patterns? They’re just the market saying, “Yeah, we’re still into this trend. Just grabbing some break first.”
Use them as one part of a system. Combine them with momentum indicators, volume, or good ol’ fashioned risk management.
Because in the end, it’s not about how many triangles you find — it’s about how many fakeouts you avoid.
Off to you : Spotted any textbook triangles or sneaky flags this week? Or caught a pennant fakeout that wrecked your stop loss?
Drop your best (or worst) continuation pattern story below. You never know who might learn something from your chart scars.
How to Spot Flag Patterns on TradingViewLearn to identify and trade flag patterns in TradingView with this step-by-step tutorial from Optimus Futures. Flag patterns are continuation formations that help traders join existing trends by buying high and selling higher, or selling low and buying back lower.
What You'll Learn:
• How to identify bullish and bearish flag patterns on any timeframe
• Breaking down flag patterns into two parts: the flagpole and the flag
• Finding strong flagpole formations with fast, obvious price moves
• Spotting flag consolidation areas that form tight ranges
• Why flag patterns work: buyer and seller psychology explained
• Real chart examples showing how flag patterns develop and play out
This tutorial may help futures traders and technical analysts who want to trade with market trends rather than against them. The concepts covered could assist you in identifying opportunities to join strong price movements when they pause before continuing.
Learn more about futures trading with Tradingview: optimusfutures.com
Disclaimer:
There is a substantial risk of loss in futures trading. Past performance is not indicative of future results. Please trade only with risk capital. We are not responsible for any third-party links, comments, or content shared on TradingView. Any opinions, links, or messages posted by users on TradingView do not represent our views or recommendations. Please exercise your own judgment and due diligence when engaging with any external content or user commentary.
This video represents the opinion of Optimus Futures and is intended for educational purposes only. Chart interpretations are presented solely to illustrate objective technical concepts and should not be viewed as predictive of future market behavior. In our opinion, charts are analytical tools—not forecasting instruments. Market conditions are constantly evolving, and all trading decisions should be made independently, with careful consideration of individual risk tolerance and financial objectives.

$UPST Bullish Flag can Test August '23 HighIn my search for technically sound swing trade ideas I stumbled on $UPST. What we are looking at is almost a perfect technical setup of a bullish continuation flag. We have a nice breakout or "flag pole" on high volume followed by a generally controlled flag pattern down with low volume. What I really like about this setup is it is measuring to test its August '23 high almost perfectly. According to technical analysis, "flags fly at half mast" meaning they form at the midway point of the move. In order to measure the following move precisely you can measure the distance of the preceding breakout point. In this case, the breakthrough of the lower level resistance. Measuring this, I found that the following move could be around $12, putting it at $60 a share and right at the upper level resistance. Invalidation would occur with a daily close below the lower trendline of the flag. I think we could see the start of a large upside move within the next week or two. Unfortunately, we also have the election next week which does all sorts of weird things to the market as a whole. If this setup invalidates but bounces off the lower (previous) line of resistance- I will take another look.

$JASMY forming concomitant flagsTwo distinct flags can be drawn here and market is just waiting the breakout!
Targets are indicated by pink arrows!

Incoming gains for AGIX 15 min time frameGet ready for easy gains coming for Singularity(AGIX) next two projected measure moves as follows, 0.3574 followed by 0.3799 ...happy trading!

GBPNZD - LongEmbark on this potential opportunity by entering a trade on a bullish flag pattern, following the confirmation of a breakthrough to the upside. Implement wise risk management techniques by limiting your investment to no more than 1% of your account equity, while setting your take profit target based on the chart analysis.

GBPUSD - Short opportunityHi traders, lets take a look at GBPUSD on the 1h timeframe. we have price on a bearish trend. After an impulse move there is always a correction phase and currently the market created a bearish flag which is a continuation pattern to the downside. we will be looking for a sell once the candlestick closes with a bearish confirmation

GBPCAD - Bearish FlagOn GBPCAD, we have price breaking out of the rising wedge pattern to confirm a bearish trend and also a continuation pattern( bearish flag) which also indicates a continuation of the bearish trend

US 30 - Ready to drop?On US30, we have an interesting price action forming. We have a breakout of the rising wedge which also caused a change of character on the uptrend. Currently price is in a corrective phase(bearish flag) which can potentially break to the downside


USDCHF - Bearish move?On USDCHF, we have the market trading to the downside with a very strong bearish impulsive moves. Currently there is a pull back(correction phase) which can resume the prior impulsive nature once we have a change of character on the current pull back.

EURUSD - SELLWe have the presence of a bearish continuation pattern indicating a continuation of the downtrend

US 100 - Double topWe are having a double top formation on the 1H time frame with the break and retest of the neckline

GBPJPY - Long positionOn GBJPY, we are clearly on an uptrend and price has currently printed a continuation pattern for a long position

DXY - Bullish momentum this week?On DXY, price is in an overall bullish trend on the weekly and the daily but currently on a pull back on the daily time frame which makes it a downtrend on the 4H and 1H. Some a short term , we can short the DXY but overall looking for a shift of the downtrend on the lower time frame to an uptrend to correlate with the higher time frame trends

Bull flag in play in S&P 500, Target 4400+A remarkable turnaround in the US stock market yesterday yielded a bullish flag in the S&P 500. The target is 4415 although buyers are likely to face strong resistance on their way up.

GOLD - LONGPretty much strong support around the 1770's, anticipating a strong bullish move within the channel. Let me know your thoughts, trade responsibly with good risk management

NZD READY TO GET OFF THE ROPES...? 🚨🚨🚨 Hi Traders
In this post we have broken down the most recent price action on Nzd/Cad.
I want you to look at this post carefully and really spot all the critical signs that you could have used to get in on the corrections and the next stages of the reversals.
On this pair we are currently still in an impulsive phase and we are waiting on seeing a sign of exhaustion or reversal for an initial correction.
Long term I want to see Nzd really take off but for now we will be trading the correction ands waiting to see what additional price action we get.
If you have any questions regarding the technical analysis in this post let me know in the comments below and I will be sure to make an education post on any question recieved.
As always trade safely and thanks for taking the time to show me some support!
The Fx Chartist

SIKA - Flag pattern Breakout🔴DISCLAIMER
***** It's just for an educational purpose and so you must also follow your own technical analysis before taking up the trade ******
Aggressive traders enter at the breakout and conservative traders may give entry after retracement (Retracement is optional, we cannot expect every stock to take a retest after the breakout, it may also continue to have its bullish pressure after the breakout)
After reaching our targets, trail your stop loss to get maximum profit from the stock in a single trade

KIN Bullish Pennant on the daily.The Bullish Pennant is one of many chart patterns, in this case is a bullish indicator.
You can use the flagpole as an estimate for your targets, also keep in mind that the longer we take to break this structure, the harder we pump, so the possible 3x from the flagpole is a conservative estimate.

