BTC: flat chaos🧑💼Still dancing flat arround 90k.. Starting to think that this year it won't hit that 75k either shoot back up again. Zoom into H1 to see what I mean, total mess..
Trading is also in repeating patterns, any gain in any side few % up the goes back down same ammount and story repeats, no clear trend at all... 🤦♂️Anyone who hold longterm positions - its a game of nerves, one day you got mini breakthru, few hours later all collapses back.
⏸︎ In those condtions I just trading hedge, open both sides, take 100pip TP leave the other one it will turn into BE or even profit anyways.. Be careful and be patient guys!
FLAT

GOLD → Neutral price channel... Waiting for news FX:XAUUSD is testing the lower boundary of the 4060 channel and rebounding, maintaining moderate fluctuations in anticipation of key US data. Focus on 4040 - 4100...
The probability of a Fed rate cut in December has risen to 74% following comments by J. Williams
The unusual situation surrounding the Russia-Ukraine conflict means that any hints of de-escalation could trigger a correction in the metal...
The trading week will be relatively short, as Thursday and Friday are public holidays in the US, and the market may see reduced volatility.
Focus on the following news:
- PPI (forecast +0.3%) and US retail sales
- Q3 GDP and PCE index (inflation)
Gold remains sensitive to Fed comments and geopolitics. Strong data could lower expectations for policy easing. A breakout is likely after the release of inflation data and GDP. Rising odds of a rate cut in December limit downside potential.
Resistance levels: 4100, 4111
Support levels: 4040, 4024
Gold is being held within its current trading range. The last four trading sessions indicate uncertainty about the future direction. In this case, it is worth considering trading within the current boundaries first. I expect a retest of resistance and a subsequent downward rebound.
Best regards, R. Linda!

XRPUSDT → False breakout of resistance in a weak marketBINANCE:XRPUSDT faces strong resistance and forms a false breakout amid a weak market. Bearish pressure remains high...
Bitcoin failed to break through the 106K resistance and returned to the short zone, with the cryptocurrency market, including XRP, reacting with a decline... Overall, the market is in a weak phase and is not yet ready to move into strong growth. Consolidation may continue...
False breakout of resistance at 2.5530 amid a weak market. The market has no potential for continued growth, and a reversal pattern is forming, provoking a sell-off...
Resistance levels: 2.496 - 2.553
Support levels: 2.376, 2.24
A retest of the local base at 2.5 is possible before the decline continues. As part of the current movement, the market may test 2.37, but if the bulls fail to hold this zone, the coin may drop to 2.24.
Best regards, R. Linda!

BITCOIN → Flagship within the trading range BINANCE:BTCUSDT.P is trading within a wide trading range of 99K - 105K, with the market attempting to form an intermediate bottom at 101K. However, the trend is downward...
Bitcoin, within the downward trend, is rebounding from support at 101K and, against the backdrop of locally positive news, is striving towards resistance at 105300. However, the downward trend and the opening of the session far from the key zone of interest are negative prerequisites for the current situation. Within the daily rally, the potential for continued growth may be exhausted. There is a hunt for liquidity within the trading range. A retest of resistance may end in a false breakout and a decline in the trend...
Resistance levels: 105300, 107300
Support levels: 103000, 101130, 98900
The price is within the trading range, and there are no clear prerequisites for the price to break out of the current flat. Accordingly, I expect trading within these limits to continue. A false breakout of resistance (lack of momentum and potential for continued growth) could trigger a reversal of the local movement and a decline in price.
Best regards, R. Linda!

EURUSD → An attempt to reverse the bearish trend...FX:EURUSD on the daily timeframe is breaking through the resistance of the downward price channel that has been developing for two months. Confirmation of the trend reversal is needed...
The dollar has been testing support at 99.3 for several days now, and the likelihood of a further decline is only increasing. The decline of the dollar will have a positive effect on the euro exchange rate.
The currency pair is forming a battle for the 1.1577 zone, a key area of support against the backdrop of an uptrend. If the bulls keep the price above this level, it will confirm the price entering a new trading range, which in turn will open the way to 1.1667.
Support levels: 1.1577, 1.1541
Resistance levels: 1.1622, 1.1667
A consolidation of the price above the support of the new trading range and a subsequent breakout of the local maximum could confirm a trend reversal, which could trigger a rally to 1.1667 - 1.174.
Best regards, R. Linda!

EURJPY → Long squeeze before growth FX:EURJPY is forming a long squeeze and a false breakdown of support amid a sharp decline. The trend is bullish, and buyers may enter the game against the backdrop of a weak yen.
The Japanese yen is falling, giving way to the euro, which is strengthening against this backdrop.
EURJPY is forming a global uptrend, which may generally support price growth...
The currency pair is returning to its trading range after a false breakdown of support. If the bulls hold their ground above 176.600, the price may form an upward momentum.
Resistance levels: 176.6, 177.0, 177.34
Support levels: 176.37, 176. 3
The market is trying to buy back the sharp decline, and the price is returning to the long zone, forming a reversal pattern. If the bulls hold the price above the support of the trading range, the market will have a chance to grow.
Best regards, R. Linda!

GOLD XAU/USD: Wave ((1)) Near Completion - Wave 2 Zigzag vs Flat GOLD: WAVE ((1)) COMPLETE - WHAT'S NEXT?
Wave ((1)) nearly finished at ~$3,989. Next: Wave ((2)) correction
to the $4,250 area. But which pattern?
━━━━━━━━━━━━━━━━━━━━━━━━━━━━━━━━━━━━
ZIGZAG (60% Probability) Pattern: A-B-C (sharp, V-shaped)
• Wave (A): Sharp 1-2-3-4-5 impulse
• Wave (B): Brief recovery (~30-40% of wave A)
• Wave (C): Sharp impulse (~equal to A or 1.618x A)
━━━━━━━━━━━━━━━━━━━━━━━━━━━━━━━━━━━━
FLAT (40% Probability) Pattern: A-B-C (sideways consolidation)
• Wave (A): Moderate move
• Wave (B): Recovery that reclaims wave A (~80-120% of A)
• Wave (C): Normally sharp 1-2-3-4-5 impulse (~50-120% of A)
If price retraces 100% of wave 1 (above $3,956) Structure INVALID
MY BIAS: ZIGZAG
Wave 1 was powerful → Sharp corrections follow
Support: $3,956 (invalidation level)
Resistance: $4,150 - $4,200 - $4,250
IMPORTANT ELLIOTT WAVE RULES FOR WAVE 2:
━━━━━━━━━━━━━━━━━━━━━━━━━━━━━━━━━━━━━━━━
✓ Wave 2 CANNOT retrace more than 100% of wave 1 (invalidation rule)
✓ Wave 2 CANNOT be a triangle (only B and (iv) can be triangles)
✓ Wave 2 CANNOT be a combination beginning with a zigzag
(combinations only if starting with a flat)
These rules help us eliminate possibilities and confirm structure.

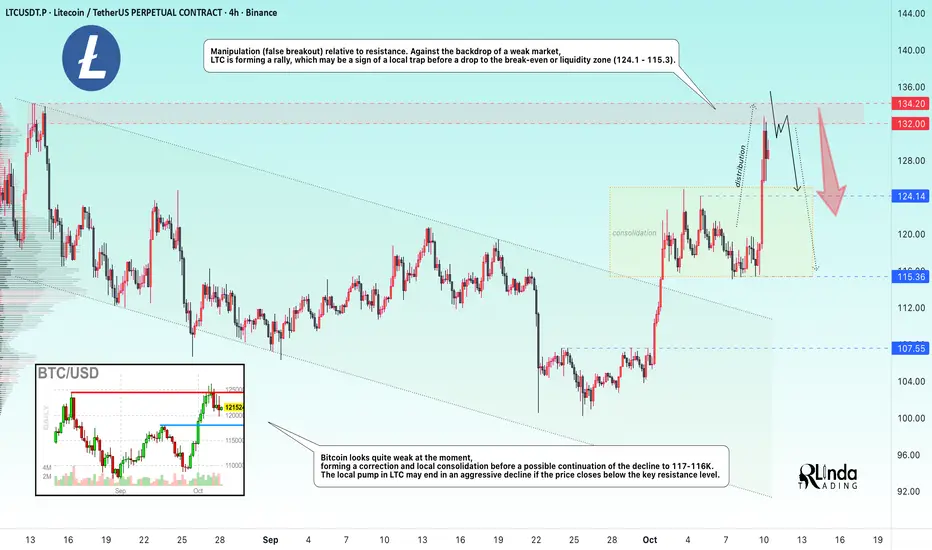
LTCUSDT → False breakout of resistance...BINANCE:LTCUSDT is forming a distribution pattern after local consolidation. The price is testing the resistance zone and forming a false breakout, but there is a but. The cryptocurrency market is in correction...
Bitcoin looks quite weak at the moment, forming a correction and local consolidation before a possible continuation of the decline to 117-116K. The local pump in LTC may end in an aggressive decline if the price closes below the key resistance level.
Manipulation (false breakout) relative to resistance. Against the backdrop of a weak market, LTC is forming a rally, which may be a sign of a local trap before a drop to the break-even or liquidity zone (124.1 - 115.3).
Resistance levels: 132.0, 134.2
Support levels: 124.14, 115.36
A false breakout of resistance, while the entire altcoin market is declining, looks like a hunt for liquidity before catching up with the main market. Accordingly, confirmation of a false breakout of the resistance zone could trigger a drop in LTC.
Sincerely, R. Linda!
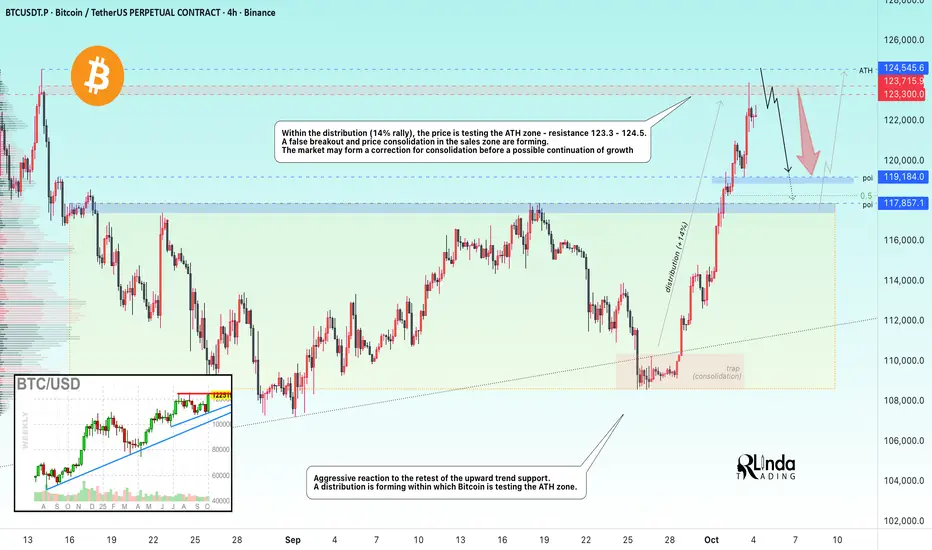
BITCOIN → False breakout of the all-time high zoneBINANCE:BTCUSDT is rising amid the US government shutdown and testing the all-time high zone and resistance at 123.3K - 123.7K. A false breakout has formed and the market is moving into local consolidation.
The price is reacting aggressively to the retest of the uptrend support. A rally is forming, and Bitcoin is testing the ATH zone. As part of the distribution (14% rally), the price reaches an important resistance zone, behind which lies a liquidity pool - 123.3K - 124.5K. However, the growth ends with a false breakout and subsequent price consolidation in the sales zone. To break through such a strong zone, the market needs significant consolidation, which is currently lacking, and the news that caused the price to grow so strongly has already partially exhausted its potential. Thus, the market may move into consolidation, correction to accumulate potential, or wait for the next bullish driver.
Resistance levels: 123.3K, 123.7K, 124.5K
Support levels: 119.2K, 117.8K
I do not rule out the possibility of a retest of 123.7 - 124.5, but technically, on Friday, the market began a sell-off (profit-taking), forming a sufficiently long shadow on the daily candlestick. In the medium term, I expect a correction to the local break-even and imbalance zone of 119K - 117K before another attempt at growth is made
Best regards, R. Linda!
USDJPY → Gap and retest of resistance on a neutral trendThe Japanese yen opens with a gap in the Asia-Pacific session and forms a distribution, within which it tests the resistance zone of 149.93 - 150.79.
The dollar is rebounding again, provoking a corresponding reaction in the markets. However, based on fundamental data, the decline may continue after the pullback.
Gap in USDJPY, distribution and entry into the resistance zone at high speed, there may not be enough potential for continued growth. There is no trend, the price is in a sideways market. A false breakout of 149.93 may trigger a correction towards the lower boundary of the gap.
Resistance levels: 149.93, 150.79
Support levels: 148.76, 148.09
If the currency pair is unable to continue growing, then a false breakout of resistance can be considered. A return of the price to the range on D1 may trigger a decline to support.
Best regards, R. Linda!

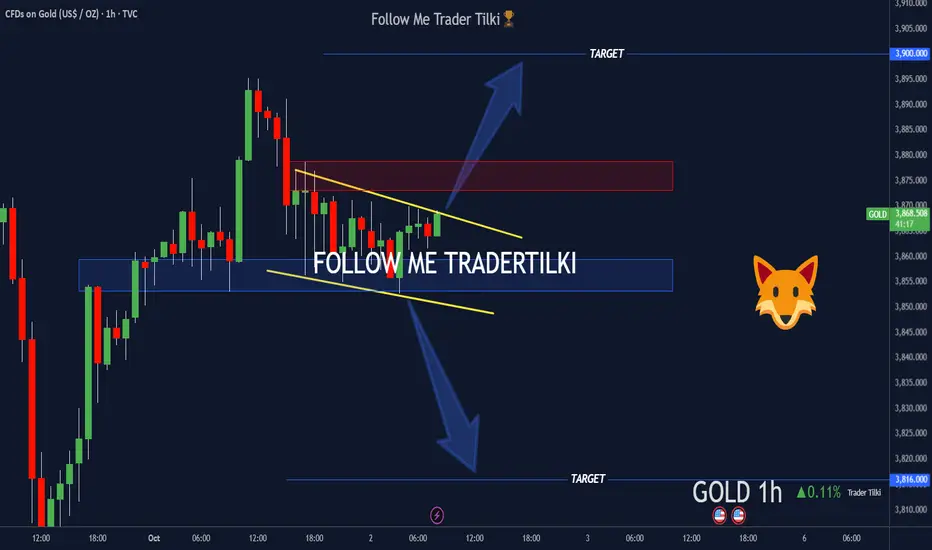
Trader Tilki’s GOLD-XAUUSD Breakdown: Silent Storm Brewing📊 XAUUSD – GOLD Critical Breakout Analysis
Hey Guys,
By popular demand, I’ve prepared the latest breakout analysis for XAUUSD-GOLD. Your support means a lot to me, so I’m sharing this breakdown based on your requests.
🔹 Buy Scenario
If we get a candle close above 3878.0, the first target will be 3900.0.
🔹 Sell Scenario
If price closes below 3850.0, then gold’s target level will be 3816.0.
Every single like is my biggest motivation to keep sharing these analyses.
Thanks to everyone showing support 🙏
NZDCAD → A false breakthrough will trigger a decline FX:NZDCAD is forming a countertrend correction with the aim of retesting key resistance and the liquidity zone amid a global downtrend.
A reaction to the support zone is forming. The price is recovering, but within the global downtrend. The countertrend movement may end in the resistance zone of 0.811 - 0.8125
The global trend is downward, but we are seeing a rebound within the retest of the channel support. There is a fairly large pool of liquidity ahead, which is capable of stopping the price from rising at a high speed. A false breakout of 0.811 - 0.8125 could trigger a decline.
Resistance levels: 0.811 - 0.8125
Support levels: 0.8056, 0.8030
A false breakout, consolidation below the specified zone, and a price close below the level could trigger a further decline.
Best regards, R. Linda!

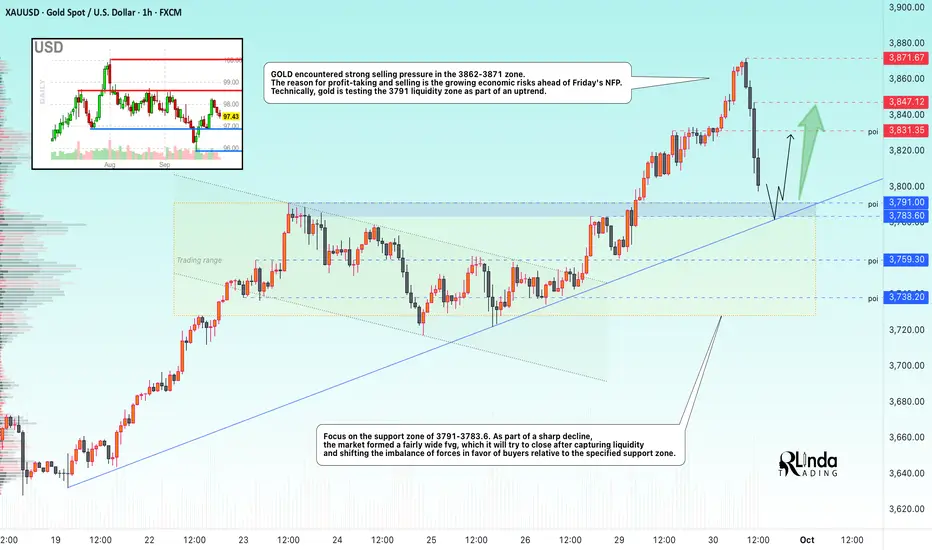
GOLD → Liquidation, but there is still a chance for growth...FX:XAUUSD has reached a new all-time high of 3871.6, marking its best month in 14 years (+12% in September). However, against the backdrop of high risks, the market is experiencing profit-taking and a deep correction. What next?
The high probability of a shutdown from October 1 is weighing on the dollar. The probability of a Fed rate cut in October is 90%, despite cautious comments from the Fed.
New tariffs on timber and furniture (from October 14).
Data from China: PMI growth (Manufacturing to 51.2). All this supports the bullish trend in gold. However, the end of the quarter, anticipation of NFP (but in the event of a shutdown, the publication of employment data will be suspended).
Technically, as part of the correction, the price is testing the upward support line, and the price reaction to the 3790-3780 zone will give hints about further movement...
Support levels: 3791, 3783
Resistance levels: 3831, 3847
A false breakdown and the formation of a reversal pattern relative to the specified support zone could trigger a recovery phase within the bullish trend. However, a quick return to support could trigger an attempt to break through and correct to 3759-3738.
Best regards, R. Linda!
GBPUSD → Will the bulls be able to maintain the bullish trend?FX:GBPUSD slows down in the 1.334 zone amid a sharp decline. The market is testing trend support against the backdrop of a bullish run in the DXY due to confusing data from Powell...
The dollar continues its countertrend correction and is approaching resistance as part of the rally. A fall in the DXY will resume the growth of currency pairs.
The pound sterling is currently testing trend support and the trading range. The focus is on the 1.334 - 1.337 zone. If the bulls keep the price above this range, it will confirm the false breakdown and may trigger growth within the bullish trend.
Powell has confused the market with his statements and further policy. We have been observing the market's reaction over the past few days...
Support levels: 1.334, 1.3315
Resistance levels: 1.337, 1.346
I do not rule out the possibility of a retest of 1.3315, but a return of the price to the range and consolidation of the price above the 1.334-1.337 zone will confirm the false breakdown and may give buyers hope that this, in turn, could lead to a recovery.
Best regards, R. Linda!

GBPAUD → False breakdown. Return to bullish trend FX:GBPAUD is forming a false breakdown of support and returning to a bullish trend. The market has seen a breakdown of the local structure, signaling the end of the correction.
The pound sterling has consolidated above the consolidation resistance, thereby showing bullish signs, which has a positive effect on the GBPAUD currency pair.
False breakdown of the trend and support of global consolidation. The price returned to the range and closed in the long zone. Bulls may provoke continued growth after the formation of local patterns...
Resistance levels: 2.0746, 2.103
Support levels: 2.04788, 2.0301
Consolidation of the price above support and a breakout of local consolidation may trigger further growth. The trend is bullish, targets are indicated on the chart.
Best regards, R. Linda!

GOLD → As prices continue to rise, so do the risks...FX:XAUUSD continues to rise, setting new highs. New ATH 3659. Focus on current consolidation, as the structure remains bullish...
Gold hit a new record high, surpassing $3,650, amid a weakening dollar and growing expectations of aggressive Fed policy easing. However, overbought conditions and profit-taking risks may limit further growth.
The USD is at 7-week lows due to fears of stagflation and deteriorating employment data. The probability of a rate cut on September 17 is 89.4% (25 bps), with a chance of 50 bps. Markets are expecting more than two cuts in 2024.
Risks for gold: “Sell the fact”: If the NFP revision turns out to be weak (as expected), investors may start to take profits.
Technically, gold remains bullish, but a near-term correction is likely due to technical factors and a possible reaction to the data. The long-term trend remains bullish thanks to a weak USD and the Fed's dovish policy.
Resistance levels: 3657, 3675, 3700
Support levels: 3636, 3628, 3620
Gold is consolidating. At the moment, the fundamental background is stable, and no news is expected today except for those that are impossible to predict (comments, rumors, etc.). Before further growth, gold may test the support area and the liquidity hidden behind it.
Best regards, R. Linda!

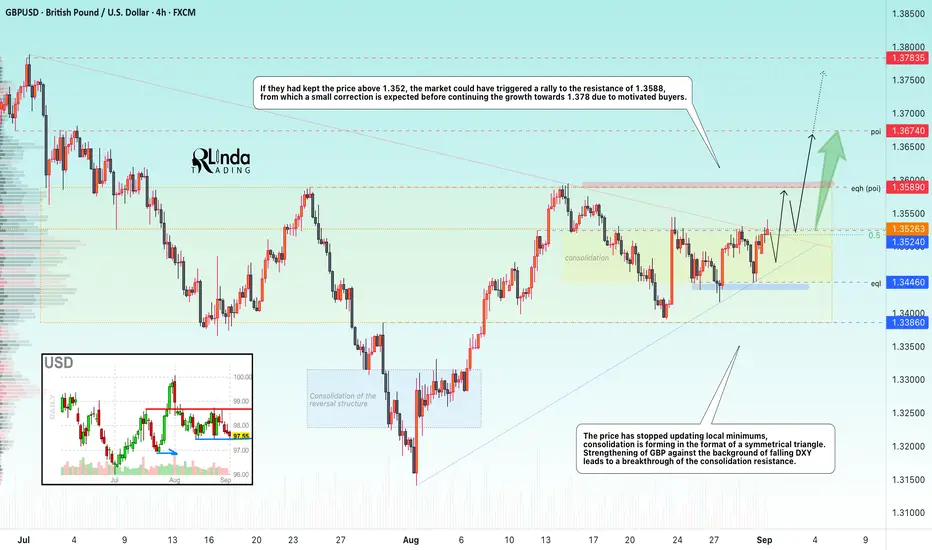
GBPUSD → Retest resistance for a breakout. Distribution?FX:GBPUSD is attempting to break through the resistance of the symmetrical triangle consolidation pattern, which is a continuation pattern of the main bullish trend.
Against the backdrop of stagnation and weakening of the dollar index, the GBPUSD price has stopped updating local lows, and consolidation in the form of a symmetrical triangle is forming. The strengthening of the GBP led to a breakout of the consolidation resistance, and if the bulls can stay above 1.352, then the market may trigger a rally to the resistance at 1.3588, from which a small correction is expected before continuing to grow to 1.378 thanks to motivated buyers.
Resistance levels: 1.3589, 1.3674
Support levels: 1.3524, 1.3446
In the 1.3525 zone, there may be a prolonged struggle for the buying area (above resistance). If the bulls manage to stay above the resistance conglomerate, this will confirm the fact of a resistance breakout and the end of the downward correction, which may trigger a continuation of the global trend and price growth to 1.378.
Best regards, R. Linda!
GOLD → Consolidation and news. What are the chances for growth?FX:XAUUSD is consolidating in a symmetrical triangle pattern. Market uncertainty remains high. The global trend is bullish, while the local trend is neutral. What can we expect from gold?
Gold is falling ahead of Powell's speech in Jackson Hole. The dollar is strengthening on strong US economic data (housing sales and PMI growth), which reduces the likelihood of an early easing of Fed policy.
Key factors:
Powell may confirm a cautious approach to rate cuts. The probability of a rate cut in September has fallen to 75%. The rise of the dollar as a “safe haven” is putting pressure on gold
Scenarios after the speech:
Hawkish tone from Powell → dollar rises → gold falls below $3300.
Soft signal → dollar correction → gold recovery
Technically , the gold casino continues and it is difficult to determine in advance which way the symmetrical triangle will break, but if we bet on a bullish trend and the likelihood of an imminent interest rate cut, the most likely scenario is a rebound from the support zone followed by a breakout of resistance and a rise to local levels
Resistance levels: 3350, 3358, 3370
Support levels: 3323, 3320, 3315
A false breakout of the key support level, which is being defended quite aggressively by the bulls, could trigger an active recovery phase. However, it is important to keep an eye on Powell's speech, as well as Trump's, who will also be commenting this afternoon.
Best regards, R. Linda!

HYPEUSDT → Correction for consolidation before ATH breakoutBINANCE:HYPEUSDT.P looks quite strong and is just a few cents away from reaching its ATH. The coin needs to build up its potential to reach its target and break through a strong resistance level...
The cryptocurrency market feels quite confident. Bitcoin's growth is having a positive effect on altcoins. HYPE almost tested its ATH as part of an upward movement, but encountered pressure. The price did not reach its target (ATH) and entered a correction phase. Most likely, this is an MM maneuver to collect liquidity...
As part of the correction, the market may test the consolidation located below. Focus on the support area 0.5F - 45.85
Resistance levels: 49.88
Support levels: 45.85, 44.27
The most likely scenario is a retest of the support and interest zone. A false breakdown and the bulls holding the price above the level, i.e. in the zone of interest, could attract active buying, which in turn could trigger a continuation of the growth within the global bullish trend.
Best regards, R. Linda!

GBPAUD → Attempt to break through resistance. Rally?FX:GBPAUD is preparing to accelerate its growth within the global bullish trend. A breakout of the local channel resistance is forming...
Against the backdrop of the falling dollar, GBP is taking advantage of the opportunity and entering a phase of active growth. GBPAUD is emerging from local consolidation. The movement is accompanied by bullish momentum and a breakout of the upward channel resistance. Technically, after retesting (forming) the upper channel boundary at point 2, consolidation is forming. There is no decline, which indicates the bullish potential of the market. The breakout of the overall figure's resistance confirms the buyer's intentions...
Resistance levels: 2.0698, 2.0756, 2.085
Support levels: 2.06658, 2.06537, 2.0593
If the bulls keep the price above the specified zone after the breakout, then in the short and medium term, the price may continue to rise to the resistance of the trading range...
Best regards, R. Linda!

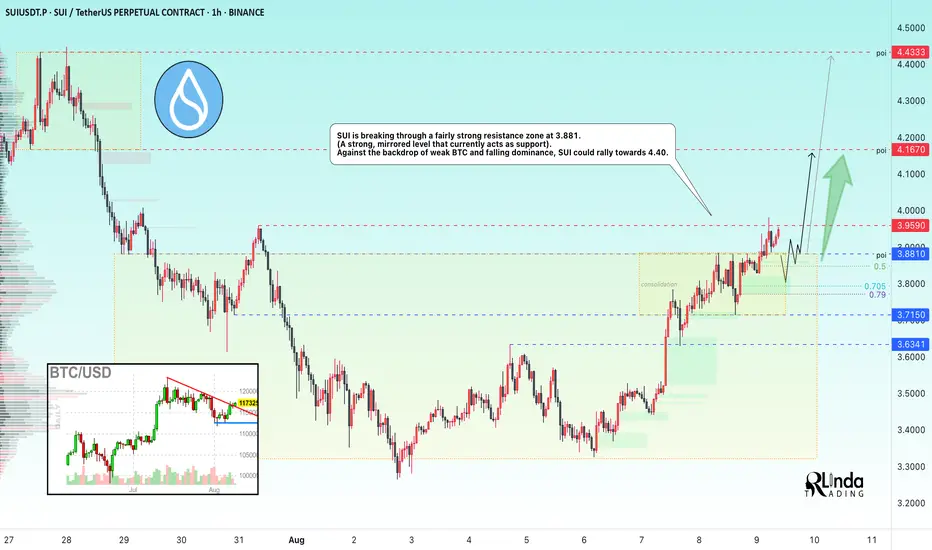
SUIUSDT → Resistance breakout and entry into the buying zoneBINANCE:SUIUSDT is breaking out of its trading range and local consolidation upward. Consolidation above the mirror level could trigger a continuation of the rally to 4.4 - 5.0.
Bitcoin has been trading in the red since the start of Saturday's session, but is gradually recovering. At this time, the altcoin market is rallying, while the Bitcoin dominance index is updating its decline
As for SUI, the coin is in a bullish trend both locally and globally, but ahead lies the 4.45 barrier, which separates the price from a rally to ATH. The coin is breaking through a fairly strong resistance zone at 3.881. (A strong, mirror level, which currently acts as support).
Resistance levels: 3.959, 4.167
Support levels: 3.881, 3.715
Since the price has entered the buying zone, there is a possibility of a retest of the mirror level and the liquidity zone that has formed below the specified support. If the bulls hold their defense above 3.88 - 3.9, then in the short and medium term, the price could show good growth...
Best regards, R. Linda!
USDCAD → Short squeeze for further declineFX:USDCAD is forming another short squeeze relative to the global price range ahead of a possible decline within the global downtrend.
After breaking through the resistance of the global trading range, USDCAD was unable to continue its upward momentum. The price returned to the range, under strong resistance, and is forming a pre-breakdown base for a possible decline. The trigger in our case is support at 1.3762. The dollar is stagnating, trading below strong resistance. A decline in the dollar could trigger a fall in USDCAD
Support levels: 1.376, 1.3695, 1.3629
Resistance levels: 1.3774, 1.3809
The market structure is quite weak, both globally and locally. In addition, against the backdrop of an expected rate cut, the dollar may continue its downward global trend, which may also affect the price of the currency pair, which has formed a false breakout of resistance...
Best regards, R. Linda!

Double Trap on USTEC: Sell Zones Locked In!Hey Guys,
I’ve prepared a NASDAQ 100 / USTEC 100 analysis for you. I’m planning to open sell positions from two key levels:
🔹 First entry: 23,290 or 23,164
🔹 Second entry: 23,397 – 23,450
🎯 Target levels:
TP1: 22,800
TP2: 22,666
Every single like from you is my biggest source of motivation to keep sharing these analyses. Huge thanks to everyone who supports with a like! 🙏
