DXY Neutral -BearishCAPITALCOM:DXY
Quick read / bias
Near-term neutral → biased bearish.
Price has failed to produce a clean reversal from the large consolidation at the top, shows a series of lower-highs and liquidity hunts (marked ellipses / Imbalance repairs on the chart), and a visible “downside pressure” supply region above. The path of least resistance is down unless price reclaims the supply/consolidation zone above ~98.6–99.2.
------------------------------------------------
Key levels (from the chart)
Major consolidation / supply: ~99.2 – 99.8 (big-picture resistance).
Downside pressure / mid supply: ~98.5 – 98.8 (area to sell into).
Recent micro highs: 98.39, 98.19, 97.99 (loci for liquidity).
Current price (chart right): ~97.18.
Recent local low/liquidity grab: 96.834.
Weekly void / structural bottom to watch: 96.478 (labelled on chart).
Invalidation for bearish thesis: close/hold above 99.2 (reclaim of consolidation).
------------------------------------------------
How I read the structure (step-by-step)
Price spent time in a higher consolidation zone and then failed to reverse higher — that is a distribution / supply footprint rather than demand.
The chart shows several short liquidity hunts above swing highs (grey ellipses) and subsequent strong selling — classic stop-hunts into supply then continuation lower.
Imbalances / small supply boxes on the chart mark places the market tends to retest before continuing — these are high-probability sell zones on rallies.
The sequence of lower highs and a recent push down to ~96.83 (buyer defence) gives a local support but not yet a valid reversal signal. Until price chops through the weekly void (96.478) or reclaims the supply, expect range/biased-down behavior.
------------------------------------------------
Trade setups (actionable — use your 5-min/1-min workflow)
I’ll give two primary setups: a higher-probability short (sell the rally) and a contrarian long (mean-reversion). Use 5-min to identify displacement into the zone and 1-min for the exact micro reversal entry.
------------------------------------------------
Setup A — Primary: Short on rally into supply (preferred)
Why: Market structure + downside pressure + Imbalance above make rallies into supply favourable.
Area to enter (limit or wait for 1-min reversal): 98.00 – 98.20 (ideal limit ~98.10).
Stop loss: 98.45 (just above the 98.39 / structure swing and above the Imbalance top).
Targets (scale):
T1: 97.00 — first logical demand and psychological level.
T2: 96.50 — deeper swing support / mid structural level.
T3: 96.478 — weekly void bottom (big target if momentum continues).
Risk / reward (example entry 98.10 → stop 98.45):
Risk = 0.35 index points.
R:T1 ≈ 1.10 / 0.35 ≈ 3.14:1.
R:T2 ≈ 1.60 / 0.35 ≈ 4.57:1.
R:T3 ≈ 1.622 / 0.35 ≈ 4.63:1.
Trigger: 5-min displacement into the 98.0–98.2 zone, then 1-min rejection pattern (pin bar / engulf / two-bar reversal) and ideally a filled Imbalance or wick extension that fails. Enter limit at Imbalance top or use a short after 1-min confirmation.
------------------------------------------------
Setup B — Secondary: Mean-reversion long (countertrend)
Why: Buyers defended the 96.83 area previously; a clean, verified micro reversal at lower support can produce a quick retrace. This is lower probability vs the sell-the-rally plan and should be sized smaller.
Area to enter (limit/1-min confirmation): 96.75 – 96.95 (example limit 96.85).
Stop loss: 96.45 (below the 96.48 weekly void and the local wick).
Targets (scale):
T1: 97.40 (near recent chop / first structure).
T2: 97.99 (previous micro high).
T3: 98.39 (if momentum shifts to reclaim structure).
Risk / reward (example entry 96.85 → stop 96.45):
Risk = 0.40.
R:T1 ≈ 0.55 / 0.40 ≈ 1.38:1.
R:T2 ≈ 1.14 / 0.40 ≈ 2.85:1.
R:T3 ≈ 1.54 / 0.40 ≈ 3.85:1.
Trigger: Look for a 5-min exhaustion and 1-min clean micro reversal (two-bar bullish rejection) ideally with buy volume or a wick that holds. Keep size smaller than on shorts.
------------------------------------------------
Intraday scalp idea (quick)
Long scalp on a 1-min reversal after a displacement down to ~96.83 with tight stop under the wick (e.g. 5–8 ticks) and target 97.20–97.40. Use only if price shows clean microstructure and momentum.
Trade management rules
Positioning: Risk a fixed % per trade (e.g., 0.5–1% of account) and size accordingly. The short setup has high RR — size to risk tolerance.
Partial take: Take ~50% at T1, move stop to breakeven, let remainder run to T2/T3.
If price stalls at T1: tighten stop to lock profit or exit if structure shows weakness.
If price breaks and holds above 98.60 / 99.2: exit shorts and flip to neutral/bullish plan — the initial bearish thesis is invalidated.
Use your timeframe combo: identify the displacement on 5-min, execute 1-min entry confirmation.
------------------------------------------------
Invalidation / alternative scenario
Bearish invalidation: clean, sustained close above 98.6–99.2 (consolidation re-claim) — if that happens, the market likely shifts to bullish and short ideas should be abandoned.
Bullish trigger: rally above 99.2 with follow-through and a higher low -> targets back toward 99.8.
------------------------------------------------
Final prediction
Over the next sessions I expect failed rallies into 98.0–98.6 to be sold, which should gravitate price toward 97.00 → 96.50 → 96.48 if momentum confirms. Countertrend longs are possible as scalps/swing trades off 96.8–96.48, but they should be treated as lower-probability and sized smaller. If price instead reclaims and holds >99.2, the bearish bias is invalidated.
Foextrading

Think Like a Pro: Trade with Discipline, Not Emotion **Taming Greed: The Secret to Long-Term Trading Success**
Trading is a battlefield of emotions—**excitement, fear, hope, and greed**. Among them, **greed is the silent killer**, pushing traders to overtrade, overleverage, and chase the market, ultimately leading to disaster.
As the saying goes:
📉 **“Bulls make money, bears make money, but pigs get slaughtered.”**
**Why Greed is Your Worst Enemy**
Fear may hold you back, but **greed pushes you into reckless decisions**. It makes you **ignore your trading plan, risk too much, and hold losing trades for too long**—all in pursuit of bigger gains.
But here’s the truth: **The market rewards patience, not desperation.**
**How to Keep Greed in Check & Trade Like a Pro**
🔥 **Follow a Strict Trading Plan**
A well-defined **plan is your shield against impulsive decisions**. Know your entry, exit, and risk before placing a trade. **Discipline beats greed—every time.**
📊 **Master Risk Management**
Avoid the temptation to **bet big for quick gains**. A strong **risk strategy protects your capital** and ensures survival in the long run. The goal isn’t just to win—it’s to stay in the game.
⏳ **Say No to Overtrading**
More trades don’t mean more profits—**it usually means more losses**. Trade **with precision, not emotion**. If you’re trading just for the thrill, **you’re gambling, not investing**.
**Success = Patience + Discipline**
Greed is an illusion—it promises wealth but delivers ruin. The real path to trading mastery lies in **consistency, control, and calculated risks**.
💡 **Trade smart. Stay disciplined. Build wealth the right way.**

USDCAD Bank Money Heist Plan To Become a Rich TraderMy Dear Robbers / Traders,
This is our master plan to Heist USDCAD Bank based on Thief Trading style Technical Analysis.. kindly please follow the plan I have mentioned in the chart. Our target is Red Zone that is High risk Dangerous Level, market is overbought / Consolidation / Trend Reversal at the level Bearish Robbers / Traders gain the strength. Be safe and be careful and Be rich.
Note: If you've got a lot of money you can get out right away otherwise you can join with a swing trade robbers and continue the heist plan,
Loot and escape on the target 🎯 Swing Traders Plz Book the partial sum of money Use Trailing Stop To Protect Looted Money and wait for next breakout of dynamic level / Order Block, Once it is cleared we can continue our heist plan to next new target it will update after the Breakouts.
support our robbery plan we can easily make money & take money 💰💵 Join your hands with US. Loot Everything in this market everyday.

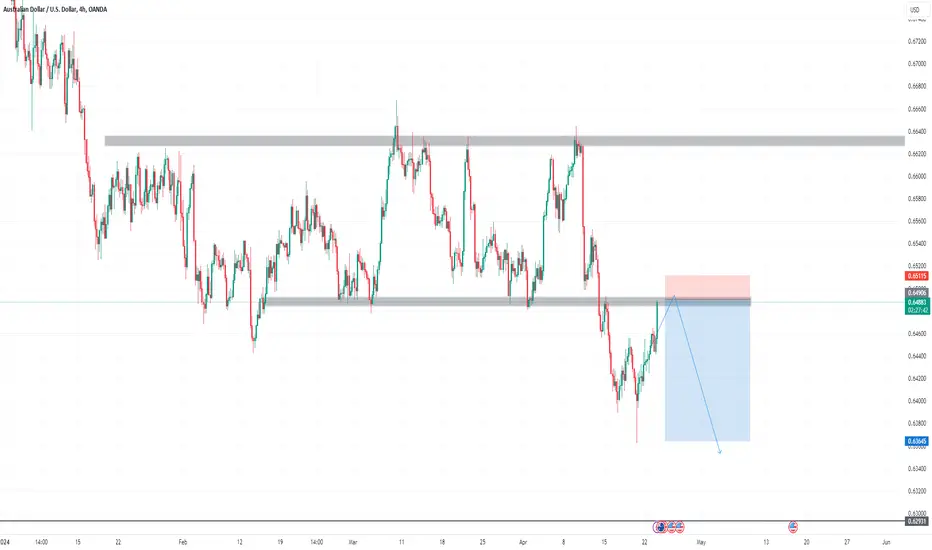
AUD USD TRADE SETUPAUD USD is currently retesting a major key support level.
Waiting for candlestick confirmation patterns to get a sell entry
AUD USD TRADE SET UP AUD USD TRADE SET UP,
AUD USD has formed a head and shoulders pattern on the 1hr timeframe, we just had a break of the neckline, and need to wait for a retest to get a valid entry for a sell

Potential CADCHF longNice higher TF range formed.
Support has held over a number of weeks, effectively creating a tripple bottom.
Price consolidated for a few days so looking for some bullish momentum now to go long.

EUR/CAD Potential Bullish Momentum on the HorizonEUR/CAD returned to the Fibonacci 0.618 level after the previous uptrend, reaching a significant support and ascending trendline. From here, I expect further upward movement towards higher key levels. On lower timeframes, I'm looking for confirmation signals to go long.
1D:
If you find it useful, like, follow, share!
Happy trading!

GoldViewFX - MARKET UPDATEHey Everyone,
This chart idea has been playing out to perfection level to level. We tracked this movement all the way to our retracement range and then our Bullish targets with our final Bull target at 2005 completed today - BOOOOOOM!
2005 is a structure weighted resistance highlighted on the chart and will need a EMA5 cross and lock to open the upper range, as highlighted. This failed to cross, which followed with a nice push down back into the range.
We are likely to see price range between both the weighted support and resistance structure until one breaks and then we can track again level to level in the next structure.
We remain Bullish with our long term plans and will continue to track the price level to level when buying dips.
BULLISH TARGETS
1989 - DONE
1995 - DONE
2005 - DONE
EMA5 CROSS AND LOCK ABOVE 2005 WILL OPEN UPPER LEVELS UPTO 2O25
BEARISH TARGETS
1977 - DONE
EMA5 CROSS AND LOCK BELOW 1977 WILL OPEN THE SWING RANGE
SWING RANGE
1954 - 1940
As always, we will keep you all updated with regular updates throughout the week and how we manage the active ideas and setups. Please don't forget to like, comment and follow to support us, we really appreciate it!
GoldViewFX
XAUUSD TOP AUTHOR

US30 LONGUs30 is currently in a decisive zone. we could see series of rejection at the left hand side. a possible rejection in favour of the bulls is expected at the zone with target at 31996 price level and ultimately 32150 and 32200 zone

GBPUSD Wave analysis short termThis forex pair has been in uptrend degree structure.Currently the micro degree impulse trend has been completed and now the new trend impulse has target the target for it is 1.2546.

EURCHF Sell BAISWe have a sell bias on this setup. Price cleared liquidity at our POI and we took a sell

GOLD PREDECTION netural zoneAll the entries should be applied if all the fundamentals and technical rules are applied.
this is just an trade setup for the possiabilites id these supports and resistances are broken and commentary will be in private.

GBPUSD DIRECTIONAL BIAS Making early entries in the market based on structural push up and out is one tool we hold to heart here at our analytical center.
Follow the arrows to make a profitable trade entry when price breaks through the levels where the arrow points opposite.

⭕️SELL GBPJPY ; Its time to sell🧐🔰You see the analysis of the GBP against the Japanese Yen in Daily ( GBPJPY , D1)❗️🔎
🔰SELL Limit GBPJPY at 164.150
✅TP ; 157.300
❌SL ; 166.700
🔰Considering the price being in the range of white downtrend line and supply range, selling in this area seems reasonable. The target is placed at the confluence of the uptrend line (white dotted line) and the orange support line 🧐
⚠️⚠️Please observe capital management and open a low volume transaction❗️❗️
I hope this analysis is useful for you🙏🏻🌹
📌Please introduce the "TRADER STREET" to your friends 🙏🏻
_______________________📈TRADER STREET📉________________________

EURUSD SHORTS 📉📉📉As i told i would like to LONG USD this week, a perfect opportunity present on EU only if price reaches 1.13500 where we have an important sell area, imbalance fill on h4 + bearish orderblock all of them being located in a premium area on fibonaci that sets perfect sells entry. The market structure is bearish on HTF and we will go with the FLOW not AGAINST. DXY is bullish on HTF.
What do you think ? Comment below.. 📉📉📉

EUR/USD Might be heading to 1.1200 - Slumpy rideThe Euro has been on a bearish Range, which gives an idea of how investors has been skeptical in their decision on euro.
But the last week Thursday Spike from the 1.1590 overly tested support level, which was then furthered by a very slumpy correction of over 170point on Friday that later got pushed back at 1.1535, reveals that the sellers are very active in the market and will be willing to push the market towards the downward axis of the market as long as their selling power could take them.
The overall outlook on EUR/USD is BEARISH and this would be confirmed by a break below the 1.1530 Support zone which ultimately open a window for the sellers to drive the price lower, probably to 1.1200, and if possible further below.
WatchOut!

GBP/JPY strong sellGBP?JPY market break a strong trend line and create a double bottom pattern, then market breakout double bottom pattern. Finally market try to retest double bottom resistance gone..so its clear if the market retest the resistance gone then market going to seller area.
Thank you so much.

EURJPY SELLFOREX SIGNAL:
📊EURJPY 📉 SELL 129,87
⚖️RR 1:3
📌SL 130,43
✅TP 129,67
✅TP 129,31
✅TP 128,81
TLGM: TRANSPARENT SIGNALS


RESISTANCE 1686 GOLDResistance at 1686, where the main uptrend meets with the secondary downtrend formed and with a resistance that the price had several months ago. Good moment to buy in the long term.

CADJPY LONGAS you can price broke the channel with a nice impulse and on the retest of the channel we can see a nice rejection on the 30min timeframe.

chfjpyThe top that make and drop is a resistance level from years ago which it no easy to break up. SELL IT MY POSITION.

Forex Analysis on CAD/JPY - ICT ForexThe CADJPY is bullish in the long run but there might be a little retracement to the 50% of the H4 bullish order block correlating with the H1 bullish orderblock as well. After taken out liquidity from the downside it began to push up. But note, there is a lot liquidity lying on the downside which price action might take out. But I actually expect it to return to the H1 order block for the procession of the bullish move. Notwithstanding there might be a drawdown because of the liquidity laying at the bottom.
