GBPJPY ForecastMore selling Expected. Trade Carefully. Trade in Harmony with the trend, do not go against the flow of the trend.
Forecastingtechniques

BITCOIN and the 800 EMA- What You should know!Padawans,
Bitcoin has been reacting to the 800 Ema since the 24th of January 2022. Most people like to use the 50, 100, 200 day MA`s or EMA`s. However I like to use the 800 day EMA.
On the 9th of April 2024, Bitcoin broke the trendline formed on February 24th, it retested that trendline Yesterday on the 10th of April and was rejected. However what I want you to take note of something:
If we take a look at the chart we will notice on the 24th of January we had a test of the 800 EMA followed by the evaporation of selling pressure followed by a move to the upside resulting in a green candle
On the 24th of February again there was move downwards towards the 800 day EMA, followed by the evaporation of selling pressure followed by a move to the upside resulting in a green candle and a new trendline being formed
Take note that with each of the above mentioned events we are forming Higher Highs
So what Am I Looking For
First a test a retrace to $38735, which is 0.236 of the Fibs and also a convergence at that point with the downward trendline
Then I am looking for a wick to make a move downwards towards the 800 ema and if the same confluence of events happen as happened on the 24th of January and 24th of February
then, in my mind you will have confirmation of the resumption of an uptrend and is this happens
Padawan- Hand me my Lightsaber

Total Crypto Market Capitalization This is a projection with the current metrics that the graph is inputting in this particular time/space

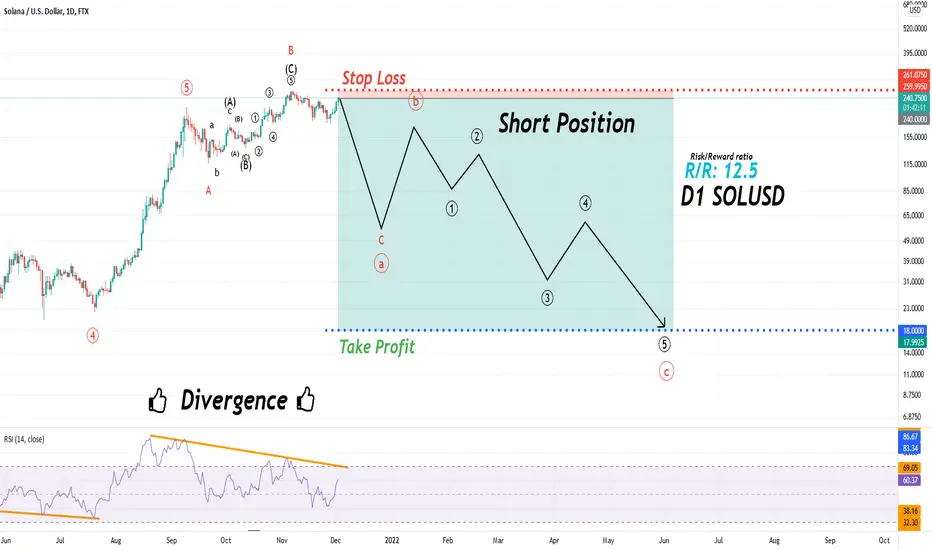
SOLUSD Trend and Wave analysis (Wave Elliot + Divergence) Big drop in prices on cryptocurrencies.
It is in the C wave and initially the price fall with the Elliott wave. In this analysis, it seems that the price will move down. The Stop loss and Take profit are marked on the price chart.
The price trend is down and there is a divergence in the charts. In many cryptocurrencies, the price growth seems to be over.
The wave you see in the future price on the chart is a schematic of a possible price trend and will not be formed just to clarify the possible price movement.
This is a personal analysis and should not be considered a criterion for buying or selling. Please pay attention to the Take profit and Stop loss. Cryptos show emotional and unforeseen price behavior.
I use Elliott and Price Action in my analysis, and my analysis is based on that. The structure of the Elliott wave count is complex and different patterns are formed in the chart, so there is a possibility of a change in the price movement of the price.
Next 10 Days of BITCOIN Price PivotsExperimental Price Pivot Method.
The red lines are from a slightly different method than the regular ones.
There are some very important pivot dates coming over the next coming weeks.
Nov 30/Dec 1....and Dec 3/4 and Dec 7th ...you may want to pay particular attention to.
This isn't perfect or exhaustive but perhaps someone will find it useful. Good luck.
Click the play button to see how it goes.
I'll post a much larger and more extended one later...this isn't the one I work from, although that one is a work in progress as well.

AUDNZD POTENTIALAs we can see
Audnzd made falling wedge pattern and he was break it and try to making new bullish structure
here we go , we can see the first higher high and higher low after he breakout falling wedge
and also we can see the price still respect at support level as well
so for me , ii'l waiting for confirmation breakout and make next higher high
we can entry and waiting the best confirmation on lower timeframe
thankyou ~

EURGBP Long positionAfter sideway with a high ATR, I think EURGBP needs to do something truly huge. Maybe a pump wave or... dump wave? Based the basically to reading the Volume Profile, I think EURGPB has potentially to pump to the 0.868xx area. What is your oppinion. Let's share with me your view and following this trade together.

Forecast XAUUSDAfter reacting the price to one of the resistance levels indicated in the chart and After confirmation price You can enter into a buy position

BTC near-term projectionHere in this simplistic post we are on the 1-Month chart. A proper Fibonacci retracement shows that the golden zone for longs has indeed been rejected once so far into this deep fall of BTC. Usually support is tested about 3 times before making a bigger move up if bullish which I believe it is. So far a very health correction to BTC long bullish blue candles on the month chart. I expect the currency to quickly recover lost ground in the coming weeks if it respects the 0.5-.618 zones. If .764 red zone is breached, then all is lost and further red candles will arise.

$UAVS AgEagle Aerial Systems, Inc. designs, develops, produces, distributes, and supports unmanned aerial vehicles for the precision agriculture industry in the United States and internationally. It offers FarmLens, a subscription based cloud analytics service that processes data collected with a drone for use by farmers and agronomists; HempOverview, a software-as-a-solution web- and map-based technology platform to support the operations of domestic industrial hemp programs for state and tribal nation departments of agriculture, growers, and processors; and ParkView, a proprietary aerial imagery and data analytics platform for assessing and supporting sustainability initiatives involving municipal, state, and federal public parks and recreation areas. The company was founded in 2010 and is headquartered in Wichita, Kansas.

$EEENF Sky High #88E is pleased to provide the following update related to the Merlin-1 drilling. Whilst there is still work to do to confirm a discovery, the results to date are encouraging...

XAUUSD Gold Spot / U.S. Dollar OANDA XAUUSD Gold Spot / U.S. Dollar OANDA continuation of choppy downtrend channel...

GBP/NZDGood day Traders !! On this multi-timeframe analysis we will make a full breakdown of this pair.
Monthly : We have an "M" formation and we do expect a retracement to the neckline which is in confluence with the FIB level 0.618 .
Weekly : Wa are currently in an acsending channel and we are creating an overextended W formation and we expect price to move higher. .
Daily : "W" Formation completed after the retest of the neckline and we expect a continuation to the upside .
COT : Institution have been Increasing net positions in GBP since they added more than 6700 long positions and closed to 4600 Short position during the last report.
From an NZD perspective we are looking at a steady NZD against a strong GBP on the short term .
8H: Bullish environment . we are printing HH and HLs.
MACD: Bullish environment
EMAs : Cut for long
We have two trading setups with two potential targets in the mid-long term.
Now if you enjoyed this analysis smash that like button and share. If you have a different opinion please leave a comment below as I would love to get more insights and ideas. I also linked my previous idea about this asset. Let me know in the comment below which pair you'd like me to cover in my next analysis.
Trade safe !!!


US30 shortDespite the breakdowns of the lines, the price came to the resistance zone. And I expect it to roll back down. The target is the nearest support level of 27431.
Traders, if you liked this idea or have your opinion on it, write in the comments. I will be glad👩💻


Market Forecasting with Gann Boxes, BTC. Bishko published an interesting BTC chart showing the use of Gann Fans yesterday.
I rarely see Gann's work being showcased on TV, so to continue the same vein, here is something to play with for those who want to diver deeper into market harmonics.
This chart uses essentially the same starting point as Bishko's chart, only using a 1-day chart, rather than a 3-day chart.
However, here I am showing the use of Gann Squares / Gann Boxes, as opposed to Gann angles.
I won't explain in detail how this works, as I believe in doing to work when it comes to discovering market secrets.
What I will say is that this box is formed fully off the price high 13868.
Both the price and the time dimensions are formed from the high.
That's a BIG clue on how to form a correct Gann box.
In fact, the ONLY piece of information you would need to draw this chart on the exact day of the high would be that price of 13868.
The price high will give you the future major support and resistance levels.
See the 0.25 / 0.382 / 0.5 / 0.618 levels on the chart. Those price supports would have been known months in advance.
But you'll see the Gann box doesn't extend through to the 0.618 level that was hit in March 2020.
Why is that?
Because the time cycle aspect of the initial price high reached its completion in mid-February 2020.
And what happened when that time cycle returned full cycle?
Immediately the market dropped.
You can look back at the other time ratios (0.382 and 0.75 especially) to see how upon reaching those points in time the market began major moves in their the same directions but significantly stronger, or switched directions entirely.
Gann boxes like this can give you key price levels and important dates of time to keep in mind, where the market has a significant chance of making major moves.
This can be done months in advance, as seen here.
Investigate this phenomenon for yourself.
Markets are harmonic in nature.
Price and Time are the same.
Good luck.


What is the Next Move for EURUSD?We are looking at EURUSD right now. This pair has a very sharp move over the last trading sessions.
.
From our technical standpoint, if this pair continues to move up, we are watching closely the first resistance level at 1.2024 and if this is taken over, we are watching closely the next resistance level at 1.2144, followed by the third resistance level at 1.2336.
.
On the other hand, if this pair decides to retrace to the downside, we are watching the first support level at 1.1125 and if this is taken over, we are watching closely the next support level at 1.0909.
.
Good trading!
From the Desk of NinjaSingapore
17 August 2020

the matrix was the door wayI understand to be able to trade like the best you must literally think like the best and if you have to, try to remember how they would have gone about utilizing the skills we learn to better advance their own trading skills. thus some people hold trades longer cause they know more. so just act like those people and ask a few questions here and there. but overall. the potential results is if they done because of the way they did it and then so can you. it's a bit like neo in the matrix. my sense of thinking is thinking like the ones and potential opportunities of the ones will present themselves. you're a newbie. think like you and you will always be a newbie. and sometimes want to run back to the matrix cause it's better for your taste bud. well while I say let's wrestle

eurjpyEURJPY forecast is for bearish market break the trendline and waits for a retest if the market does retest and provide any bearish signals or pin bar or any candlestick pattern so we can enter as sell in EEURJPY.

