EUR-USD Free Signal! Sell!
Hello,Traders!
EURUSD sweeps buy-side liquidity into a major supply zone. Strong bearish reaction and BOS confirm smart money distribution, opening room toward sell-side liquidity.
--------------------
Stop Loss: 1.1992
Take Profit: 1.1853
Entry: 1.1898
Time Frame: 2H
--------------------
Sell!
Comment and subscribe to help us grow!
Check out other forecasts below too!
Disclosure: I am part of Trade Nation's Influencer program and receive a monthly fee for using their TradingView charts in my analysis.
Forex

TheGrove | EURUSD buy | Idea Trading AnalysisEURUSD broke through multiple Support level and is now holding above the trendline and key level zone. The current pullback toward the marked support cluster suggests a potential continuation of the bullish move, provided price holds this structure.
EUR/USD is trading within a rising channel, with price holding above the ascending support line after a clear bullish and is moving on Resistance LEVEL.
Hello Traders, here is the full analysis.
GOOD LUCK! Great BUY opportunity EURUSD
I still did my best and this is the most likely count for me at the moment.
-------------------
Traders, if you liked this idea or if you have your own opinion about it, write in the comments. I will be glad ⚜️

TheGrove | GBPUSD buy | Idea Trading AnalysisGBP/USD is trading within a rising channel, with price holding above the ascending line after a clear bullish and is moving on Resistance level.
We expect a decline in the channel after testing the current level.
We expect a decline in the channel after testing the current level
Hello Traders, here is the full analysis.
I think we can soon see more fall from this range! GOOD LUCK! Great BUY opportunity GBPUSD
I still did my best and this is the most likely count for me at the moment.
-------------------
Traders, if you liked this idea or if you have your own opinion about it, write in the comments. I will be glad ⚜️

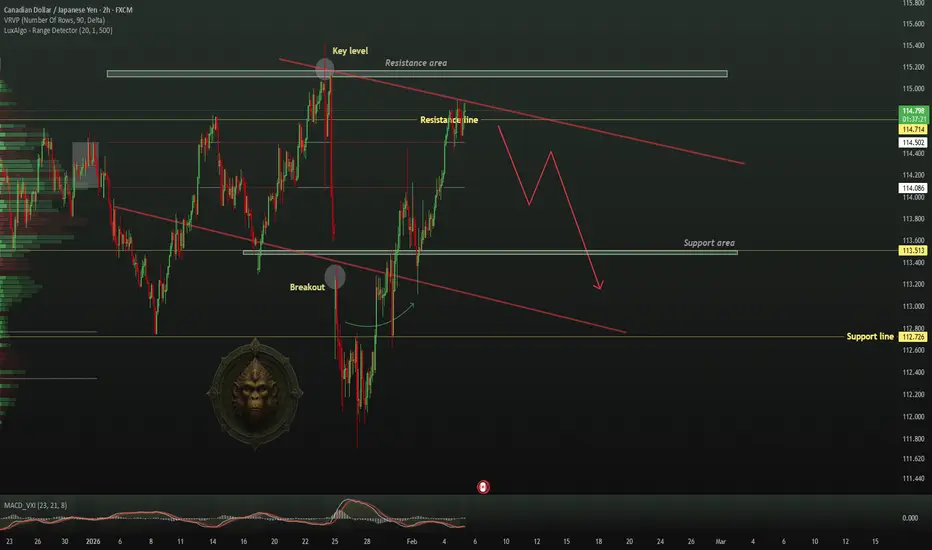
TheGrove | CADJPY Sell | Idea Trading AnalysisYou can expect a reaction in the direction of selling from the specified Resistance area
CADJPY moving higher as it tests the strong resistance level..
We expect a bearish move from the confluence zone.
Hello Traders, here is the full analysis.
I think we can soon see more fall from this range! GOOD LUCK! Great SELL opportunity CADJPY
I still did my best and this is the most likely count for me at the moment.
-------------------
Traders, if you liked this idea or if you have your own opinion about it, write in the comments. I will be glad 🤝
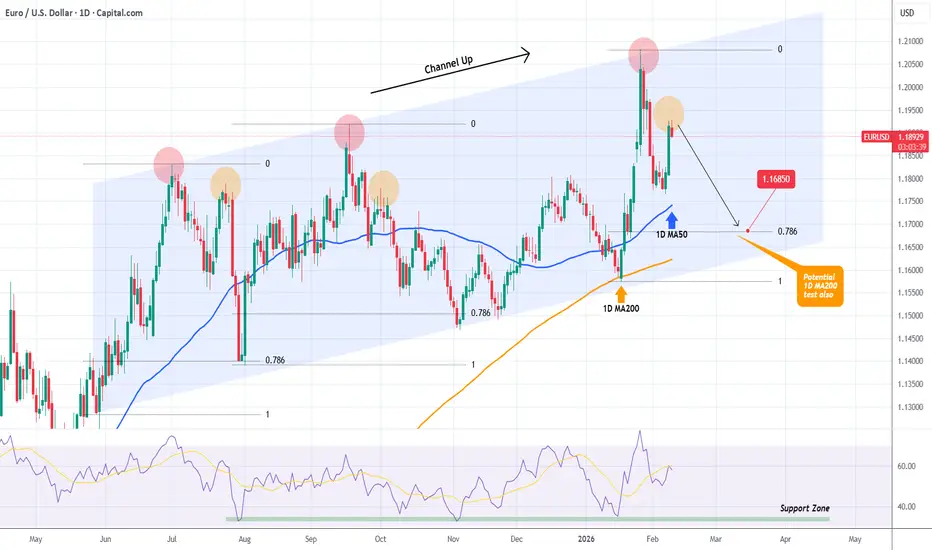
EURUSD 8-month Channel Up on a Bearish Leg.The EURUSD pair has been trading within a Channel Up since June and following the January 27 2026 Higher High rejection on an overbought 1D RSI, it started its latest Bearish Leg.
Yesterday's rise resembles the Lower High that both previous Bearish Legs had (orange circles) before they resumed the downtrend to the bottom of the Channel Up and the 0.786 Fibonacci retracement level.
As a result, our short-term Target is 1.16850, which will make a 1D MA200 (orange trend-line) test as well. If the 1D RSI hits its Support Zone earlier, book the profit regardless.
---
** Please LIKE 👍, FOLLOW ✅, SHARE 🙌 and COMMENT ✍ if you enjoy this idea! Also share your ideas and charts in the comments section below! This is best way to keep it relevant, support us, keep the content here free and allow the idea to reach as many people as possible. **
---
💸💸💸💸💸💸
👇 👇 👇 👇 👇 👇
GBPCAD: Bullish Continuation is Highly Probable! Here is Why:
It is essential that we apply multitimeframe technical analysis and there is no better example of why that is the case than the current GBPCAD chart which, if analyzed properly, clearly points in the upward direction.
Disclosure: I am part of Trade Nation's Influencer program and receive a monthly fee for using their TradingView charts in my analysis.
❤️ Please, support our work with like & comment! ❤️

GBPNZD: Bullish Continuation & Long Trade
GBPNZD
- Classic bullish formation
- Our team expects pullback
SUGGESTED TRADE:
Swing Trade
Long GBPNZD
Entry - 2.2589
Sl - 2.2572
Tp - 2.2619
Our Risk - 1%
Start protection of your profits from lower levels
Disclosure: I am part of Trade Nation's Influencer program and receive a monthly fee for using their TradingView charts in my analysis.
❤️ Please, support our work with like & comment! ❤️

GBPUSD Trading Opportunity! BUY!
My dear subscribers,
GBPUSD looks like it will make a good move, and here are the details:
The market is trading on 1.3653 pivot level.
Bias - Bullish
My Stop Loss - 1.3639
Technical Indicators: Both Super Trend & Pivot HL indicate a highly probable Bullish continuation.
Target - 1.3678
About Used Indicators:
The average true range (ATR) plays an important role in 'Supertrend' as the indicator uses ATR to calculate its value. The ATR indicator signals the degree of price volatility.
Disclosure: I am part of Trade Nation's Influencer program and receive a monthly fee for using their TradingView charts in my analysis.
———————————
WISH YOU ALL LUCK

kvmev - XAUUSD outlook (update #1)Looking to take buys around 4902 upon clear retest and rejection of zone.

Potential bullish reversal?USD/JPY is falling towards the support level, which is an overlap support that aligns with the 78.6% Fibonacci retracement and could bounce from this level to our take profit.
Entry: 153.83
Why we like it:
There is an overlap support that aligns with the 78.6% Fibonacci retracement.
Stop loss: 153.
Why we like it:
There is an overlap support level.
Take profit: 155.21
Why we like it:
There is a pullback resistance level.
Enjoying your TradingView experience? Review us!
Please be advised that the information presented on TradingView is provided to Vantage (‘Vantage Global Limited’, ‘we’) by a third-party provider (‘Everest Fortune Group’). Please be reminded that you are solely responsible for the trading decisions on your account. There is a very high degree of risk involved in trading. Any information and/or content is intended entirely for research, educational and informational purposes only and does not constitute investment or consultation advice or investment strategy. The information is not tailored to the investment needs of any specific person and therefore does not involve a consideration of any of the investment objectives, financial situation or needs of any viewer that may receive it. Kindly also note that past performance is not a reliable indicator of future results. Actual results may differ materially from those anticipated in forward-looking or past performance statements. We assume no liability as to the accuracy or completeness of any of the information and/or content provided herein and the Company cannot be held responsible for any omission, mistake nor for any loss or damage including without limitation to any loss of profit which may arise from reliance on any information supplied by Everest Fortune Group.

Bullish bounce off key support?GBP/USD is falling towards the support level, which is an overlap support that aligns with the 38.2% Fibonacci retracement and could bounce from this level to our take profit.
Entry: 1.3628
Why we like it:
There is an overlap support level that aligns with the 38.2% Fibonacci retracement.
Stop loss: 1.3566
Why we like it:
There is a pullback support level.
Take profit: 1.3730
Why we like it:
There is a swing high resistance level.
Enjoying your TradingView experience? Review us!
Please be advised that the information presented on TradingView is provided to Vantage (‘Vantage Global Limited’, ‘we’) by a third-party provider (‘Everest Fortune Group’). Please be reminded that you are solely responsible for the trading decisions on your account. There is a very high degree of risk involved in trading. Any information and/or content is intended entirely for research, educational and informational purposes only and does not constitute investment or consultation advice or investment strategy. The information is not tailored to the investment needs of any specific person and therefore does not involve a consideration of any of the investment objectives, financial situation or needs of any viewer that may receive it. Kindly also note that past performance is not a reliable indicator of future results. Actual results may differ materially from those anticipated in forward-looking or past performance statements. We assume no liability as to the accuracy or completeness of any of the information and/or content provided herein and the Company cannot be held responsible for any omission, mistake nor for any loss or damage including without limitation to any loss of profit which may arise from reliance on any information supplied by Everest Fortune Group.

Bearish drop off?EUR/USD has rejected off the resistance level, which is a pullback resistance and could drop from this level to our take rpofit.
Entry: 1.1921
Why we like it:
There is a pullback resistance level.
Stop loss: 1.1950
Why we like it:
There is a pullback resistance level.
Take profit: 1.1860
Why we like it:
There is a pullback support level.
Enjoying your TradingView experience? Review us!
Please be advised that the information presented on TradingView is provided to Vantage (‘Vantage Global Limited’, ‘we’) by a third-party provider (‘Everest Fortune Group’). Please be reminded that you are solely responsible for the trading decisions on your account. There is a very high degree of risk involved in trading. Any information and/or content is intended entirely for research, educational and informational purposes only and does not constitute investment or consultation advice or investment strategy. The information is not tailored to the investment needs of any specific person and therefore does not involve a consideration of any of the investment objectives, financial situation or needs of any viewer that may receive it. Kindly also note that past performance is not a reliable indicator of future results. Actual results may differ materially from those anticipated in forward-looking or past performance statements. We assume no liability as to the accuracy or completeness of any of the information and/or content provided herein and the Company cannot be held responsible for any omission, mistake nor for any loss or damage including without limitation to any loss of profit which may arise from reliance on any information supplied by Everest Fortune Group.

Three Inside Up For AUOANDA:AUDUSD on the close of the 8Hr Candle has formed a Three Inside Up candlestick pattern!
The Three Inside Up is a Bullish Reversal Candlestick Pattern that consists of:
1) Large Bearish Candle
2) Bullish Candle that takes back 50% of the First Candle
3) Large Bullish Candle that Closes with a Gap Up from the High of the First Candle
Long Opportunity is generated on the Open of the proceeding candle with a Stop Loss set Below the Low of the Pattern.

GJ Delivers Valid Breakout After False OneThis week has been nothing but Consolidation for OANDA:GBPJPY but today we finally get a Valid Breakout of the Falling Wedge!
A Falling Wedge consists of price trading between Lower Highs and Lower Lows and can be considered a Continuation or Reversal pattern dependent upon at what level the pattern is forming.
Monday, Bulls attempted to make a Breakout of the Falling Resistance but turned false once price fell right back down into the pattern and tested it as Resistance again and succeeded!
This morning, price has delivered what seems to be a Valid Bearish Breakout of the Falling Support but price seems to be exhausted which means we could be looking for a Retest of the Breakout.
If the Retest of the Breakout is successful, this could generate Short Opportunities to take price further down!
Fundamentally, we see strength come in for JPY with the Prime Minister Sanae Takaichi's election victory.
"Analysts also noted that Takaichi’s policy, which includes tax cuts and more fiscal spending, is expected to boost the economy and lift the stock market, potentially prompting the Bank of Japan to take a more hawkish stance, all factors that could support the yen."
- tradingview.com/news/reuters.com,2026:newsml_L6N3Z60OK:0-yen-extends-gains-after-takaichi-election-victory-us-data-in-focus/

45-Minute Chart Analysis: Support Hold → Range Break Attempt
Market Structure
Price previously sold off hard into the major demand/support zone (~4,650–4,720).
That support held cleanly (strong rejection + momentum shift), kicking off a rounded recovery / corrective arc.
Since Feb 7–10, price has been consolidating above a minor demand zone (~5,000–5,020) — classic base-building behavior.
Key Levels
Major Support (blue zone below): ~4,650–4,720
→ Strong institutional demand, validated by multiple reactions.
Current Entry Zone (blue box): ~5,000–5,020
→ Prior resistance turned support + consolidation range.
Major Resistance (gray zone): ~5,180–5,220
→ Supply zone / previous distribution area.
Trade Idea Logic
The chart is showing a higher low + compression under resistance.
If price holds above the entry zone and prints bullish continuation (strong close, volume expansion), the probability favors a push into resistance.
The drawn arrow reflects a range expansion move, not a breakout confirmation yet.
Bias
Bullish continuation (conditional) while price holds above ~5,000.
A clean rejection below the entry zone would invalidate the setup and shift bias back to range or pullback.
Summary
This is a support-hold → consolidation → resistance-target structure.
Patience matters here: confirmation above the range is the green light 🚦, while losing the blue entry zone is the warning sign.

XAUUSDHello Traders! 👋
What are your thoughts on GOLD?
After a strong bearish rejection from the previous high, Gold entered a deep corrective phase and declined into the highlighted demand zone, where strong bullish reaction and buyer participation were observed.
Subsequently, price formed a higher low, signaling the development of a bullish structure, and is currently trading above the ascending trendline.
At the moment, price is testing a key resistance area .
As long as Gold holds above the rising trendline and the identified support zone, the overall outlook remains bullish, and price has the potential to advance at least toward the marked upside target.
Currently, price has entered a trading range, and it is now trading near the upper boundary of this range. From here, two main scenarios are in focus:
Scenario 1: A confirmed breakout above the range high could trigger a continuation toward the specified upside target.
Scenario 2: Price may correct toward the range support area, and from there, buyers could step in again and push price higher.
Therefore, waiting for confirmation is essential before entering any position, while proper risk management remains key.
Don’t forget to like and share your thoughts in the comments! ❤️

EJ Bears Look To Expand Further DownOANDA:EURJPY has formed what looks to be an Expanding Range!
An Expanding Range consists of price trading between Higher Highs and Lower Lows and can deliver either a Bullish or Bearish Breakout.
Currently price is trading at the Falling Support and with combined tells from RSI, MACD and Volume, Bears could be looking to make a break for lower prices!
Fundamentally, we see strength come in for JPY with the Prime Minister Sanae Takaichi's election victory.
"Analysts also noted that Takaichi’s policy, which includes tax cuts and more fiscal spending, is expected to boost the economy and lift the stock market, potentially prompting the Bank of Japan to take a more hawkish stance, all factors that could support the yen."
- www.tradingview.com

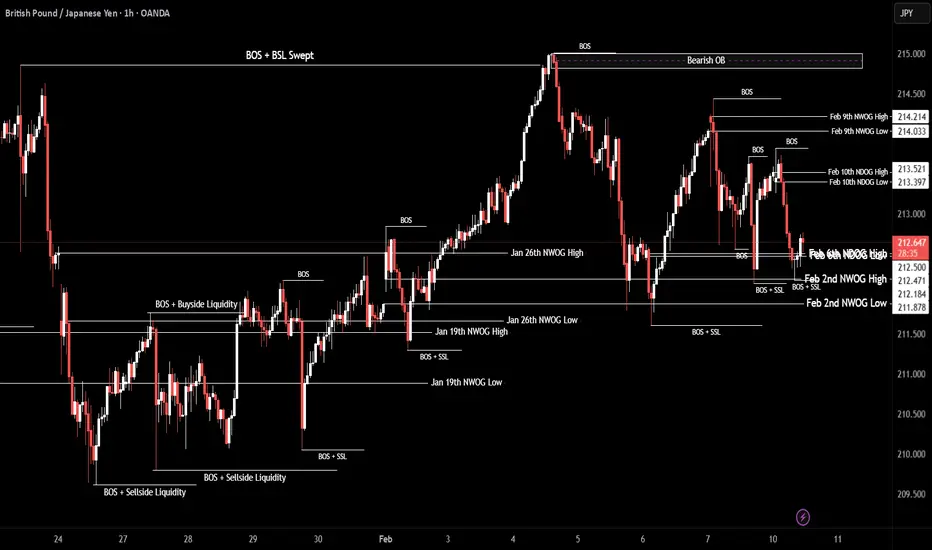
GBP/JPY | Up and down (READ THE CAPTION)By analyzing the hourly chart of GBPJPY, we can see that after yesterday's drop, it didn't go lower than the 212.13 to sweep the liquidity below and by hitting the Feb 2nd NWOG High, it bounced back up and it is being traded at 212.66.
If it holds up above the Feb 6th NDOG, I believe it can go up to 213.00.
Targets for GBPJPY: 212.75, 212.85 and 212.95.
If it fails: 212.50, 212.40, 212.30 and 212.20.
GBP/USD | Where to next? (READ THE CAPTION)After reaching all bullish targets last night (based on previous analysis, yesterday), GBPUSD opened today a little bit lower and then dropped in price gradually, almost touching the Jan 26th NWOG high, but then it went back up a little bit and now it's being traded at 1.3669. I expect GBPUSD to touch the Jan 26th NWOG soon, and if it manages to react and stay above there, I believe it'll go to today's NDOG.
Targets: 1.3674, 1.3681, 1.3688 and 1.3695.
If it fails to hold above: 1.3662. 1.3655 and 1.3648.

EUR/USD | Breaking through the breaker! (READ THE CAPTION)Well good morning folks, Amirali here.
starting the day with an analysis on EURUSD. As expected and mentioned yesterday, it reached the Bearish Breaker and has been struggling with it since last night, consolidating in a range inside the bearish breaker. I'd like to see EURUSD go above today's NDOG and stay above the Bearish Breaker's Mean Threshold and then go up higher to 1.19600 level.
For now, the targets: 1.1915, 1.1922, 1.1929, 1.1936, 1.1943 and 1.1950.
If it stays below the NDOG: 1.1900, 1.1893 and 1.1886.

XAU/USD | Gold At a Critical Short-Term Decision Zone!By analyzing the #Gold chart on the 30-minute timeframe, we can see that right after our last analysis, gold moved higher again and delivered more than 1,500 pips of profit, pushing price up to $5,047. Gold is now trading around $5,012.
If price fails to hold above $5,050 within the next 4 hours, we can expect a deeper pullback. The downside targets for this correction are $4,999, $4,990, and $4,960. On the other hand, if gold manages to stabilize above $5,050 within the next 4 hours, we can expect further upside in the short term, with targets above $5,080.
Please support me with your likes and comments to motivate me to share more analysis with you and share your opinion about the possible trend of this chart with me !
Best Regards , Arman Shaban

EURUSD: Bears Will Push Lower
The price of EURUSD will most likely collapse soon enough, due to the supply beginning to exceed demand which we can see by looking at the chart of the pair.
Disclosure: I am part of Trade Nation's Influencer program and receive a monthly fee for using their TradingView charts in my analysis.
❤️ Please, support our work with like & comment! ❤️

GBPJPY: Long Signal Explained
GBPJPY
- Classic bullish pattern
- Our team expects retracement
SUGGESTED TRADE:
Swing Trade
Buy GBPJPY
Entry - 211.48
Stop - 211.08
Take - 212.44
Our Risk - 1%
Start protection of your profits from lower levels
Disclosure: I am part of Trade Nation's Influencer program and receive a monthly fee for using their TradingView charts in my analysis.
❤️ Please, support our work with like & comment! ❤️
