EURJPY (2H CHART PATTERN)...EURJPY (2H CHART PATTERN).
As long as price stays below 183.70–184.00, bears are in control.
🎯 Target 1: 181.80
🎯 Target 2: 181.00
🎯 Extended Target: 180.20
❌ Stop loss above 183.60
🔺 If ME are looking for BUY (support bounce trade)
Only valid if we get strong bullish confirmation candle on 2H.
🎯 Target 1: 183.70
🎯 Target 2: 185.00
🎯 Target 3: 186.00 (major resistance)
📌 Key Level to Watch:
Break below 181.80 → strong continuation down.
Strong rejection from current zone → possible retracement to 183.50–185.00.
Right now structure is bearish, so safer setup is sell on pullback unless clear reversal forms.
Forex

#EURUSD , Again? 📊 Morning Market Brief | London Session Prep
🔎 Instrument Focus: #EURUSD
⚠️ Risk Environment: High
📈 Technical Overview:
Maybe it be a adding on Position setup .... Not a Quality setup but lets have it in our watchlist.
—
#GOLD is still VALID
—-
🚀 Trading Plan:
• Need to check Momentum at POI
• LTF ENTRY NEEDED ‼️
• Just and Only for QuickScalp
🧠 Stay updated with real time news and macro events, visit 👉 @News_Ash_TheTrader_Bot
#Ash_TheTrader #Forex #EURUSD #MarketInsight #PriceAction #TradingPlan #RiskManagement #LondonSession #Scalping #Futures #NQ #Gold

Profitable GBPUSD Forex Trading Strategy Explained
Want a profitable pullback trading strategy for GBP/USD Forex pair?
I will show you a very accurate method using simple support and resistance and price action analysis.
We will start with a theory for beginners and I will explain to you the e xact setup and the signal that you should look for.
Then, I will show you a real trading signal on GBPUSD that we spotted on a live stream with my students.
Market Analysis
For this pullback strategy, we will use 2 time frames.
A daily time frame for analysis and hourly time frame for entry confirmation.
Your main task on a daily time frame will be to analyze supports and resistances.
In up-trend, I suggest trading from supports
and in a down-trend, I recommend selling from resistances .
That is how a complete daily time frame analysis should look.
I spotted significant support and resistance zones and identified the market trend on a daily chart.
Signal to Buy
After the identification of supports and resistances, wait for its test.
We will look for a pullback strictly from these structures.
After a test, start analysing the hourly time frame for a confirmation.
Your buy signal on support will be a formation of any bullish price action patter n.
The best ones are inverted head and shoulders, double & triple bottom, ascending triangle and cup & handle.
Neckline breakout of the pattern will be your signal to buy.
Target will be the closest intraday strong resistance,
stop loss below the lows , entry on a retest .
Signal to Sell
Your sell signal from resistance will be a formation of a bearish price action pattern on that on an hourly.
Here are the best patterns: head and shoulders, double & triple top, descending triangle, inverted cup & handle.
Neckline breakout of the pattern will be your signal to sell.
Target will be the closest intraday strong support,
stop loss above the highs, entry on a retest.
Trade Example
Following these simple rules, we found a trading setup on GBPUSD with my students on a live stream.
Trading in uptrend, GBPUSD tested a key daily support.
Following the rules of our strategy, we started looking for a confirmation signal on 1H chart. The price formed a double bottom pattern.
Long trade was opened after a breakout of a neckline, on its retest.
SL was below pattern lows, TP was a the closest strong intraday resistance.
And here is what happened after a couple of hours.
More than 70 pips of profit were made.
Most traders use the wrong entry rules for trading pullbacks.
This strategy is Clean, Simple, Profitable.
It will help you to easily trade pullback on GBPUSD or any other forex pair
❤️Please, support my work with like, thank you!❤️
I am part of Trade Nation's Influencer program and receive a monthly fee for using their TradingView charts in my analysis.

EURCHF: Another Bearish Move🇪🇺🇨🇭
EURCHF dropped yesterday as I predicted.
Today, I see another opportunity to sell.
This time, the price tested a strong intraday resistance
and formed a double top pattern on that.
Chances are high that the pair will continue retracing
and reach 0.911 level.
❤️Please, support my work with like, thank you!❤️
I am part of Trade Nation's Influencer program and receive a monthly fee for using their TradingView charts in my analysis.

EURJPY (2H chart pattern)...EURJPY (2H chart pattern).
Bias: Short / Sell (price rejected from resistance & broke trendline)
📍 Sell Zone
185.20 – 185.35 (my marked sell zone)
🎯 Targets
Target 1: 183.60 – 183.70 (first demand / dashed line)
Target 2: 182.40 – 182.50 (next major support)
❌ Stop Loss
Above 186.00 (above resistance & recent high)
📌 Extra confirmation
Trendline break ✔️
Price below resistance ✔️
Ichimoku cloud acting as resistance ✔️
As long as price stays below 185.50–186.00, sells are valid.

EURCAD: Bullish Outlook Explained 🇪🇺🇨🇦
EURCAD will likely pull back from the underlined intraday support,
following a confirmed breakout of a falling channel on an hourly time frame.
Target will be 1.613
❤️Please, support my work with like, thank you!❤️
I am part of Trade Nation's Influencer program and receive a monthly fee for using their TradingView charts in my analysis.

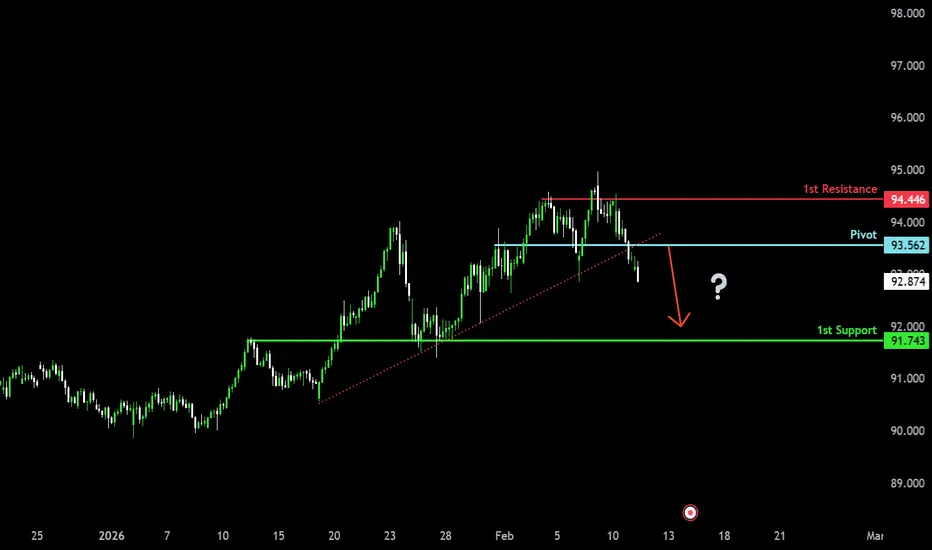
Bearish drop off?NZD/JPY has broken out of the pivot, which acts as an overlap support, and could drop to the 1st suppor,t which is also an overlap support.
Pivot: 93.56
1st Support: 91.74
1st Resistance: 94.44
Disclaimer:
The opinions given above constitute general market commentary and do not constitute the opinion or advice of IC Markets or any form of personal or investment advice.
Any opinions, news, research, analyses, prices, other information, or links to third-party sites contained on this website are provided on an "as-is" basis, are intended to be informative only, and are not advice, a recommendation, research, a record of our trading prices, an offer of, or solicitation for, a transaction in any financial instrument and thus should not be treated as such. The information provided does not involve any specific investment objectives, financial situation, or needs of any specific person who may receive it. Please be aware that past performance is not a reliable indicator of future performance and/or results. Past performance or forward-looking scenarios based upon the reasonable beliefs of the third-party provider are not a guarantee of future performance. Actual results may differ materially from those anticipated in forward-looking or past performance statements. IC Markets makes no representation or warranty and assumes no liability as to the accuracy or completeness of the information provided, nor any loss arising from any investment based on a recommendation, forecast, or any information supplied by any third party.
Bearish continuation setup?Swissie (USD/CHF) is rising towards the pivot, which acts as a pullback resistance and could reverse to the 1st support.
Pivot: 0.7738
1st Support: 0.7640
1st Resistance: 0.7817
Disclaimer:
The opinions given above constitute general market commentary and do not constitute the opinion or advice of IC Markets or any form of personal or investment advice.
Any opinions, news, research, analyses, prices, other information, or links to third-party sites contained on this website are provided on an "as-is" basis, are intended to be informative only, and are not advice, a recommendation, research, a record of our trading prices, an offer of, or solicitation for, a transaction in any financial instrument and thus should not be treated as such. The information provided does not involve any specific investment objectives, financial situation, or needs of any specific person who may receive it. Please be aware that past performance is not a reliable indicator of future performance and/or results. Past performance or forward-looking scenarios based upon the reasonable beliefs of the third-party provider are not a guarantee of future performance. Actual results may differ materially from those anticipated in forward-looking or past performance statements. IC Markets makes no representation or warranty and assumes no liability as to the accuracy or completeness of the information provided, nor any loss arising from any investment based on a recommendation, forecast, or any information supplied by any third party.

XAUUSD – Short Idea (15-Minute Chart)Market Structure:
Price is trading within a rising channel, showing short-term bullish structure. However, the move is corrective in nature as price approaches higher-timeframe resistance (PDH) while remaining in a premium area of the range.
Key Technical Confluences:
Price reacting near the upper boundary of the rising channel
PDH acting as overhead resistance
Bullish candles losing momentum near highs
Potential for a pullback after premium re-pricing
Bias:
🔴 Bearish reaction favored from channel resistance
Execution Framework:
Short opportunities become valid on clear rejection from channel resistance
Invalidation if price shows strong acceptance above PDH
Downside potential toward channel midline and prior intraday structure
Risk Management:
Wait for confirmation before execution
Keep risk defined and position size controlled
Market conditions can shift quickly
Conclusion:
As long as price remains below PDH and respects the rising channel resistance, short-side pullbacks remain technically justified within the current structure.
⚠️ This analysis is for educational purposes only and does not constitute financial advice.

Bearish reversal off pullback resistance?Fiber (EUR/USD) is rising towards the pivot, which is a pullback resistance and could reverse to the 1st support, which is a pullback support that aligns with the 50% Fibonacci retracement.
Pivot: 1.1941
1st Support: 1.1837
1st Resistance: 1.2039
Disclaimer:
The opinions given above constitute general market commentary and do not constitute the opinion or advice of IC Markets or any form of personal or investment advice.
Any opinions, news, research, analyses, prices, other information, or links to third-party sites contained on this website are provided on an "as-is" basis, are intended to be informative only, and are not advice, a recommendation, research, a record of our trading prices, an offer of, or solicitation for, a transaction in any financial instrument and thus should not be treated as such. The information provided does not involve any specific investment objectives, financial situation, or needs of any specific person who may receive it. Please be aware that past performance is not a reliable indicator of future performance and/or results. Past performance or forward-looking scenarios based upon the reasonable beliefs of the third-party provider are not a guarantee of future performance. Actual results may differ materially from those anticipated in forward-looking or past performance statements. IC Markets makes no representation or warranty and assumes no liability as to the accuracy or completeness of the information provided, nor any loss arising from any investment based on a recommendation, forecast, or any information supplied by any third party.

EURUSD Equal Highs Formed Before Bearish ContinuationQuick Summary
EURUSD formed Equal Highs after the recent strong rally and the Price is now likely targeting a demand zone before continuing lower
The overall move remains corrective within a broader bearish reaction from the monthly timeframe
Target remains 1.17665
Short entries require a clear CHOCH or strong rejection confirmation
Full Analysis
Following the strong bullish expansion, EURUSD has now formed Equal Highs (EQH), creating a clear liquidity pool above price.
This structure suggests that the recent rally may have primarily aimed at engineering liquidity rather than initiating a sustainable bullish trend.
The pair is now expected to target a nearby demand zone as part of a corrective retracement before resuming its broader bearish continuation.
The downside objective remains 1.17665, aligning with the current bearish order flow and the strong reaction previously initiated from the monthly timeframe.
Despite the recent upside movement, bearish pressure remains dominant.
However, entering short positions directly from this area carries risk.
A confirmed Change of Character (CHOCH) on lower timeframes or a strong rejection signal (such as a clear bearish engulfing candle or displacement move) is required to validate the entry

XAGUSD Bearish Continuation After Pullback
The 2H Silver (XAGUSD) chart shows a clear bearish structure following a strong sell-off and break of structure (BOS). Price attempted a pullback into a marked supply/resistance zone and aligned with a descending trendline, but selling pressure resumed. The market is now consolidating below the trendline, suggesting continuation to the downside. The projected target lies near the lower demand zone around the mid-60s, indicating sellers remain in control unless price reclaims the supply area.

GBPUSD Bullish Recovery Toward Key Resistance
The 1H GBPUSD chart shows a sharp bearish move within a descending channel, followed by a strong bullish reversal from the lower demand zone. Price has broken out of the channel and formed higher highs and higher lows, signaling a short-term trend shift to the upside. The recent pullback found support, and buyers are pushing price higher toward the marked first target near the previous resistance area around 1.3740–1.3760. As long as price holds above the demand zone, bullish momentum remains favored.

Silver Is Compressing Below Supply — Breakout or RejectionSilver has staged a strong recovery from the support area, forming a sequence of higher lows along the rising trendline. This confirms that buyers are active and defending pullbacks, keeping the short-term structure constructive.
However, price is now compressing directly beneath a well-defined supply zone, where previous upside attempts were capped. The recent candles show overlapping ranges and reduced momentum, suggesting absorption and indecision, not a clean breakout yet. This is typical behavior when the market is deciding between continuation and rejection.
As long as price holds above the rising trendline and the support area, the bullish structure remains intact. A confirmed breakout and acceptance above the supply zone would open the door toward the higher supply premium area (goal). Failure to break, on the other hand, could trigger a pullback toward trendline support before the next attempt.
Bullish continuation: Clean break + hold above supply → expansion toward the marked goal.
Corrective pullback: Rejection at supply → retrace toward trendline / support area, structure remains bullish if higher lows hold.
Mindset: Let price prove the breakout. Compression at supply is a decision point, not a signal by itself.

Silver Under Pressure – Sellers Are in ControlXAGUSD is currently clearly leaning toward a short-term BEARISH trend, as both recent news and the technical structure fail to support a sustainable bullish move.
From a news perspective , silver is facing pressure from profit-taking after the previous strong rebound , while the U.S. dollar and U.S. Treasury yields are showing signs of stabilization. This has made short-term capital more cautious toward metals like silver , which are highly sensitive to USD fluctuations. When safe-haven demand is not strong enough, rallies in XAGUSD are more likely to be viewed as selling opportunities.
On the H4 timeframe, the bearish structure remains firmly intact . Price is still below the Ichimoku cloud and moving within a descending trend channel, confirming that sellers continue to control the market. Recent rebounds have only produced lower highs, highlighting weak buying pressure and a lack of follow-through.
The 86.0–86.4 zone is acting as a key resistance area , where the descending trendline and the Ichimoku cloud converge. Repeated rejection from this zone would further reinforce the bearish scenario . If XAGUSD fails to break and hold above this resistance, the probability strongly favors a renewed move lower, with an initial target near 70.0, followed by a deeper extension toward 69.9, as highlighted on the chart.
In summary, XAGUSD is currently in a technical rebound within a larger downtrend. The most sensible approach at this stage is to prioritize SELL setups on rallies, patiently waiting for price-action confirmation, rather than attempting to catch a bottom while the dominant trend remains unfavorable for buyers.

EU Bulls Raise A FlagFX:EURUSD has fallen into a Consolidation after quite an impressive rally and what we could be seeing is a popular Continuation pattern, the Bull Flag!
With a Bull Flag, we should expect price to deliver a Bullish Breakout of the Falling Resistance of the Channel, accompanied with a Retest of that Breakout.
Once a valid Breakout and successful Retest is made, this pattern should generate Long Opportunities.

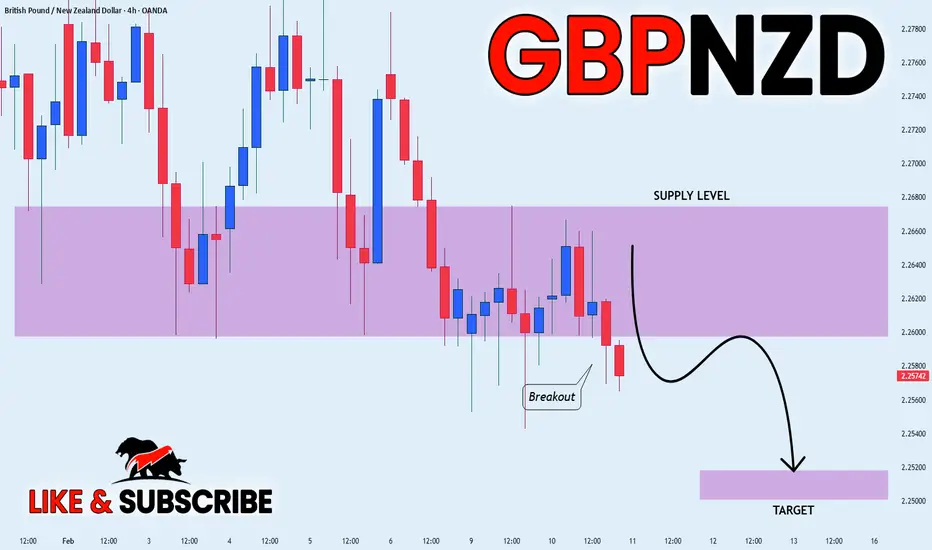
GBPNZD BEARISH BREAKOUT|SHORT|
✅GBPNZD clean bearish breakout below supply confirms market structure shift. Failed pullback and strong displacement signal continuation toward sell-side liquidity resting lower. Time Frame 4H.
SHORT🔥
✅Like and subscribe to never miss a new idea!✅
AUD-JPY Bullish Continuation! Buy!
Hello,Traders!
AUDJPY strong uptrend holds as price respects demand after liquidity sweep. Bullish BOS and impulsive structure suggest continuation toward buy-side liquidity above recent highs. Time Frame 4H.
Buy!
Comment and subscribe to help us grow!
Check out other forecasts below too!
Disclosure: I am part of Trade Nation's Influencer program and receive a monthly fee for using their TradingView charts in my analysis.

EURUSD FREE SIGNAL|SHORT|
✅EURUSD double top forms inside premium, followed by bearish displacement and MSS. Failed continuation signals mitigation lower, with sell-side liquidity resting below the range.
—————————
Entry: 1.1905
Stop Loss: 1.1929
Take Profit: 1.1870
Time Frame: 2H
—————————
SHORT🔥
✅Like and subscribe to never miss a new idea!✅

GBP-CAD Bearish Breakout! Sell!
Hello,Traders!
GBPCAD breaks below a key supply base with strong displacement. Bearish BOS confirms distribution, exposing sell-side liquidity toward lower imbalance zones. Time Frame 4H.
Sell!
Comment and subscribe to help us grow!
Check out other forecasts below too!
Disclosure: I am part of Trade Nation's Influencer program and receive a monthly fee for using their TradingView charts in my analysis.

GBPUSD LOCAL LONG|
✅GBPUSD reacts strongly from discount demand and shows bullish displacement. Structure shifts higher, with clean mitigation and buy-side liquidity resting above recent highs. Time Frame 2H.
LONG🚀
✅Like and subscribe to never miss a new idea!✅

EUR-USD Free Signal! Sell!
Hello,Traders!
EURUSD sweeps buy-side liquidity into a major supply zone. Strong bearish reaction and BOS confirm smart money distribution, opening room toward sell-side liquidity.
--------------------
Stop Loss: 1.1992
Take Profit: 1.1853
Entry: 1.1898
Time Frame: 2H
--------------------
Sell!
Comment and subscribe to help us grow!
Check out other forecasts below too!
Disclosure: I am part of Trade Nation's Influencer program and receive a monthly fee for using their TradingView charts in my analysis.

TheGrove | EURUSD buy | Idea Trading AnalysisEURUSD broke through multiple Support level and is now holding above the trendline and key level zone. The current pullback toward the marked support cluster suggests a potential continuation of the bullish move, provided price holds this structure.
EUR/USD is trading within a rising channel, with price holding above the ascending support line after a clear bullish and is moving on Resistance LEVEL.
Hello Traders, here is the full analysis.
GOOD LUCK! Great BUY opportunity EURUSD
I still did my best and this is the most likely count for me at the moment.
-------------------
Traders, if you liked this idea or if you have your own opinion about it, write in the comments. I will be glad ⚜️
