USD/CAD SENDS CLEAR BULLISH SIGNALS|LONG
USD/CAD SIGNAL
Trade Direction: long
Entry Level: 1.363
Target Level: 1.367
Stop Loss: 1.361
RISK PROFILE
Risk level: medium
Suggested risk: 1%
Timeframe: 1h
Disclosure: I am part of Trade Nation's Influencer program and receive a monthly fee for using their TradingView charts in my analysis.
✅LIKE AND COMMENT MY IDEAS✅
Forex

GOLD SHORT FROM RESISTANCE
GOLD SIGNAL
Trade Direction: short
Entry Level: 5,028.84
Target Level: 4,836.67
Stop Loss: 5,157.38
RISK PROFILE
Risk level: medium
Suggested risk: 1%
Timeframe: 1h
Disclosure: I am part of Trade Nation's Influencer program and receive a monthly fee for using their TradingView charts in my analysis.
✅LIKE AND COMMENT MY IDEAS✅

EUR/CAD BUYERS WILL DOMINATE THE MARKET|LONG
EUR/CAD SIGNAL
Trade Direction: long
Entry Level: 1.611
Target Level: 1.614
Stop Loss: 1.609
RISK PROFILE
Risk level: medium
Suggested risk: 1%
Timeframe: 1h
Disclosure: I am part of Trade Nation's Influencer program and receive a monthly fee for using their TradingView charts in my analysis.
✅LIKE AND COMMENT MY IDEAS✅

GOLD 05/02 – SMC H2 MAP | FILL LIQUIDITY 47XX NOW!Gold had a strong drop to the Fib 0.382 area and then quickly rebounded. Gold prices are reacting at the Fib 0.5 H2 + FVG confluence area. The next direction will depend on whether the price is accepted or rejected at these key areas.
BRIEF CONTEXT
The market remains sensitive to USD and interest rate expectations, so intraday liquidity sweeps occur frequently. Macroeconomic instability helps gold avoid a direct collapse, but it's not strong enough to reverse the short-term structure.
➡️ This explains why there are quick drops – quick rebounds – but the range remains locked.
TECHNICAL STRUCTURE H2
The larger structure is still bearish after CHoCH from the peak. The current upward movement is considered a pullback in the downtrend. Fib 0.5 H2 is acting as a balance area, not a trend confirmation area.
ROUTE MAP – PRICE AREAS TO WATCH
🔴 UPPER AREA
👉 5000 – 5050
Fib 0.5 → 0.618 H2
FVG H2
Technical retracement area in the downtrend structure
➡️ If the price retraces here but is not accepted, the upward movement is just a retracement to continue the decline.
👉 5200 – 5250
Fib 0.786 H2
FVG above
Only if the price breaks and holds above this area will the intraday downtrend structure be invalidated.
🟢 LOWER AREA
👉 4920 – 4950
Fib 0.5 H2 + FVG
Balance area, prone to two-way tug-of-war
👉 4800 – 4820
Fib 0.382 H2
Area where the drop and rebound just occurred
👉 4650 – 4700
FVG + demand H2
Next support area if bearish returns
👉 4550 – 4600
Liquidity low
Only activated when the downward momentum expands strongly
HOW WE READ & TRADE ON 05/02
Scalp: according to price reaction at 0.382 – 0.5 – FVG H2, especially during the European session.
Do not FOMO with the rebound – strong reaction does not mean reversal.
Swing: only follow structure acceptance, do not predict emotions.
Let the market speak the truth when it hits important areas. LucasGrayTrading will continue to update when the price gives clearer signals during the day.
— LucasGrayTrading

XAUUSD – H4 OutlookXAUUSD – H4 Outlook: Technical Rebound as Precious Metals Stabilise | Lana ✨
Precious metals are showing early signs of stabilisation after a period of heavy volatility. As silver rebounds sharply from intraday lows, gold is also attempting to rebuild structure following a strong corrective sell-off.
This move appears to be a technical recovery, not yet a full trend reversal, but it provides important clues about the next directional phase.
📈 Market Structure & Price Action
After failing to hold above the upper supply zone near 5,500, gold experienced a sharp bearish displacement, breaking previous structure and accelerating lower. However, price found strong demand around the 4,600–4,650 support zone, where selling pressure was absorbed.
From this base, gold is now forming higher lows, indicating a short-term recovery within a broader corrective structure. The descending trendline remains intact, keeping the market in a decision-making phase.
🔍 Key Technical Zones
Strong Support / Demand: 4,600 – 4,650
This area acted as a clear liquidity base and remains critical for any recovery scenario.
Near-Term Resistance / Reaction Zone: ~4,900 – 4,920
Price is currently reacting here. Acceptance above this level would strengthen bullish momentum.
Mid Resistance: ~5,050 – 5,100
A key zone aligned with prior structure and imbalance.
Major Supply Zone: ~5,500
This remains the upper boundary where sellers previously regained control.
🎯 Possible Scenarios
Base Case:
Gold continues to consolidate above 4,600–4,650, building structure before attempting a push toward 4,900–5,050.
Bullish Extension:
Acceptance above 5,050 could open the door for a broader recovery toward higher supply zones.
Failure Scenario:
A breakdown below 4,600 would invalidate the rebound and shift focus back to lower liquidity.
🌍 Intermarket Context
Silver’s sharp rebound after a deep sell-off suggests panic-driven liquidation is easing across metals. Historically, such moves often support short-term recoveries in gold, even if volatility remains elevated.
🧠 Lana’s View
This is a recovery-in-progress, not a market to chase. The focus should remain on how price behaves at key resistance zones, especially near 4,900–5,050.
Patience is key while the market decides whether this rebound develops into a broader trend shift or remains corrective.
✨ Respect the structure, trade the levels, and let the market confirm the next move.

Silver Recovery — Support Holds, Targets DefinedSilver experienced a sharp sell-off that decisively broke below the EMA and accelerated into the highlighted support zone. The decline was impulsive in nature, signaling liquidation rather than a healthy pullback. However, once price reached the support zone, selling pressure clearly weakened, and the market began to stabilize instead of continuing lower. This reaction suggests that demand is actively defending this area.
Following the support reaction, price has started to form a short-term recovery structure. The rebound from support is orderly, with higher lows developing, but upside momentum remains moderate rather than explosive. This tells us that the current move is best classified as a corrective recovery within a broader bearish context, not yet a confirmed trend reversal.
The key technical test now lies ahead. The zone around the EMA and prior structure resistance defines the boundary between correction and trend shift. If price can continue higher, break above this resistance, and show acceptance not just a wick the recovery could extend toward the first upside objective (TP1), followed by a deeper pullback and a potential continuation toward the full target zone. This scenario would signal that buyers are gradually regaining control.
Alternatively, if price fails to reclaim resistance and starts showing rejection or increasing overlap, the current move would remain a corrective bounce. In that case, a pullback back into the support zone would be likely. As long as this support holds, any downside should still be viewed as corrective rather than the start of a new bearish expansion.
In summary, Silver is stabilizing after a liquidation-driven sell-off, with buyers defending a clear support zone. However, the market has not yet done enough to confirm a bullish reversal. The structure remains corrective until resistance is reclaimed with strength.
Let the market confirm. Trade the structure not the emotion.


EURJPY: Bullish Continuation 🇪🇺🇯🇵
EURJPY completed a bullish accumulation
after a test of a significant rising trend line.
A formation of a buying imbalance candle yesterday
is a strong sign of strength of the buyers.
The price will likely rise to 186.1 level after a pullback.
❤️Please, support my work with like, thank you!❤️
I am part of Trade Nation's Influencer program and receive a monthly fee for using their TradingView charts in my analysis.

NZDUSD H1 | Bearish BreakoutThe price is rising towards our sell entry level at 0.5993, which is an overlap resistance that lines up with the 23.6% Fibonacci retracement.
Our stop loss is set at 0.6024, which is an overlap resistance that aligns with the 50% Fibonacci retracement.
Our take profit is set at 0.5928, whichis a pullback support.
High Risk Investment Warning
Stratos Markets Limited fxcm.com Stratos Europe Ltd fxcm.com
CFDs are complex instruments and come with a high risk of losing money rapidly due to leverage. 69% of retail investor accounts lose money when trading CFDs with this provider. You should consider whether you understand how CFDs work and whether you can afford to take the high risk of losing your money.
Stratos Global LLC fxcm.com Losses can exceed deposits.
Please be advised that the information presented on TradingView is provided to FXCM (‘Company’, ‘we’) by a third-party provider (‘TFA Global Pte Ltd’). Please be reminded that you are solely responsible for the trading decisions on your account. Any information and/or content is intended entirely for research, educational and informational purposes only and does not constitute investment or consultation advice or investment strategy. The information is not tailored to the investment needs of any specific person and therefore does not involve a consideration of any of the investment objectives, financial situation or needs of any viewer that may receive it. Past performance is not a reliable indicator of future results. Actual results may differ materially from those anticipated in forward-looking or past performance statements. We assume no liability as to the accuracy or completeness of any of the information and/or content provided herein and the Company cannot be held responsible for any omission, mistake nor for any loss or damage including without limitation to any loss of profit which may arise from reliance on any information supplied by TFA Global Pte Ltd.
Stratos Trading Pty. Limited fxcm.com
Trading FX/CFDs carries significant risks. FXCM AU (AFSL 309763), please read the Financial Services Guide, Product Disclosure Statement, Target Market Determination and Terms of Business at fxcm.com

DXY TO THE MOON ! Q1 | D5 | W5 | Y26 FRGNT DAILY FORECAST📅 Q1 | D5 | W5 | Y26
📊 DXY — FRGNT DAILY FORECAST
🔍 Analysis Approach
I’m applying a developed version of Smart Money Concepts, with a structured focus on:
• Identifying Key Points of Interest (POIs) on Higher Time Frames (HTFs) 🕰️
• Using those POIs to define a clear and controlled trading range 📐
• Refining those zones on Lower Time Frames (LTFs) 🔎
• Waiting for a Break of Structure (BoS) as confirmation ✅
This process keeps me precise, disciplined, and aligned with market narrative, rather than reacting emotionally or chasing price.
💡 My Motto
“Capital management, discipline, and consistency in your trading edge.”
A positive risk-to-reward ratio, combined with a high-probability execution model, is the backbone of any sustainable trading plan 📈🔐
⚠️ On Losses
Losses are part of the mathematical reality of trading 🎲
They don’t define you — they are necessary, expected, and managed.
We acknowledge them, learn, and move forward 📊➡️
🙏 I appreciate you taking the time to review my Daily Forecast.
Further context and supporting material can be found in the Links section.
Stay sharp 🧠
Stay consistent 🎯
Protect your capital 🔐
— FRGNT 🚀📈
TVC:DXY

Potential bearish reversal?USD/JPY is rising towards the pivot, which is a pullback resistance and could reverse to the 1st support, which is a pullback support.
Pivot: 157.71
1st Support: 155.94
1st Resistance: 159.37
Disclaimer:
The opinions given above constitute general market commentary and do not constitute the opinion or advice of IC Markets or any form of personal or investment advice.
Any opinions, news, research, analyses, prices, other information, or links to third-party sites contained on this website are provided on an "as-is" basis, are intended to be informative only, and are not advice, a recommendation, research, a record of our trading prices, an offer of, or solicitation for, a transaction in any financial instrument and thus should not be treated as such. The information provided does not involve any specific investment objectives, financial situation, or needs of any specific person who may receive it. Please be aware that past performance is not a reliable indicator of future performance and/or results. Past performance or forward-looking scenarios based upon the reasonable beliefs of the third-party provider are not a guarantee of future performance. Actual results may differ materially from those anticipated in forward-looking or past performance statements. IC Markets makes no representation or warranty and assumes no liability as to the accuracy or completeness of the information provided, nor any loss arising from any investment based on a recommendation, forecast, or any information supplied by any third party

Pullback resistance ahead?Swissie (USD/CHF) is rising towards the pivot, a pullback resistance that aligns with the 61.8% Fibonacci retracement, and could reverse to the 1st support.
Pivot: 0.7858
1st Support; 0.7697
1st Resistance: 0.7955
Disclaimer:
The opinions given above constitute general market commentary and do not constitute the opinion or advice of IC Markets or any form of personal or investment advice.
Any opinions, news, research, analyses, prices, other information, or links to third-party sites contained on this website are provided on an "as-is" basis, are intended to be informative only, and are not advice, a recommendation, research, a record of our trading prices, an offer of, or solicitation for, a transaction in any financial instrument and thus should not be treated as such. The information provided does not involve any specific investment objectives, financial situation, or needs of any specific person who may receive it. Please be aware that past performance is not a reliable indicator of future performance and/or results. Past performance or forward-looking scenarios based upon the reasonable beliefs of the third-party provider are not a guarantee of future performance. Actual results may differ materially from those anticipated in forward-looking or past performance statements. IC Markets makes no representation or warranty and assumes no liability as to the accuracy or completeness of the information provided, nor any loss arising from any investment based on a recommendation, forecast, or any information supplied by any third party

Bullish bounce off 61.8% Fib support?Cable (GBP/USD) is falling towards the pivot, a pullback support that aligns with the 61.8% Fibonacci retracement, and could bounce to the 1st resistance.
Pivot: 1.3550
1st Support: 1.3482
1st Resistance: 1.3713
Disclaimer:
The opinions given above constitute general market commentary and do not constitute the opinion or advice of IC Markets or any form of personal or investment advice.
Any opinions, news, research, analyses, prices, other information, or links to third-party sites contained on this website are provided on an "as-is" basis, are intended to be informative only, and are not advice, a recommendation, research, a record of our trading prices, an offer of, or solicitation for, a transaction in any financial instrument and thus should not be treated as such. The information provided does not involve any specific investment objectives, financial situation, or needs of any specific person who may receive it. Please be aware that past performance is not a reliable indicator of future performance and/or results. Past performance or forward-looking scenarios based upon the reasonable beliefs of the third-party provider are not a guarantee of future performance. Actual results may differ materially from those anticipated in forward-looking or past performance statements. IC Markets makes no representation or warranty and assumes no liability as to the accuracy or completeness of the information provided, nor any loss arising from any investment based on a recommendation, forecast, or any information supplied by any third party

Falling towards key support?Fiber (EUR/USD) is falling towards the pivot and could bounce to the 1st resistance.
Pivot: 1.1749
1st Support: 1.1691
1st Resistance: 1.1855
Disclaimer:
The opinions given above constitute general market commentary and do not constitute the opinion or advice of IC Markets or any form of personal or investment advice.
Any opinions, news, research, analyses, prices, other information, or links to third-party sites contained on this website are provided on an "as-is" basis, are intended to be informative only, and are not advice, a recommendation, research, a record of our trading prices, an offer of, or solicitation for, a transaction in any financial instrument and thus should not be treated as such. The information provided does not involve any specific investment objectives, financial situation, or needs of any specific person who may receive it. Please be aware that past performance is not a reliable indicator of future performance and/or results. Past performance or forward-looking scenarios based upon the reasonable beliefs of the third-party provider are not a guarantee of future performance. Actual results may differ materially from those anticipated in forward-looking or past performance statements. IC Markets makes no representation or warranty and assumes no liability as to the accuracy or completeness of the information provided, nor any loss arising from any investment based on a recommendation, forecast, or any information supplied by any third party

Bearish reversal off pullback resistance?US Dollar Index (DXY) is rising towards the pivot, which acts as a pullback resistance and could reverse to the 1st support.
Pivot: 97.85
1st Support: 96.44
1st Resistance: 98.70
Disclaimer:
The opinions given above constitute general market commentary and do not constitute the opinion or advice of IC Markets or any form of personal or investment advice.
Any opinions, news, research, analyses, prices, other information, or links to third-party sites contained on this website are provided on an "as-is" basis, are intended to be informative only, and are not advice, a recommendation, research, a record of our trading prices, an offer of, or solicitation for, a transaction in any financial instrument and thus should not be treated as such. The information provided does not involve any specific investment objectives, financial situation, or needs of any specific person who may receive it. Please be aware that past performance is not a reliable indicator of future performance and/or results. Past performance or forward-looking scenarios based upon the reasonable beliefs of the third-party provider are not a guarantee of future performance. Actual results may differ materially from those anticipated in forward-looking or past performance statements. IC Markets makes no representation or warranty and assumes no liability as to the accuracy or completeness of the information provided, nor any loss arising from any investment based on a recommendation, forecast, or any information supplied by any third party

XAUUSD Smart Money Setup | FVG Reaction & Liquidity SweepGold (XAUUSD) shows a strong reaction from the lower range after a bearish impulse move. Price swept sell-side liquidity and reacted cleanly from a bullish Fair Value Gap (FVG), indicating active demand at discounted levels.
The market is currently trading inside a defined range, but short-term structure suggests a potential upside retracement. Consecutive higher lows and bullish candles reflect increasing buying pressure. Multiple unmitigated FVG zones above price may act as magnets, attracting price toward higher levels.
This setup highlights a classic liquidity grab → displacement → FVG respect sequence, commonly observed in Smart Money price delivery.
📌 Key Insights:
Sell-side liquidity sweep completed
Strong bullish reaction from demand zone
FVG respected with bullish continuation
Upside liquidity resting above recent highs
📈 Bias: Short-term bullish retracement
⚠️ Reminder: Higher-timeframe trend remains volatile; confirmation is advised

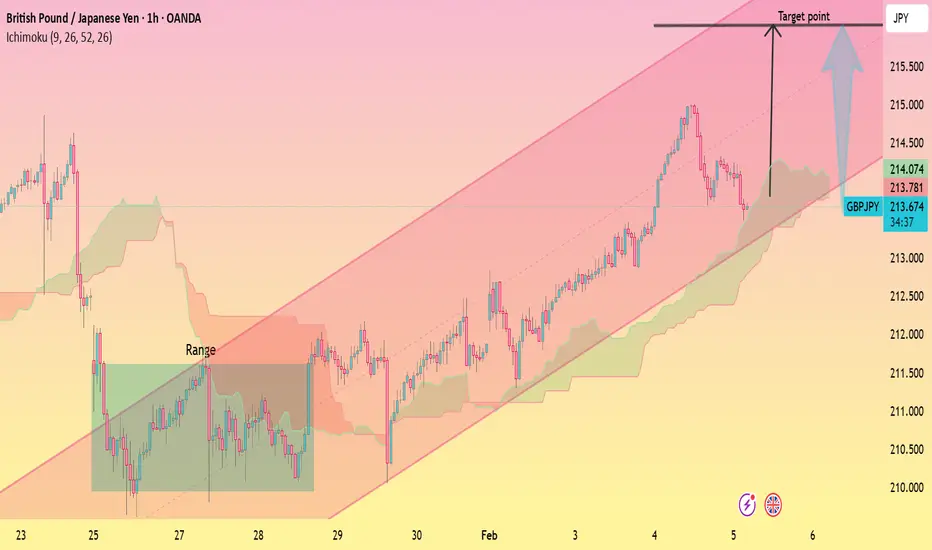
Bullish Ascending Channel with Upside ContinuationThis is a GBP/JPY 1-hour chart showing a strong uptrend inside an ascending channel. Price is making higher highs and higher lows, clearly respecting the channel structure. After a period of range consolidation, the pair broke upward and continued bullish momentum. The Ichimoku Cloud is mostly below price, acting as dynamic support, which confirms trend strength. A small pullback is visible near the mid-channel, but overall structure remains bullish, with a projected upside target around the 216.00 resistance zone, as marked on the chart.
XAUUSD (Gold) – HTF FVG Reaction | 1HThis chart highlights higher-timeframe Fair Value Gaps (H1/H4) and recent session liquidity levels.
Price is currently reacting within a premium area while previous H1 imbalance zones remain unmitigated below.
The idea demonstrates how price has historically interacted with imbalance and liquidity zones on Gold.
No directional bias is assumed; this is a technical structure overview only.
⚠️ Disclaimer:
This publication is for educational and analytical purposes only.
It does not constitute investment advice, trade signals, or recommendations.
Always do your own research and risk management.

Bitcoin Breakdown From Range, Targeting Lower SupportThis is a 2-hour BTC/USD chart showing a clear **downtrend within a descending channel**. Price previously **ranged sideways** (marked “Range”), then **broke down sharply**, losing range support. The **Ichimoku cloud is bearish**, acting as resistance above price. After the breakdown, price formed a **bearish Fair Value Gap (FVG)** overhead and is consolidating below it. The chart highlights a **projected downside move toward the ~72,000 area**, aligning with the lower channel support as the target zone.

EURUSD (1H) — Descending Channel into Unfilled FVG (POI) Context / Structure
Price is trading inside a clean descending channel (lower highs, lower lows).
We’re now rotating down into a Point of Interest: an unfilled / open FVG (highlighted zone), lining up with the lower channel boundary.
This is not a signal. It’s a location where a reaction is possible.
POI (what matters)
The highlighted FVG zone is the main magnet.
If price tags this zone and respects the channel support, we may see a corrective push higher (mean reversion / liquidity rotation).
RegimeWorks Plan (Permission → Retest → Execution)
1) Permission (required)
I will only consider a long idea if EURUSD:
Touches the FVG POI and
Shows rejection (e.g., strong bullish close, wick rejection, or displacement away from the zone) and
Ideally reclaims the lower channel line (no acceptance below support).
If price just drifts into the zone and grinds lower with no rejection → No trade.
2) Retest (required)
After the bounce, I want:
A pullback / retest into the reclaimed level (top portion of the FVG / channel support)
Price to hold that retest (buyers defend), then print continuation structure.
No clean retest = lower-quality entry = likely pass.
3) Execution (only after 1 + 2)
Entry is only on confirmation after the retest holds.
Stop placement should be below the FVG zone / swing low, where the idea is clearly invalid.
Invalidation (when the idea is wrong)
Clean acceptance below the FVG zone (strong closes below + continuation) invalidates the bounce thesis.
If the channel breaks and holds below support, the path of least resistance remains down → stand aside.
Potential Upside Objectives (if it plays out)
First objective: mean rotation back toward channel mid / prior consolidation
Next: upper channel region
Higher objective: reclaim of the larger swing area (only if momentum expands)
Note: the EMA cluster overhead is likely to act as dynamic resistance, so I’d expect reactions on the way up.
Bottom line
This is a “wait-for-permission” setup: strong confluence (descending channel support + open FVG POI), but it’s only a possibility until price proves buyers are defending the zone. If we don’t get rejection + retest structure, it’s simply No Trade.

Gold Is Recovering — But Structure Still Controls the UpsideGold on the 2H timeframe is currently rebounding within a clearly defined ascending corrective channel after a sharp impulsive sell-off from the prior all-time high. That sell-off respected key Fibonacci retracement levels, confirming it was a distribution-to-markdown transition, not random volatility. The rebound from the $4,400 area shows strong reactive buying, but structurally this remains a countertrend recovery inside a broader corrective phase.
From a technical perspective, price is now rotating higher toward the 0.5–0.618 Fibonacci zone around $5,000–$5,140, which also aligns with the mid-to-upper region of the rising channel. This area is critical: it previously acted as support during the distribution phase and is now likely to behave as overhead supply. As long as price stays inside this channel, higher highs and higher lows are acceptable, but they do not yet signal a full bullish trend resumption.
The key decision point lies ahead. If gold reclaims and holds above $5,150–$5,200 with acceptance, the corrective narrative weakens and upside continuation toward channel expansion becomes viable. However, failure or rejection in this zone would reinforce the move as a technical mean reversion, opening the door for another rotation back toward channel support. Until a major structure is reclaimed, trade the channel not the emotion.

Market Analysis,Scenario and Strategies Trading FEB 4Intraday trading: Adjust
📌 SET UP 1. Timming Sell Zone
XAUUSD SELL ZONE: 5143 - 5146
💰 Take Profit(TP): 5140 - 5135
❎ Stoploss(SL): 5150
Note capital management to ensure account safety
📌 SET UP 2. Timming Buy Zone
XAUUSD BUY ZONE: 4945 - 4948
💰 Take Profit(TP): 4951 - 4956
❎ Stoploss(SL): 4941
Note capital management to ensure account safety
Market Analysis & Today's Scenario
- The market followed yesterday's analysis scenario, completing the ABC corrective wave at the strong support zone. After the completion of wave C, the price reacted positively and began forming a new bullish structure.
- On the H4 timeframe, the price broke above and held steady above the MA confluence zone, indicating that buying pressure is gradually regaining control of the market. Current momentum supports the possibility of the market entering a new wave cycle, with a potential bullish structure according to Elliott wave theory.
👉 Today's Scenario:
- Prioritize technical pullbacks to continue the uptrend.
- The main trend for the day is bullish; any corrections will only be for consolidation.
- As long as the price does not return to the bottom of wave C, the bullish structure remains intact.
- Overall, the market is operating according to plan – the correct structure – and meeting expectations. The current period is suitable for following new trends, managing orders tightly, and optimizing profits according to the wave.

Gold price analysis on February 5th📊 Price Structure Overview
The medium-term trend remains bullish, but the short-term is in a technical correction/sideways rebound phase after a sharp drop.
The current price is around 4.97xx, stuck between the upper resistance and lower support zones → the market is hesitant, a strong breakout is likely.
🔴 Important RESISTANCE ZONE
5.10x – 5.14x
Coincidence:
Old supply zone
Fibo 0.382 (~5.139)
Short-term EMA is suppressing the price
The price has tested this zone multiple times but has not closed above it clearly → selling pressure remains.
➡️ If a reversal candle (pin bar, bearish engulfing) appears upon reaching this zone → high probability of a reversal to a downtrend.
🟢 Support Zone
4.85x – 4.86x
Fibo 0.618 (~4.859)
The price is currently reacting quite well.
4.40x – 4.45x (Strong Support)
Strong demand zone, bottom of the previous crash.
If it breaks below 4.85x → there's a high probability the price will fall to this zone as indicated by the red arrow you drew.
📐 EMA & Momentum
EMA 34 & EMA 89:
The price has crossed below them → upward momentum is weakening.
EMA is trending downwards, acting as dynamic resistance.
The current structure resembles a pullback in a short-term downtrend.
