USDJPY FREE SIGNAL|SHORT|
✅USDJPY taps into a premium supply PD array after a strong rally. Bearish displacement and rejection suggest distribution, with downside continuation toward sell-side liquidity below recent lows.
—————————
Entry: 157.04
Stop Loss: 157.95
Take Profit: 155.76
Time Frame: 5H
—————————
SHORT🔥
✅Like and subscribe to never miss a new idea!✅
Forex
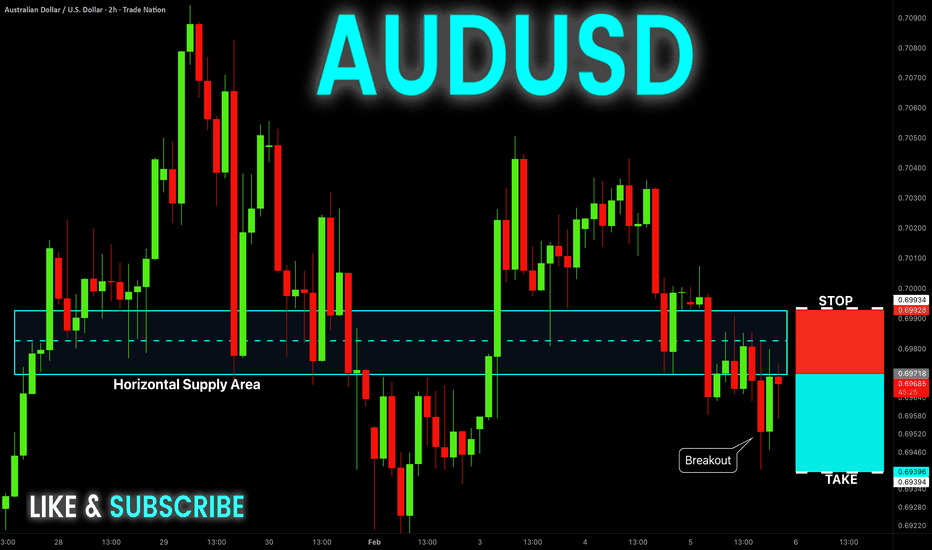
AUD-USD Free Signal! Sell!
Hello,Traders!
AUDUSD breaks decisively below a well-respected horizontal supply zone, confirming bearish structure shift. Acceptance below supply signals smart money distribution and continuation toward lower liquidity.
--------------------
Stop Loss: 0.6993
Take Profit: 0.6939
Entry: 0.6971
Time Frame: 2H
--------------------
Sell!
Comment and subscribe to help us grow!
Check out other forecasts below too!
Disclosure: I am part of Trade Nation's Influencer program and receive a monthly fee for using their TradingView charts in my analysis.
NZDUSD BEARISH BREAKOUT|SHORT|
✅NZDUSD strong bearish displacement breaks below the prior supply PD array, confirming market structure shift. Expect a shallow retracement into the breakout zone before continuation toward sell-side liquidity. Time Frame 2H.
SHORT🔥
✅Like and subscribe to never miss a new idea!✅
GBP-USD Local Short! Sell!
Hello,Traders!
GBPUSD decisively breaks below a well-defined horizontal supply zone, confirming bearish market structure. Acceptance below supply suggests continuation toward lower liquidity pools after the breakout. Time Frame 2H.
Sell!
Comment and subscribe to help us grow!
Check out other forecasts below too!
Disclosure: I am part of Trade Nation's Influencer program and receive a monthly fee for using their TradingView charts in my analysis.
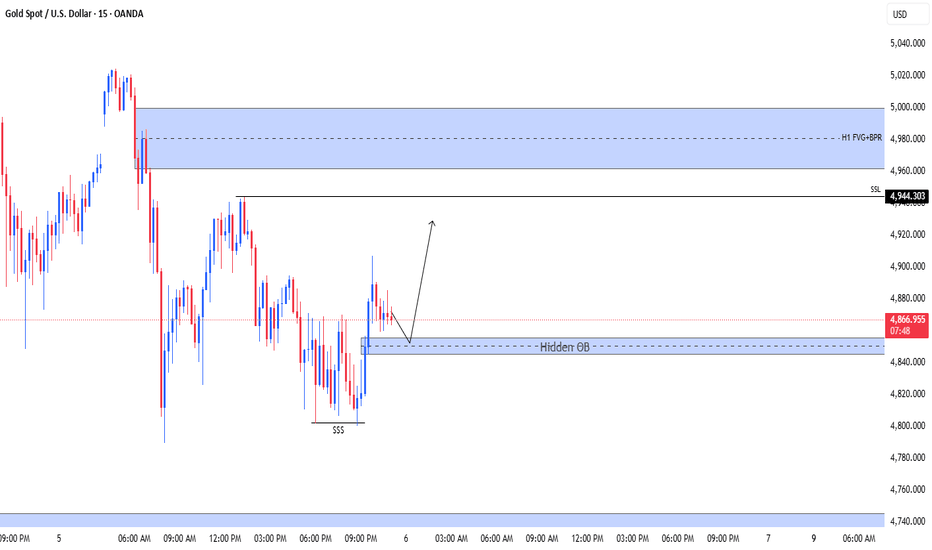
XAUUSD – M15 | Short-Term Bullish Reaction ExpectedPrice has swept liquidity (SSS) and is now reacting from a Hidden Bullish Order Block on M15.
As long as price holds above this OB, a pullback → continuation move is likely.
Upside draw remains toward the H1 FVG / BPR zone near the previous supply area.
Bias: Intraday bullish
Key idea: Liquidity sweep + hidden OB reaction
Note: Wait for confirmation before execution. This is educational, not financial advice.
GBPUSD: Market Sentiment & Price Action
It is essential that we apply multitimeframe technical analysis and there is no better example of why that is the case than the current GBPUSD chart which, if analyzed properly, clearly points in the upward direction.
Disclosure: I am part of Trade Nation's Influencer program and receive a monthly fee for using their TradingView charts in my analysis.
❤️ Please, support our work with like & comment! ❤️
GBPAUD: Long Trading Opportunity
GBPAUD
- Classic bullish formation
- Our team expects pullback
SUGGESTED TRADE:
Swing Trade
Long GBPAUD
Entry - 1.9425
Sl - 1.9396
Tp - 1.9483
Our Risk - 1%
Start protection of your profits from lower levels
Disclosure: I am part of Trade Nation's Influencer program and receive a monthly fee for using their TradingView charts in my analysis.
❤️ Please, support our work with like & comment! ❤️
Bearish reversal off pullback resistance?USD/JPY is rising towards the resistance level, which is a pullback resistance that aligns with the 78.6% Fibonacci retracement and could reverse from this level to our take profit.
Entry: 157.71
Why we like it:
There is a pullback resistance level that aligns with the 78.6% Fibonacci retracement.
Stop loss: 159.39
Why we like it:
There is a swing high resistance level.
Take profit: 155.61
Why we like it:
There is a pullback support level.
Enjoying your TradingView experience? Review us!
Please be advised that the information presented on TradingView is provided to Vantage (‘Vantage Global Limited’, ‘we’) by a third-party provider (‘Everest Fortune Group’). Please be reminded that you are solely responsible for the trading decisions on your account. There is a very high degree of risk involved in trading. Any information and/or content is intended entirely for research, educational and informational purposes only and does not constitute investment or consultation advice or investment strategy. The information is not tailored to the investment needs of any specific person and therefore does not involve a consideration of any of the investment objectives, financial situation or needs of any viewer that may receive it. Kindly also note that past performance is not a reliable indicator of future results. Actual results may differ materially from those anticipated in forward-looking or past performance statements. We assume no liability as to the accuracy or completeness of any of the information and/or content provided herein and the Company cannot be held responsible for any omission, mistake nor for any loss or damage including without limitation to any loss of profit which may arise from reliance on any information supplied by Everest Fortune Group.
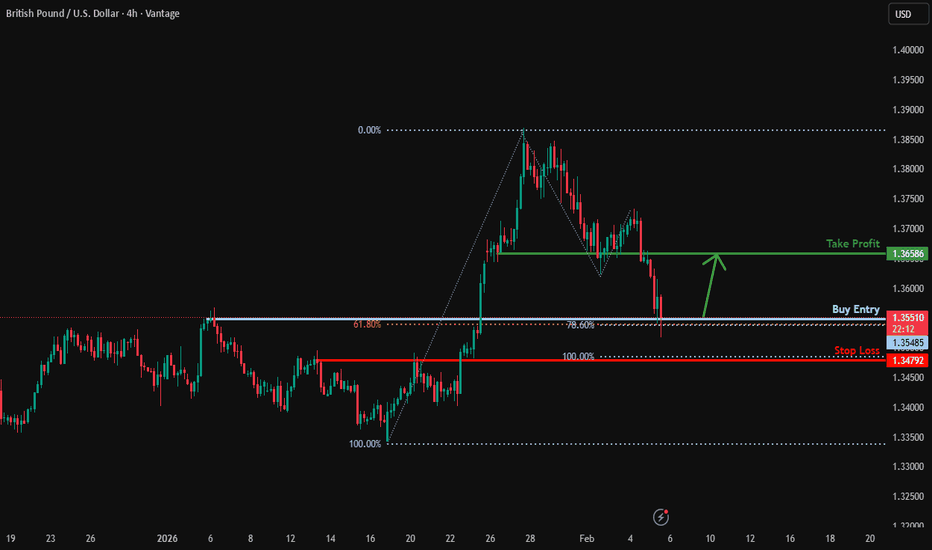
Bullish reversal off Fib levels?GBP/USD is reacting off the support level, which is a pullback support that aligns with the 61.8% Fibonacci retracement and the 78.6% Fibonacci projection, and could bounce from this level to our take profit.
Entry: 1.3548
Why we like it:
There is a pullback support level that aligns with the 61.8% Fibonaci retracement and the 78.6% Fibonacci projection.
Stop loss: 1.3479
Why we like it:
There is a pullback support level that aligns with the 100% Fibonacci projection.
Take profit: 1.3658
Why we like it:
There is a pullback resistance level.
Enjoying your TradingView experience? Review us!
Please be advised that the information presented on TradingView is provided to Vantage (‘Vantage Global Limited’, ‘we’) by a third-party provider (‘Everest Fortune Group’). Please be reminded that you are solely responsible for the trading decisions on your account. There is a very high degree of risk involved in trading. Any information and/or content is intended entirely for research, educational and informational purposes only and does not constitute investment or consultation advice or investment strategy. The information is not tailored to the investment needs of any specific person and therefore does not involve a consideration of any of the investment objectives, financial situation or needs of any viewer that may receive it. Kindly also note that past performance is not a reliable indicator of future results. Actual results may differ materially from those anticipated in forward-looking or past performance statements. We assume no liability as to the accuracy or completeness of any of the information and/or content provided herein and the Company cannot be held responsible for any omission, mistake nor for any loss or damage including without limitation to any loss of profit which may arise from reliance on any information supplied by Everest Fortune Group.
GBPJPY On The Rise! BUY!
My dear followers,
This is my opinion on the GBPJPY next move:
The asset is approaching an important pivot point 212.63
Bias - Bullish
Safe Stop Loss - 212.10
Technical Indicators: Supper Trend generates a clear long signal while Pivot Point HL is currently determining the overall Bullish trend of the market.
Goal - 213.56
About Used Indicators:
For more efficient signals, super-trend is used in combination with other indicators like Pivot Points.
Disclosure: I am part of Trade Nation's Influencer program and receive a monthly fee for using their TradingView charts in my analysis.
———————————
WISH YOU ALL LUCK
Heading towards pullback resistance?US Dollar index is rising towards the resistance levle which is a pullback resistance and could reverse from this levle to our take profit.
Entry: 98.17
Why we like it:
There is a pullback resistance level.
Stop loss: 98.90
Why we like it:
There is a pullback resistance level.
Take profit: 97.16
Why we like it:
There is a pullback support level.
Enjoying your TradingView experience? Review us!
Please be advised that the information presented on TradingView is provided to Vantage (‘Vantage Global Limited’, ‘we’) by a third-party provider (‘Everest Fortune Group’). Please be reminded that you are solely responsible for the trading decisions on your account. There is a very high degree of risk involved in trading. Any information and/or content is intended entirely for research, educational and informational purposes only and does not constitute investment or consultation advice or investment strategy. The information is not tailored to the investment needs of any specific person and therefore does not involve a consideration of any of the investment objectives, financial situation or needs of any viewer that may receive it. Kindly also note that past performance is not a reliable indicator of future results. Actual results may differ materially from those anticipated in forward-looking or past performance statements. We assume no liability as to the accuracy or completeness of any of the information and/or content provided herein and the Company cannot be held responsible for any omission, mistake nor for any loss or damage including without limitation to any loss of profit which may arise from reliance on any information supplied by Everest Fortune Group.
NZDJPY - Price Is Moving Within A Rising ChannelThis is an NZD/JPY 4‑hour chart showing an overall bullish uptrend inside an ascending channel, with a plan to buy (go long) on a pullback into a highlighted support area rather than selling the drop.
Trend and Structure 📊
Price is moving within a rising channel marked by two parallel diagonal lines, creating higher highs and higher lows, which defines a bullish market structure.
Labels like “DAILY – BULLISH” and “H4 – BULLISH” indicate that both the daily and 4‑hour timeframes are aligned upward, so the trade idea follows the dominant trend instead of fighting it. ⬆️
Current Price ActionPrice recently pushed up to the upper boundary of the channel and then sharply rejected from it, causing the current pullback you see on the right side of the chart.
This drop is treated as a correction within the uptrend, not yet a reversal, because price still trades above the lower channel line and key support zones.
Trade Idea Logic ✍️
The idea is to buy at a discount in an uptrend: enter near support with the trend, place stops below the recent swing low or below the support zone, and target the midline or upper boundary of the channel as potential take‑profit areas. 📈
If price breaks and closes clearly below the channel support and the green zone, that would invalidate the long setup here and may shift bias from bullish to neutral or bearish until a new support area is found.
GBPCAD — LONG from current levels → 1.8670📈 Price is compressing near support after a corrective pullback. Momentum is rebuilding in favor of the upside.
Technical context: holding above key intraday support, higher lows forming on lower timeframes and bullish continuation structure intact
🎯 Target: 1.8670
Tight entry, asymmetric setup: limited downside, clean upside continuation.
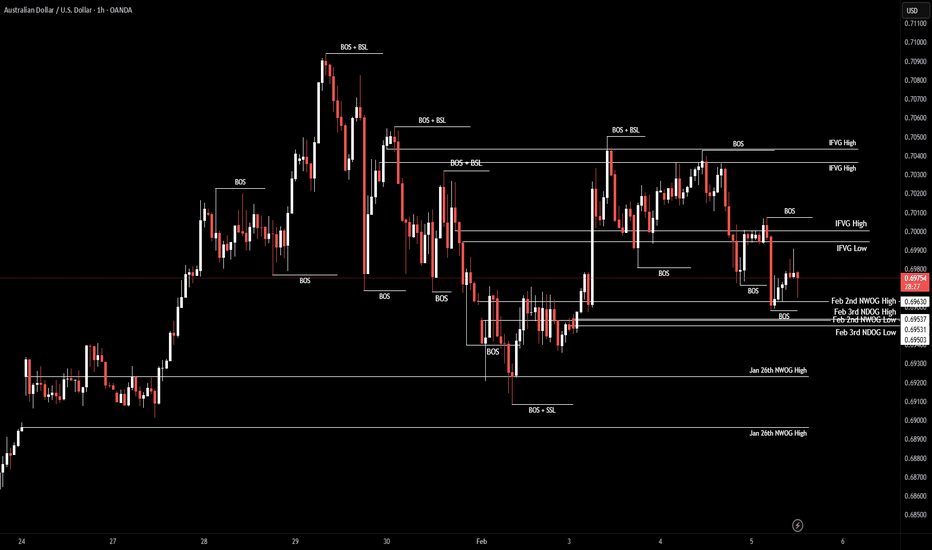
AUD/USD | Where to next? (READ THE CAPTION)As you can see, after hitting the Consequent Encroachment of the Feb 2nd's NWOG, AUDUSD went back up from 0.6958 to 0.6990, and then dropped again just above the high of the NWOG, and is now being at 0.6970.
I expect AUDUSD to retest the IFVG, but before that it may fall back to the Feb 2nd NWOG.
If it holds above the NWOG, the targets are: 0.6978, 0.6988, 0.6998 and 0.7008.
If it fails to hold above the NWOG: 0.6966, 0.6958, 0.6950 and 0.6942.
NZDCHF Is Bullish! Buy!
Here is our detailed technical review for NZDCHF.
Time Frame: 4h
Current Trend: Bullish
Sentiment: Oversold (based on 7-period RSI)
Forecast: Bullish
The market is approaching a significant support area 0.465.
The underlined horizontal cluster clearly indicates a highly probable bullish movement with target 0.469 level.
P.S
We determine oversold/overbought condition with RSI indicator.
When it drops below 30 - the market is considered to be oversold.
When it bounces above 70 - the market is considered to be overbought.
Like and subscribe and comment my ideas if you enjoy them!
GOLD Is Very Bullish! Long!
Take a look at our analysis for GOLD.
Time Frame: 1h
Current Trend: Bullish
Sentiment: Oversold (based on 7-period RSI)
Forecast: Bullish
The market is on a crucial zone of demand 4,864.98.
The oversold market condition in a combination with key structure gives us a relatively strong bullish signal with goal 5,005.48 level.
P.S
Overbought describes a period of time where there has been a significant and consistent upward move in price over a period of time without much pullback.
Like and subscribe and comment my ideas if you enjoy them!
BITCOIN BULLS ARE GAINING STRENGTH|LONG
Hello, Friends!
BITCOIN pair is trading in a local downtrend which we know by looking at the previous 1W candle which is red. On the 4H timeframe the pair is going down too. The pair is oversold because the price is close to the lower band of the BB indicator. So we are looking to buy the pair with the lower BB line acting as support. The next target is 75,119.34 area.
Disclosure: I am part of Trade Nation's Influencer program and receive a monthly fee for using their TradingView charts in my analysis.
✅LIKE AND COMMENT MY IDEAS✅
XAUUSD: Bullish Push to 5340?FX:XAUUSD is eyeing a bullish breakout on the 1-hour chart , with price rebounding from the 0.786 Fib level near cumulative short liquidation, converging with a potential entry zone that could ignite upside momentum if buyers hold against short-term dips. This setup suggests a continuation opportunity amid recent volatility, targeting higher resistance levels with 1:2 risk-reward .🔥
Entry between 4840–4750 for a long position. Target at 5340 . Set a stop loss at a 4-hour close below 4590 , yielding a risk-reward ratio of 1:2 . Monitor for confirmation via a bullish candle close above entry with rising volume, leveraging gold's momentum near the Fib level.🌟
Fundamentally , gold is trading around $5,052 in early February 2026, with key US Dollar events this week potentially weakening USD if data underperforms, favoring gold upside. On February 4 at 8:15 AM ET, ADP Employment Change (Jan, forecast 41K) could pressure USD on soft private hiring. February 5 at 8:30 AM ET brings Initial Jobless Claims (week of Jan 31, forecast 209K), with higher claims undermining USD strength. February 6 at 8:30 AM ET features the Employment Report (Jan, forecast 50K Non-Farm Payrolls, 4.4% Unemployment Rate), the week's highlight—weak figures could trigger USD selloff amid Fed cut bets. 💡
📝 Trade Setup
🎯 Long Entry Zone:
4750 – 4840
(Entry from current price is valid with proper risk & position sizing.)
🎯 Target:
5340
❌ Stop Loss:
4H close below 4590
⚖️ Risk / Reward:
≈ 1 : 2
💡 Your view?
SPX500: Bearish Drop to 6850?As the previous analysis worked exactly as predicted, FX:SPX500 is eyeing a bearish reversal on the 4-hour chart , with price testing a key resistance zone after lower highs, converging with a potential entry area that could trigger downside momentum if sellers defend amid recent volatility. This setup suggests a pullback opportunity in the uptrend, targeting lower support levels with more than 1:4 risk-reward .🔥
Entry between 7050–7080 for a short position (entry from current price with proper risk management is recommended). Target at 6850 . Set a stop loss at a daily close above 7100 , yielding a risk-reward ratio of more than 1:4 . Monitor for confirmation via a bearish candle close below entry with rising volume, leveraging the index's dynamics near resistance.🌟
Fundamentally , the S&P 500 closed just shy of a record high on February 2, 2026, up 0.5% to 6,976.44, driven by gains in chipmakers and small caps amid AI optimism. However, February historically poses risks, with waning momentum and potential 10% drops if reversals occur. Today's JOLTS Job Openings (Dec) at 8:00 AM ET (forecast 7.7M) could strengthen USD and pressure equities if robust, signaling resilient labor markets amid Fed caution. 💡
📝 Trade Setup
🎯 Entry (Short):
7050 – 7080
(Entry from current price is valid with proper risk & position sizing.)
🎯 Target:
• 6850
❌ Stop Loss:
• Daily close above 7100
⚖️ Risk-to-Reward:
• > 1:4
💡 Your view?
Is SPX500 setting up for a healthy pullback toward 6850, or will buyers absorb supply and push into new all-time highs above 7100? 👇
XAUUSD H1 – Corrective Pullback Within Broader Bullish StructureGold (XAUUSD) on the 1-hour timeframe remains within a broader bullish structure, but price is currently undergoing a corrective phase. After reaching a major swing high, the market faced strong rejection from the descending red trendline, triggering a sharp pullback.
The recent decline respected the Fibonacci retracement zone, with price reacting strongly between the 0.618–0.786 levels, indicating active demand from buyers. This zone aligns with prior structure support, reinforcing its technical significance. The recovery from the lows shows higher lows, suggesting short-term bullish intent, though momentum is slowing near resistance.
Price is now trading below the descending trendline and near the upper Fibonacci retracement area, where sellers are showing interest. A clear break and hold above the trendline would open the door for a continuation toward the previous highs. Conversely, rejection from this area could lead to another retest of the mid or lower Fibonacci support levels.
The Aroon Oscillator is turning negative, signaling weakening bullish momentum and increasing risk of consolidation or a short-term pullback before the next directional move.
Key Levels to Watch:
Resistance: Descending trendline / recent swing high zone
Support: 0.618–0.786 Fibonacci retracement area
Bias: Neutral to cautiously bullish while above key support
This setup favors patience—waiting for either a confirmed breakout above resistance or a bullish reaction from support for higher-probability entries.
EURUSD Market StructureEURUSD is trading mid-range.
London is set to push price into a key area: 1.1798–1.1803.
This suggests potential delivery into premium as we head into NY.
HTF bias remains bearish.
I’m only interested in shorts after premium is tapped and structure confirms.
No confirmation, no trade.
If it shows up, I execute.
If not, I stay flat.
GBPJPY (4H) — RegimeWorks Trade Idea (Context, not prediction)After the initial accumulation phase, price pushed higher and formed Top 1 and Top 2, but the structure failed to hold the neckline (support didn’t sustain). Price then rotated back into another accumulation before expanding upward again inside an ascending channel, setting up a possible Top 3.
Following a confirmed rejection at the Top 3 area, my trade triggered with the neckline as the primary target.
Trade management (rules-based):
At +2R, I will close 50% of the position.
From there, I will trail the stop above new lower highs to lock in gains while allowing continuation.
Next scenario (only if confirmed):
If price breaks the neckline and then prints a clean rejection below it, I will consider another position based on that new confirmation.
This is a trade idea and workflow explanation — not financial advice and not a forecast.


