#057: Long Investment Opportunity on USD/JPY
The USD/JPY exchange rate is experiencing a delicate phase, in which the underlying structure remains bearish, but signs of a possible technical reaction are beginning to emerge. After an impulsive and well-structured decline, the market has reached an area of significant liquidity, where selling pressure appears to have found an initial form of absorption.
Recent momentum suggests that the dominant bearish movement may be entering a temporary slowdown. This is not currently a structural reversal, but rather a potential technical rebound within a still fragile trend. The latest candlesticks show a contraction in volatility and a progressive loss of seller strength, elements that often precede short-term corrective movements.
From a technical perspective, the price is moving near an area that has generated significant reactions in the past. This area serves as a potential base for temporary accumulation, but remains below a dynamic supply range that continues to exert pressure. True confirmation of a structured rebound would require a convincing breakout of intermediate resistance levels and a change in the sequence of highs and lows.
Momentum indicators show oversold conditions gradually dissipating, while medium-term dynamic averages remain skewed downward. This environment creates a typical "counter-trend pullback" pattern: trading is possible, but requires disciplined management and the awareness that the market could quickly return to the dominant direction.
On the macro level, the monetary policy differential continues to be a key element. However, in phases of technical excess, the price tends to rebalance before resuming a direction consistent with the fundamental framework. It is precisely at these times that the most attractive rebound opportunities develop, but they are also most sensitive to sudden shifts in sentiment.
In summary, USD/JPY is in a phase of potential technical reaction after a significant bearish extension. The underlying structure remains fragile, but the market is attempting to stabilize. The next move will depend on the price's ability to consolidate above the accumulation area and transform the rebound into a more structured movement.
In this context, discipline and understanding the structure remain key: the market should not be chased, but rather anticipated by understanding its cyclical phases.
Forex

GBPCAD: Forecast & Trading Plan
The charts are full of distraction, disturbance and are a graveyard of fear and greed which shall not cloud our judgement on the current state of affairs in the GBPCAD pair price action which suggests a high likelihood of a coming move down.
Disclosure: I am part of Trade Nation's Influencer program and receive a monthly fee for using their TradingView charts in my analysis.
❤️ Please, support our work with like & comment! ❤️

GOLD slowly climbing. GOLD is in the move UP. We will wait to hit RESISTANCE and then go in LONG if a BreakOut happens next week.

AUDNZD Will Go Lower From Resistance! Sell!
Take a look at our analysis for AUDNZD.
Time Frame: 4h
Current Trend: Bearish
Sentiment: Overbought (based on 7-period RSI)
Forecast: Bearish
The market is on a crucial zone of supply 1.175.
The above-mentioned technicals clearly indicate the dominance of sellers on the market. I recommend shorting the instrument, aiming at 1.170 level.
P.S
Overbought describes a period of time where there has been a significant and consistent upward move in price over a period of time without much pullback.
Like and subscribe and comment my ideas if you enjoy them!

GOLD Will Move Lower! Sell!
Please, check our technical outlook for GOLD.
Time Frame: 1h
Current Trend: Bearish
Sentiment: Overbought (based on 7-period RSI)
Forecast: Bearish
The price is testing a key resistance 4,989.15.
Taking into consideration the current market trend & overbought RSI, chances will be high to see a bearish movement to the downside at least to 4,868.42 level.
P.S
We determine oversold/overbought condition with RSI indicator.
When it drops below 30 - the market is considered to be oversold.
When it bounces above 70 - the market is considered to be overbought.
Like and subscribe and comment my ideas if you enjoy them!

SPX500: Bullish Push to 7030?As the previous analysis worked exactly as predicted, FX:SPX500 is eyeing a bullish continuation on the 4-hour chart , with price rebounding from support after recent highs, converging with a potential entry zone that could fuel upside momentum if buyers push through short-term resistance amid volatility. This setup suggests a rally opportunity in the uptrend, targeting higher levels with more than 1:2 risk-reward .🔥
Entry between 6920–6940 for a long position. Target at 7030 . Set a stop loss at a close below 6900 📊, yielding a risk-reward ratio of more than 1:2 . Monitor for confirmation via a bullish candle close above entry with rising volume, leveraging the index's momentum near support.🌟
📝 Trade Setup
🎯 Entry (Long):
6920 – 6940
(Entry from current price is valid with proper risk & position sizing.)
🎯 Target:
• 7030
❌ Stop Loss:
• Close below 6900
⚖️ Risk-to-Reward:
• > 1:2
💡 Your view?
Does SPX500 extend toward 7030 and new highs, or do you expect deeper consolidation before the next impulse? 👇

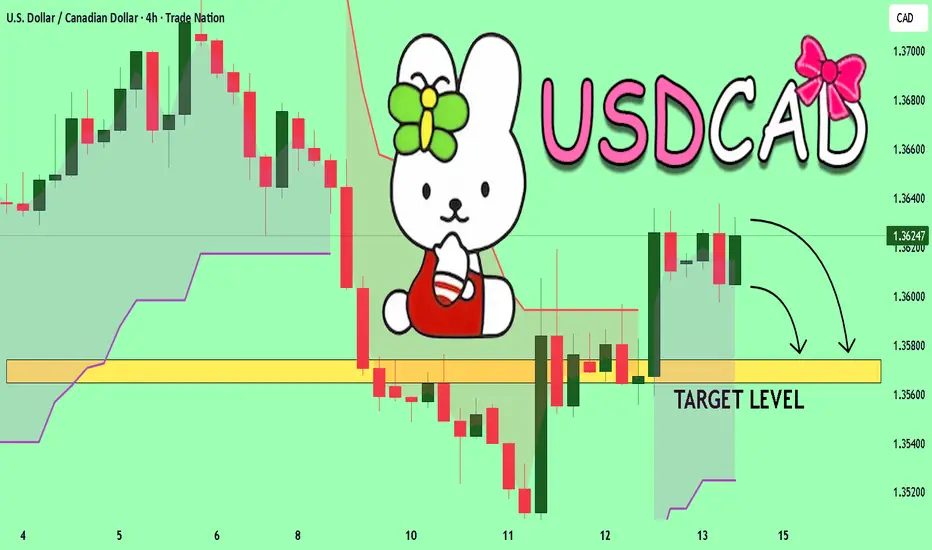
USDCAD Set To Fall! SELL!
My dear friends,
Please, find my technical outlook for USDCAD below:
The price is coiling around a solid key level - 1.3624
Bias - Bearish
Technical Indicators: Pivot Points Low anticipates a potential price reversal.
Super trend shows a clear sell, giving a perfect indicators' convergence.
Goal - 1.3574
About Used Indicators:
The pivot point itself is simply the average of the high, low and closing prices from the previous trading day.
Disclosure: I am part of Trade Nation's Influencer program and receive a monthly fee for using their TradingView charts in my analysis.
———————————
WISH YOU ALL LUCK
DXY H1 | Bullish Bounce OffThe price has bounced off our buy entry level at 86.63, which is a pullback support.
Our stop loss is set at 96.63, which is a pullback support.
Our take profit is set at 97.01, a pullback resistance slightly above the 50% Fibonacci retracement.
High Risk Investment Warning
Stratos Markets Limited fxcm.com Stratos Europe Ltd fxcm.com
CFDs are complex instruments and come with a high risk of losing money rapidly due to leverage. 69% of retail investor accounts lose money when trading CFDs with this provider. You should consider whether you understand how CFDs work and whether you can afford to take the high risk of losing your money.
Stratos Global LLC fxcm.com Losses can exceed deposits.
Please be advised that the information presented on TradingView is provided to FXCM (‘Company’, ‘we’) by a third-party provider (‘TFA Global Pte Ltd’). Please be reminded that you are solely responsible for the trading decisions on your account. Any information and/or content is intended entirely for research, educational and informational purposes only and does not constitute investment or consultation advice or investment strategy. The information is not tailored to the investment needs of any specific person and therefore does not involve a consideration of any of the investment objectives, financial situation or needs of any viewer that may receive it. Past performance is not a reliable indicator of future results. Actual results may differ materially from those anticipated in forward-looking or past performance statements. We assume no liability as to the accuracy or completeness of any of the information and/or content provided herein and the Company cannot be held responsible for any omission, mistake nor for any loss or damage including without limitation to any loss of profit which may arise from reliance on any information supplied by TFA Global Pte Ltd.
Stratos Trading Pty. Limited fxcm.com
Trading FX/CFDs carries significant risks. FXCM AU (AFSL 309763), please read the Financial Services Guide, Product Disclosure Statement, Target Market Determination and Terms of Business at fxcm.com

EURUSD LongI remain bullish based on the higher timeframes. Placed a buy limit order within this framework: 1W FVG ➡️ 1D FVG ➡️ 1D FP ➡️➡️➡️ 1W FVG.

GOLD 13/02 – H1 ROUTE MAP | COMPRESSION BEFORE EXPANSIONAfter a strong rebound from the 44xx region at the beginning of the month, gold is entering a clear range compression phase on the H1 timeframe. The price no longer maintains continuous upward momentum, but it has not yet returned to a strong downtrend structure. Instead, the market is forming a narrowing equilibrium zone – a state that often appears before a significant liquidity expansion phase.
On the macroeconomic front, recent US economic data shows improvement in the labor market, while the CPI has not created a strong enough surprise to change monetary policy expectations. Therefore, the USD is no longer rising strongly but has not weakened clearly either. This causes gold to fluctuate strongly intraday but lacks trend commitment. The market is not reacting to news that is too bad or too good – but because there is not yet a big enough reason to reprice the structure.
Technical observation on H1 shows that the previous downtrend structure (CHoCH from the peak) is still valid on the larger timeframe. However, the recent rebound has created a triangular accumulation zone, with the upper edge around 5030–5050 and the lower edge around 4970–4900. The lower FVG zones are continuously held, indicating that support still exists, but each approach to 5050 is rejected. This reflects a supply-demand balance state, not a clear trend.
In the current context, the 5030–5050 zone acts as a confirmation zone if the price is accepted above. At that point, the rebound could extend to 5120 and beyond. Conversely, if 4970 is breached with structural acceptance, the probability of sweeping down to the 4900–4820 zone will increase. These are important confluence points between the H1 structure and the H2 liquidity zone.
LucasGray does not trade within the compression zone. The market is accumulating energy. The breakout, when it occurs, will be clear, and what we need is the price reaction at the confirmation zone, not predicting the direction beforehand.
Current bias: Neutral – waiting for a breakout above 5050 or a loss of 4970 to confirm the next structure.
— LucasGrayTrading

XAUUSD Long: Holds Demand - Upside Toward $5,180 in PlayHello traders! Here’s a clear technical breakdown of XAUUSD (1H) based on the current market structure shown on the chart. Gold previously experienced a strong impulsive bullish move, which ultimately topped at a clear pivot high, where buying pressure began to fade and sellers stepped in aggressively. From this pivot point, price reversed sharply and entered a corrective bearish phase, forming a sequence of lower highs and lower lows. This move was guided by a well-defined descending supply trend line, confirming sustained selling pressure and controlled downside continuation rather than panic-driven selling. During this decline, price broke below a key Demand Zone around 5,000, triggering a bearish continuation and accelerating the sell-off toward the next pivot low. However, at this lower pivot point, selling momentum weakened significantly, and buyers responded with strong demand. This marked a structural shift, as price began forming higher lows and eventually broke above the descending supply trend line — an early signal that bearish control was losing strength.
Currently, after reclaiming the broken structure, XAUUSD transitioned into a ranging phase above demand, suggesting accumulation rather than distribution. The recent breakout from this range confirmed renewed buyer interest, with price now holding above the Demand Zone while respecting a rising demand trend line. Current price action shows consolidation near demand, indicating a healthy pause rather than rejection.
My primary scenario favors bullish continuation, as long as price holds above the 5,000 Demand Zone and continues to respect the ascending demand line. From a structural perspective, the failure of sellers to regain acceptance below demand suggests that the previous breakdown was corrective. A sustained bullish reaction from this area could lead to a move toward the 5,180 Supply Zone (TP1), where sellers may attempt to defend. A clean breakout and acceptance above supply would open the door for further upside expansion. However, a decisive breakdown and acceptance below the demand zone and rising trend line would invalidate the bullish scenario and signal deeper corrective risk. Until then, structure and price behavior continue to favor buyers. Manage your risk!

pre inflation chaoslooks like the market's trying to confuse us before continuing its bullish move towards new targets, stay safe. FX:EURUSD
GBP/USD | IFVG retest (READ THE CAPTION)By examining the 30m chart of GBPUSD, we can see that after yesterday's sudden drop, it kept going lower and lower, reaching 1.3590, below the Feb 9th NWOG low. Currently it is being traded at 1.3594, inside the IFVG. I expect GBPUSD to go a bit lower, to the IFVG low and then wait a bit to see where it'll head, whether it'll bounce back up or go even lower.
If it bounces back up: 1.3600, 1.3608, 1.3616 and 1.3624.
If it fails: 1.3588, 1.3580, 1.3572 and 1.3564.

GBPUSD Rebounds From Demand Bullish Move....
On the 1-hour chart, GBPUSD is trading inside a descending channel where overall structure remains bearish. However, price reacted strongly from the marked demand zone and climbed back above the Ichimoku cloud support, showing short-term bullish momentum. The market is now pushing into a supply/FVG area near channel resistance. If buyers maintain pressure, price is likely to extend upward toward the 1.3700 target zone before the broader downtrend attempts continuation.

Silver Bearish Pressure After Rejection Descending Resistance..
On the 1-hour XAGUSD chart, price remains under a clear descending trendline, confirming a broader bearish structure. After a sharp impulsive drop, the market retraced into a Fair Value Gap (FVG) and the Ichimoku cloud resistance, where selling pressure appeared again. Price is now consolidating below resistance, suggesting distribution before continuation. As long as the rejection zone holds, the bias favors another move downward toward the marked target area around the 69–70 zone.

WTI Crude Oil Accumulating at Demand Zone
On the 1-hour timeframe, price recently experienced a sharp bearish drop and tapped into a strong demand zone around **62.00–62.40**. After the selloff, the market shifted into a tight consolidation range, showing reduced volatility and seller exhaustion — a typical accumulation behavior.
The Ichimoku cloud above price is flattening, indicating momentum loss in the downtrend. Meanwhile, structure suggests buyers are defending the demand area, forming a base. If price holds this zone, a bullish reaction toward the marked **64.00 target point** becomes likely, aligning with previous structure resistance.
Overall bias: **short-term bullish correction from demand support**.

EURJPY STRONG BEARISH BIAS|SHORT|
✅EURJPY strong bearish displacement confirmed breakout below 5H supply. Structure shifted lower with sell-side liquidity in play. Expect minor retrace into premium before continuation toward external liquidity at target.Time Frame 5H.
SHORT🔥
✅Like and subscribe to never miss a new idea!✅

EUR-CHF Strong Bearish Continuation! Sell!
Hello,Traders!
EURCHF strong rejection from supply cluster and falling trendline confirms bearish breakout. Structure shifted lower, price trading in premium. Expect continuation toward sell-side liquidity at target.Time Frame 10H.
Sell!
Comment and subscribe to help us grow!
Check out other forecasts below too!
Disclosure: I am part of Trade Nation's Influencer program and receive a monthly fee for using their TradingView charts in my analysis.

USDCHF BEARISH BREAKOUT|SHORT|
✅USDCHF clean break below rising trendline with bearish displacement confirms BOS. Price trading under broken structure, expecting retrace into premium FVG before continuation toward sell-side liquidity at target. Time Frame 1H.
SHORT🔥
✅Like and subscribe to never miss a new idea!✅

AUD-USD Local Short! Sell!
Hello,Traders!
AUDUSD sharp rejection from 2H horizontal supply confirms bearish order flow. Liquidity grab above range completed, price trading back in discount. Expect continuation toward sell-side liquidity at target.Time Frame 2H.
Sell!
Comment and subscribe to help us grow!
Check out other forecasts below too!
Disclosure: I am part of Trade Nation's Influencer program and receive a monthly fee for using their TradingView charts in my analysis.

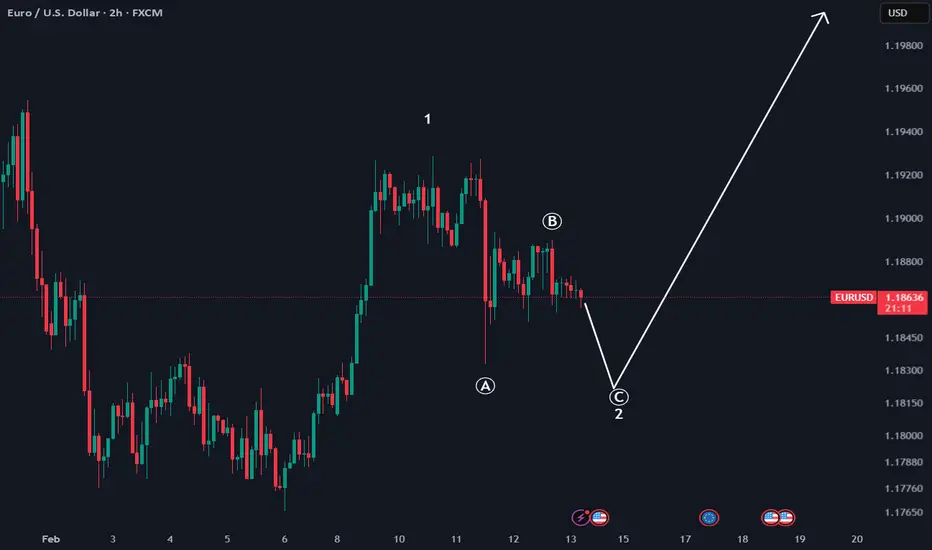
EUR-USD Free Signal! Buy!
Hello,Traders!
EURUSD mitigated 6H demand and filled FVG in discount, forming bullish reaction. Liquidity sweep below range completed, expecting continuation toward premium imbalance and prior highs.
--------------------
Stop Loss: 1.1831
Take Profit: 1.1910
Entry: 1.1863
Time Frame: 6H
--------------------
Buy!
Comment and subscribe to help us grow!
Check out other forecasts below too!
Disclosure: I am part of Trade Nation's Influencer program and receive a monthly fee for using their TradingView charts in my analysis.

USDJPY FREE SIGNAL|LONG|
✅USDJPY sell-side liquidity swept into 4H demand level with bullish displacement from discount area. Internal range holding, expect continuation toward external buy-side liquidity and premium FVG above.
—————————
Entry: 152.58
Stop Loss: 152.07
Take Profit: 153.31
Time Frame: 2H
—————————
LONG🚀
✅Like and subscribe to never miss a new idea!✅

US30: Growth & Bullish Continuation
Remember that we can not, and should not impose our will on the market but rather listen to its whims and make profit by following it. And thus shall be done today on the US30 pair which is likely to be pushed up by the bulls so we will buy!
Disclosure: I am part of Trade Nation's Influencer program and receive a monthly fee for using their TradingView charts in my analysis.
❤️ Please, support our work with like & comment! ❤️
