EURUSD Will Explode! BUY!
My dear followers,
This is my opinion on the EURUSD next move:
The asset is approaching an important pivot point 1.1795
Bias - Bullish
Technical Indicators: Supper Trend generates a clear long signal while Pivot Point HL is currently determining the overall Bullish trend of the market.
Goal - 1.1868
About Used Indicators:
For more efficient signals, super-trend is used in combination with other indicators like Pivot Points.
Disclosure: I am part of Trade Nation's Influencer program and receive a monthly fee for using their TradingView charts in my analysis.
———————————
WISH YOU ALL LUCK
Forex

EURJPY What Next? SELL!
My dear subscribers,
This is my opinion on the EURJPY next move:
The instrument tests an important psychological level 183.92
Bias - Bearish
Technical Indicators: Supper Trend gives a precise Bearish signal, while Pivot Point HL predicts price changes and potential reversals in the market.
Target - 183.65
My Stop Loss - 184.10
About Used Indicators:
On the subsequent day, trading above the pivot point is thought to indicate ongoing bullish sentiment, while trading below the pivot point indicates bearish sentiment.
Disclosure: I am part of Trade Nation's Influencer program and receive a monthly fee for using their TradingView charts in my analysis.
———————————
WISH YOU ALL LUCK

GBP/USD Chart Pattern..Overall downtrend (descending trendline respected)
Price reacted from a demand zone (yellow box)
Now attempting a trendline break / pullback
Ichimoku cloud still acting as dynamic resistance
This looks like a corrective move up, not full trend reversal yet.
🎯 Targets (Buy-from-demand → correction)
✅ Upside Targets (if holding buy)
🎯 Target 1 (TP1):
1.3775 – 1.3785
Previous structure + minor resistance
Good partial profit zone
🎯 Target 2 (TP2):
1.3830 – 1.3845
Major resistance / trendline retest
Matches My drawn “Target Point”
👉 I would book most profits here
❌ Invalidation / Risk Area
If price breaks and closes below 1.3640
Demand fails → continuation down likely
🔄 Alternative Scenario (If rejection happens)
If price rejects strongly from:
1.3780 or
1.3830
Then downside targets reopen:
1.3680
1.3640 (demand retest)
📌 Quick Summary
Bias: Pullback bullish, overall trend still bearish
Main Target: 1.3780
Extended Target: 1.3835
Trend traders: sell near upper target
Scalpers: partial at TP1, trail rest

Pennant Breaks Bullish on AJOANDA:AUDJPY has made quite a clear Pennant pattern and last night, price delivered a Breakout of the pattern determining it a Bullish Pennant!
Currently price seems to have exhausted itself after the Breakout creating a Higher High then the High starting the pattern sending a strong message that Buyers aren't done yet and we can look for price to continue pushing higher.
Before that happens, the Breakout must stabilize itself with a Retest of the Falling Resistance it made the Breakout of.
If successful, the Retest should generate Long opportunities!
Fundamentally, AUD found quite a bit of strength after:
1) RBA Hiked rates by 25 bps to 3.85% ( First Hike in 2 years)
2) It was suggested that more Rate Hikes could be down the line with markets pricing in around an 80% chance the RBA Hikes Rates to 4.1% at the May meeting.
www.tradingview.com
Weakness in the Yen is partially due to Prime Minister Sanae Takaichi suggesting the export industries could find opportunities with a weaker currency and looking to pursue "expansionary fiscal policies."
www.tradingview.com

EURUSD Short: Rally Stalls at Supply - Key Reaction Near 1.1800Hello traders! Here’s a clear technical breakdown of EURUSD (1H) based on the current chart structure. EURUSD has recently completed a notable structural shift after trading within a well-defined descending channel. During this phase, price consistently respected the falling resistance and printed lower highs and lower lows, confirming short-term bearish control. This bearish structure eventually reached a key pivot low, where selling pressure weakened and buyers began to step in. From this pivot point, EURUSD broke out of the descending channel, signaling the end of the corrective phase and the start of a bullish recovery.
Currently, EURUSD is pulling back from the supply area along the descending supply line, indicating a corrective retracement rather than a full trend reversal. Below the current price, the Demand Zone near 1.1800 stands out as a key level. This zone represents previous resistance turned support and aligns with the base of the impulsive move, making it a critical area for buyers to defend.
My primary scenario favors a pullback toward the 1.1800 Demand Zone while price remains below the descending supply line and the 1.1880–1.1900 Supply Zone. A controlled retracement into demand could provide a healthy correction within the broader bullish recovery structure, potentially setting the stage for another upside attempt. However, a strong rejection from the supply line followed by a clean breakdown and acceptance below 1.1800 would invalidate the bullish recovery scenario and signal a return to bearish pressure. Conversely, a decisive breakout and acceptance above the 1.1900 Supply Zone would confirm bullish continuation and open the door for further upside expansion. For now, EURUSD is at a key decision point, and patience is required as price reacts between supply and demand. Manage your risk!

AUDJPY Technical Analysis! SELL!
My dear subscribers,
AUDJPY looks like it will make a good move, and here are the details:
The market is trading on 109.05 pivot level.
Bias - Bearish
Technical Indicators: Both Super Trend & Pivot HL indicate a highly probable Bearish continuation.
Target - 107.35
About Used Indicators:
The average true range (ATR) plays an important role in 'Supertrend' as the indicator uses ATR to calculate its value. The ATR indicator signals the degree of price volatility.
Disclosure: I am part of Trade Nation's Influencer program and receive a monthly fee for using their TradingView charts in my analysis.
———————————
WISH YOU ALL LUCK

XAU I'M BACKHi, I’m Maicol, an Italian trader specialized in Gold since 2019.
I need your support.
Leave a like and follow me.
It’s a small gesture for you, but very important for my work.
Today live at 15:00 CET (Rome time).
🌞 GOOD MORNING EVERYONE 🌞
Gold Bias: Cautiously Bullish, with Elevated Volatility
Gold remains cautiously bullish.
Key drivers are renewed US government shutdown risk, delayed macro releases—especially labour data—and high policy uncertainty. These factors historically support safe-haven demand.
Upside, however, is not linear. Positioning is crowded and gold can still be used as a liquidity source if equities or crypto experience further stress.
As long as price holds above key structural supports, dips are more likely to be bought than sold. Headline risk and funding pressures keep volatility elevated.
US Government Shutdown and Gold
During the 2025 US government shutdown, gold strongly outperformed and pushed to record highs. Markets repriced political dysfunction, delayed macro data, and rising tail risks.
The key point:
With labour and inflation data postponed, rate expectations became less anchored, driving flows into hard assets such as gold.
US Labour Data
The January employment report (NFP and Employment Situation) may not be released as scheduled.
Reason:
The US federal government is in a partial shutdown after Congress failed to pass final funding legislation. Government funding lapsed at the end of January 2026.
Trump Era Market Environment
The Trump administration continues to create a high-volatility environment. Markets face repeated shocks, including trade conflicts, geopolitical tensions, government shutdowns, and sharp boom-bust cycles.
Volatility remains structural rather than temporary.
Trump to Ease Tariffs on India
President Trump announced plans to cut tariffs on Indian goods from 25% to 18%.
According to the White House, the move is linked to India’s reported commitments to halt Russian oil purchases, eliminate import tariffs on US goods, and increase purchases of American products by $500 billion.
Additional points:
India became a major buyer of discounted Russian oil after 2022
The additional 25% levy tied to Russian oil purchases will be removed
India’s tariff rate would move closer to levels applied to the EU and Japan
The decision comes as the US seeks progress on Ukraine-related negotiations
India recently finalized a major free-trade agreement with the European Union
Conclusion
Whether India materially reduces Russian oil imports—and how Russia, the EU, and China respond—will determine whether this marks a durable reset in US-India economic and geopolitical relations or a temporary tactical move.
🔔 Turn on notifications
so you don’t miss anything.
📬 For any doubts or questions,
write to me. I’ll reply.
🔍 NEXT APPOINTMENTS 🔍
As usual, live at 14:00/15:00
to follow the market in real time.
🔍 REMINDER 🔍
I avoid trading during the Asian and London sessions.
I focus on news at 14:30 IT time
and New York open at 15:30 IT time
Have a great day.
-GOOD TRADING
-MANAGE RISK
-BE PATIENT

USOIL Buyers In Panic! SELL!
My dear subscribers,
My technical analysis for USOIL is below:
The price is coiling around a solid key level - 65.73
Bias - Bearish
Technical Indicators: Pivot Points Low anticipates a potential price reversal.
Super trend shows a clear sell, giving a perfect indicators' convergence.
Goal - 65.04
My Stop Loss - 66.14
About Used Indicators:
By the very nature of the supertrend indicator, it offers firm support and resistance levels for traders to enter and exit trades. Additionally, it also provides signals for setting stop losses
Disclosure: I am part of Trade Nation's Influencer program and receive a monthly fee for using their TradingView charts in my analysis.
———————————
WISH YOU ALL LUCK

EURCAD The Target Is UP! BUY!
My dear friends,
Please, find my technical outlook for EURCAD below:
The price is coiling around a solid key level - 1.6121
Bias - Bullish
Technical Indicators: Pivot Points High anticipates a potential price reversal.
Super trend shows a clear buy, giving a perfect indicators' convergence.
Goal - 1.6151
Safe Stop Loss - 1.6102
About Used Indicators:
The pivot point itself is simply the average of the high, low and closing prices from the previous trading day.
Disclosure: I am part of Trade Nation's Influencer program and receive a monthly fee for using their TradingView charts in my analysis.
———————————
WISH YOU ALL LUCK

USDCAD Prints a Bullish Wick off the January 2026 LowsFrom a technical perspective, extended lower shadows reflect rejected downside levels — in other words, bullish dominance over bearish pressure. The weekly timeframe adds further weight to this signal, especially when aligned with the recent surge in US ISM Manufacturing PMI.
For DXY, my framework maintains:
A bearish bias following a confirmed weekly close below the 96 level
A bullish bias only if price holds cleanly above 98, 99.50, and the key 100.40 level
Against this backdrop, the following scenarios emerge for USDCAD.
USDCAD briefly dropped toward levels last seen in 2024 near 1.3480 before recovering above the 1.36 mark. Applying Fibonacci extensions from the September 2024 low, February 2025 high, and January 2026 low, key upside levels emerge at 1.3860, 1.40, and 1.4150 — zones that would help confirm the sustainability of the rebound before another potential acceleration higher.
On the downside, the 1.3580–1.3420 support zone remains critical. A failure to hold this area could expose the pair to a deeper structural breakdown toward the 1.33 and 1.30 levels.
Overall, bullish and bearish scenarios for USDJPY and USDCAD are expected to move in tandem with DXY, as the index continues to test its long-term 2008–2026 trend support.
- Razan Hilal

GBPCHF: Supply Zone Breakout 🇬🇧🇨🇭
GBPCHF broke and closed above a key daily supply cluster.
A breakout occurred with a high momentum bullish candle.
We see a retest of a broken structure now.
With a high probability, the pair will resume growing
and reach 1.0682 level then.
❤️Please, support my work with like, thank you!❤️
I am part of Trade Nation's Influencer program and receive a monthly fee for using their TradingView charts in my analysis.

EURUSDHello Traders! 👋
What are your thoughts on EURUSD?
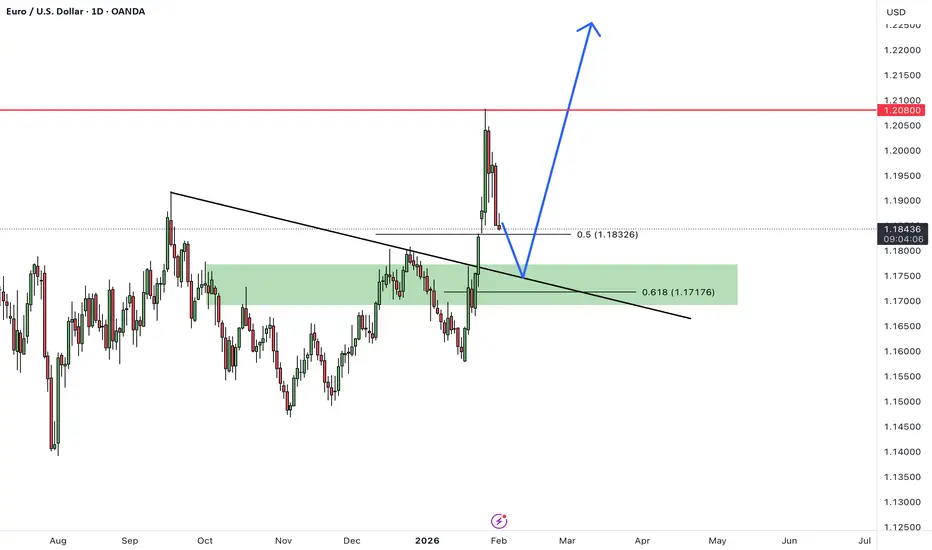
EUR/USD successfully broke above the key resistance zone and the descending trendline, extending its bullish move toward the 1.1200 area. From this level, the pair entered a corrective phase.
This pullback is considered a healthy correction and a pullback to the previously broken resistance, which now acts as support. As long as price holds above this zone, we expect buyers to step back in and push the pair toward higher levels.
Overall outlook remains bullish, and the current correction could offer a favorable opportunity for trend continuation.
Don’t forget to like and share your thoughts in the comments! ❤️
AUD/USD | IFVG Retest (READ THE CAPTION)As you can see in the hourly chart of AUDUSD, after today's open, it soared the skies and hit the IFVG High at 0.7043 and reached 0.7050 before dropping and closing in the IFVG zone and then afterwards, dropping lower, going outside the IFVG zone and now it's being traded at 0.7031. I expect AUD to retest the IFVG above it again, if it fails the targets are: 0.7026, 0.7019, 0.7012 and 0.7005.
If it manages to go through, the targets are: 0.7038, 0.7045, 0.7052 and 0.7059.

AUD/USD Rises Following RBA DecisionAUD/USD Rises Following RBA Decision
As the AUD/USD chart shows, the Australian dollar is holding above the psychological 0.700 level today after a bullish impulse triggered by the market’s reaction to the Reserve Bank of Australia’s (RBA) decision to raise the Cash Rate from 3.60% to 3.85%.
According to RBA Governor Michele Bullock, inflation (3.8%) remains too high, and the Bank “cannot allow it to get out of control again”. At the same time, the possibility of another rate hike in May has been left open.
The prospect of a tighter monetary policy stance should support the Australian dollar. However, the key question is whether AUD/USD can extend its advance and break above the important A peak from 29 January — the pair’s highest level since February 2023.
Technical Analysis of the AUD/USD Chart
Volatile price action in January has formed a broad ascending channel originating in November 2025. Within this structure:
→ bullish momentum accelerated on 19 January following a break above local resistance (shown in red);
→ the A peak confirmed the upper boundary of the channel as resistance;
→ the median (shown in blue) continues to act as support for the rising market.
It is worth noting that the ATR indicator is at its highest level in around nine months. This may point to increased activity by “smart money”, while the aggressive bearish rejection from the upper boundary could hint at their intentions.
As a result, the current rise in AUD/USD appears to be an initial emotional response to the news. There is a risk that the momentum may fade as the price approaches the highs near the A peak, where “smart money” could resume selling.
This article represents the opinion of the Companies operating under the FXOpen brand only. It is not to be construed as an offer, solicitation, or recommendation with respect to products and services provided by the Companies operating under the FXOpen brand, nor is it to be considered financial advice.

GBPNZD Will Go Down From Resistance! Short!
Here is our detailed technical review for GBPNZD.
Time Frame: 1h
Current Trend: Bearish
Sentiment: Overbought (based on 7-period RSI)
Forecast: Bearish
The market is trading around a solid horizontal structure 2.277.
The above observations make me that the market will inevitably achieve 2.270 level.
P.S
The term oversold refers to a condition where an asset has traded lower in price and has the potential for a price bounce.
Overbought refers to market scenarios where the instrument is traded considerably higher than its fair value. Overvaluation is caused by market sentiments when there is positive news.
Like and subscribe and comment my ideas if you enjoy them!

After a strong rally, the market is cooling off to retest equiliHello everyone,
EURUSD is currently displaying a very familiar forex market behavior: a sharp advance → profit-taking → a return toward balance.
Earlier, EURUSD rebounded clearly from the 1.16 area, forming a sequence of higher highs and higher lows, with EMA 34 and EMA 89 stacked cleanly and sloping upward. That rally stalled as price reached the 1.20+ zone, where profit-taking pressure began to surface. From there, the market lost momentum: candle bodies became smaller, upper wicks appeared more frequently, and price slipped back below EMA 34. The key point, however, is that EMA 89 remains intact. To me, this signals a cooldown after an overheated run rather than a genuine trend break.
At the moment, EMA 34 is acting as short-term resistance when tested from below, while EMA 89 continues to slope upward around the 1.18–1.181 area. This structure suggests that short-term buyers have stepped aside, but medium-term flow is still present. In healthy uptrends, EMA 89 often serves as the market’s “line of confidence,” and only a clear H4 close below this zone would prompt me to consider a weaker scenario.
Volume also supports the view of a constructive pullback. Selling pressure has appeared alongside bearish candles, but without explosive or panic-like characteristics. This looks more like a process of position rebalancing after a strong rally than a true distribution phase. If it were distribution, we would typically see heavier and more persistent sell volume.
In terms of key levels, the 1.180–1.182 zone is the most important support right now, where EMA 89 converges with the equilibrium area of the prior advance. Holding this region keeps the medium-term uptrend structurally intact. If USD strength becomes more pronounced, the 1.170–1.172 zone would be the next deeper buffer. On the upside, the 1.188–1.190 area is near-term resistance, where EMA 34 aligns with a previously rejected price zone; rallies into this area should still be viewed as technical pullbacks for now.
Looking at the broader context, the USD appears to be undergoing a technical rebound after a period of weakness, but there is still no sufficiently strong narrative to drive a long-term reversal. The ECB has also not introduced aggressive easing pressure. As a result, the current decline in EURUSD fits well with a technical correction rather than a shift in the underlying macro story.

EURUSD Is Very Bullish! Long!
Take a look at our analysis for EURUSD.
Time Frame: 4h
Current Trend: Bullish
Sentiment: Oversold (based on 7-period RSI)
Forecast: Bullish
The market is testing a major horizontal structure 1.179.
Taking into consideration the structure & trend analysis, I believe that the market will reach 1.188 level soon.
P.S
Please, note that an oversold/overbought condition can last for a long time, and therefore being oversold/overbought doesn't mean a price rally will come soon, or at all.
Like and subscribe and comment my ideas if you enjoy them!

AUDUSD Still PumpingAUDUSD is trading in a strong bullish continuation phase after a clean impulsive breakout, with price currently consolidating above the previous resistance zone that has now flipped into short term support, signaling healthy price acceptance rather than exhaustion. The sharp rally reflects improving risk sentiment, sustained weakness in the US dollar, and supportive fundamentals from Australia including stable RBA policy expectations, resilient labor data, and strength in commodity-linked currencies, while recent US macro data continues to fuel speculation around future Fed easing which keeps downside pressure on USD. Technically this structure favors a pullback and continuation scenario, where shallow retracements are being absorbed by buyers, momentum remains intact, and higher highs with higher lows confirm trend strength, making bullish continuation, trend following, breakout retest, and buy the dip strategies favorable as long as price holds above the key support area and maintains bullish market structure toward higher targets.

GOLD 03/02: H4 ROUTE MAP – SMC STRUCTURE UPDATEGold prices have swept the peak liquidity and broken the upward structure on H4. But this is not the start of a new trend, rather a rebalancing phase after the sell-off. The next direction will depend on how prices react at key SMC zones.
CONTEXT
Expectations around the Fed and interest rate path remain unclear → USD and yields are highly volatile.
Geopolitical instability continues to provide a supportive backdrop for gold, but not enough to create a new trend on its own.
As a result: gold reacts strongly during the day, but there is no long-term commitment yet.
➡️ This explains why prices bounce quickly but have not broken the structure.
H4 TECHNICAL STRUCTURE
The previous H4 uptrend has been broken:
Sweep peak
CHoCH decline
Current prices are in a technical pullback after a strong decline.
FVG + Fibonacci zones are playing the role of the next decisive points.
ROUTE MAP – PRICE ZONES TO WATCH
🔴 UPPER ZONE – SELL REACTION ZONE
👉 5230 – 5300
H4 FVG
Fib 0.618 – 0.705
Typical pullback zone in a declining structure
➡️ If prices rebound here but are not accepted, the upward move is just a pullback to continue the decline.
👉 5350 – 5450
High FVG + Fib 0.786
Only if prices hold above this zone, the declining structure will truly be invalidated.
🟢 LOWER ZONE – BUY REACTION / SUPPORT
👉 4950 – 5000
Fib 0.5
Balance zone – likely to see two-way reactions
👉 4850 – 4900
Fib 0.382
H4 Demand – important support zone
👉 4600 – 4550
Liquidity low
Only activated if bearish continues strongly
HOW WE MONITOR THE MARKET NOW
In the current context:
News creates short-term momentum
But the H4 structure still guides the trend
We focus on:
Observing price reactions at FVG & fib
Clearly distinguishing:
daily reflex moves (scalp)
and structure acceptance for swing
Strong pullbacks often attract emotions, but the market only truly speaks the truth when it holds key price zones.
Future updates will focus on actual price reactions, not predictions. Follow to not miss important reaction points this week.
— LucasGrayTrading

GBP/AUD SENDS CLEAR BEARISH SIGNALS|SHORT
GBP/AUD SIGNAL
Trade Direction: short
Entry Level: 1.971
Target Level: 1.964
Stop Loss: 1.975
RISK PROFILE
Risk level: medium
Suggested risk: 1%
Timeframe: 1h
Disclosure: I am part of Trade Nation's Influencer program and receive a monthly fee for using their TradingView charts in my analysis.
✅LIKE AND COMMENT MY IDEAS✅

CHF/JPY LONG FROM SUPPORT
CHF/JPY SIGNAL
Trade Direction: long
Entry Level: 199.294
Target Level: 200.072
Stop Loss: 198.773
RISK PROFILE
Risk level: medium
Suggested risk: 1%
Timeframe: 1h
Disclosure: I am part of Trade Nation's Influencer program and receive a monthly fee for using their TradingView charts in my analysis.
✅LIKE AND COMMENT MY IDEAS✅

GOLD back on the RISE!GOLD after a nice drop in lower time frames and a pullback in higher time frames is gaining strength.

EURCHF || Potential Bullish SetupTechnical Summary
Cross-timeframe analysis of OANDA:EURCHF reveals bullish confluence from the Daily timeframe down to our Hourly timeframe, strengthening our directional outlook.
Strategy Framework
With multiple timeframes in agreement, we'll ideally wait for price to correct towards our POI before executing entries aligned with the general idea that price will move toward Target
Confluence Patterns
✅ Impulsive moves away from POI
✅ Long wick rejections
✅ Break of structure (BOS)
✅ Horizontal level rejections
🚩 IDEA INVALIDATION
Bearish pressure emerges with impulsive momentum past POI
💬 LIKE or COMMENT if this idea sparks your interest, or share your thoughts below!
👍 FOLLOW to keep up with fresh ideas.
Tidypips: "Keep It Clean, Trade Mean!"
🛡 DISCLAIMER
This content is provided for informational and educational purposes—not financial advice. Trading is risky business. Do your homework, manage your risk, and trade responsibly.
