SILVER BULLS ARE STRONG HERE|LONG
Hello, Friends!
SILVER pair is in the downtrend because previous week’s candle is red, while the price is obviously falling on the 4H timeframe. And after the retest of the support line below I believe we will see a move up towards the target above at 10,123.0 because the pair oversold due to its proximity to the lower BB band and a bullish correction is likely.
Disclosure: I am part of Trade Nation's Influencer program and receive a monthly fee for using their TradingView charts in my analysis.
✅LIKE AND COMMENT MY IDEAS✅
Forex

GBPUSDGBP is less attractive for long setups, as major liquidity pools on the monthly timeframe have already been taken. We need to see whether selling pressure will persist. For now, the plan is continuation of the bullish 1W OF and 1D OF via a pullback into the discount range.

Buy the Rumor and Sell The NewsMarkets move before information becomes official because positioning always precedes confirmation. By the time news is released, expectations are already priced in. “Buy the rumor” describes this positioning phase, where capital reallocates based on anticipation rather than facts.
Traders who act only on confirmation arrive when risk is highest and asymmetry is lowest.
Rumors form when uncertainty exists and narrative fills the gap. Expectations about events, data, upgrades, or macro decisions begin circulating long before outcomes are known. During this phase, liquidity is thin and positioning builds gradually. Price advances not because certainty exists, but because participants want exposure before clarity removes opportunity.
As the rumor spreads, price often trends cleanly. Pullbacks are shallow, momentum holds, and dips are bought quickly. This is not because the outcome is guaranteed, but because risk is perceived as acceptable relative to potential upside.
The danger appears near confirmation. When the news becomes official, uncertainty collapses. Everyone knows the outcome, and participation peaks. Liquidity increases sharply as late buyers enter and early participants begin exiting. This is why markets frequently stall, reverse, or distribute immediately after positive news. The trade was never about the event itself. It was about positioning ahead of it.
Selling after confirmation is not manipulation. It is inventory management. Capital that entered early needs liquidity to exit. News provides that liquidity. When expectations are fully priced, continuation requires new incentive, not old information.
The practical takeaway is not to trade headlines. It is to observe behavior before them. Watch how price reacts during anticipation. Strong trends with controlled pullbacks suggest accumulation. Choppy price with sharp spikes suggests distribution forming. When confirmation arrives, reassess rather than assume continuation.
“Buy the rumor” works because markets move on expectations and pause on certainty. Traders improve when they stop reacting to news and start reading how the market positions itself in advance. The edge lies in understanding when probability is expanding and when it has already been spent.

EURUSD last move before we dumpRisky trade with a good R/R
I believe we have one more move before we crash down on euro and get bullish on dollar pairs
fasten your seatbelts!! FX:EURUSD

TheGrove | USDJPY Buy | Idea Trading AnalysisUSDJPY is moving in an ascending channel.. Price is trading inside a bullish ascending channel after a strong break of structure.
Previous resistance has flipped into demand, confirming bullish continuation.
We expect a decline in the channel after testing the current level which suggests that the price will continue to rise..
Hello Traders, here is the full analysis.
I think we can soon see more fall from this range! GOOD LUCK! Great BUY opportunity USDJPY
I still did my best and this is the most likely count for me at the moment.
-------------------
Traders, if you liked this idea or if you have your own opinion about it, write in the comments. I will be glad 🤝

#052: Long Investment Opportunity on USD/JPY
The USD/JPY exchange rate is experiencing a particularly interesting market phase, where underlying bearish pressure coexists with technical signals of a possible short-term reaction. After a sharp decline, the price showed signs of slowing, suggesting the entry into a consolidation phase, typical of markets absorbing directional excess.
From a structural perspective, the main trend remains down, consistent with a sequence of lower highs and lower lows on higher time frames. However, this very trend has favored a progressive accumulation of speculative positions in the same direction, creating the conditions for a potential technical rebound. In such environments, the market often tends to move against the grain, hitting areas of liquidity before deciding on the next direction.
Price action analysis highlights how the latest phases of decline have been accompanied by increased volatility and impulsive movements, elements that often herald a phase of rebalancing. The appearance of candlesticks with pronounced wicks and less directional closes suggests that selling pressure is gradually diminishing, leaving room for corrective reactions.
From a volume perspective, the market is also showing signs of absorption. After the initial push, volumes tend to stabilize, indicating that the most aggressive traders have already taken positions. In these environments, subsequent movements are often driven by technical re-entries and position coverings, rather than new directional initiatives.
On the macroeconomic front, the monetary policy differential continues to support the dollar in the medium to long term, while the yen remains structurally weak. However, in the short term, this imbalance does not prevent the market from experiencing temporary rebounds, especially when positioning becomes excessively unbalanced. It is precisely in these phases that the exchange rate tends to move more technically than fundamentally.
The intermarket picture is currently not showing signs of strong risk aversion that would favor a decisive flow towards the yen. This reduces the likelihood of immediate downward accelerations and strengthens the hypothesis of a price breathing space. Bond and currency markets appear to be moving in a more orderly fashion, without sudden shocks.
In summary, USD/JPY is in an unstable equilibrium: the main trend remains bearish, but the market is showing signs of a corrective phase. In these contexts, patience and a good understanding of the structure become crucial, as the most interesting moves often emerge precisely when consensus appears excessively biased in one direction.
As always, the price will provide clarity. The market's ability to sustain any rebounds or, conversely, decisively resume its main direction will offer valuable insights into institutional investors' intentions in the coming sessions.

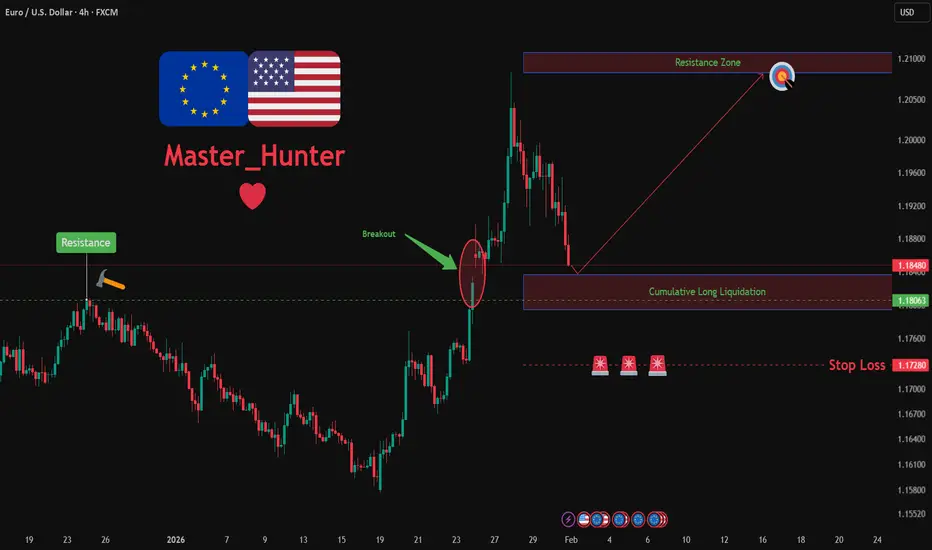
EURUSD: Bullish Push to 1.208?FX:EURUSD is eyeing a bullish continuation on the 4-hour chart , with price rebounding from support after recent consolidation, converging with a potential entry zone that could fuel upside momentum if buyers push through short-term resistance. This setup suggests a rally opportunity amid the ongoing uptrend, targeting higher levels with approximately 1:2.5 risk-reward .🔥
Entry between 1.1800–1.18350 for a long position. Target at 1.2080 . Set a stop loss at a daily close below 1.1828 , yielding a risk-reward ratio of approximately 1:2.5 . Monitor for confirmation via a bullish candle close above entry with rising volume, leveraging the pair's momentum near support.🌟
Fundamentally , EURUSD is trading around 1.182 in early February 2026, with key events this week potentially driving volatility. For the Euro, Thursday February 5 at 1:15 PM UTC brings the ECB Interest Rate Decision (previous 1.75%), where a hold or dovish signals could weaken EUR amid economic concerns. Also on February 5, the ECB Press Conference at 1:45 PM UTC for policy insights that may cause sharp moves. For the US Dollar, Wednesday February 4 at 2:15 PM UTC features ADP Non-Farm Employment Change (Jan, forecast 41K), potentially pressuring USD if softer. Thursday February 5 at 1:30 PM UTC brings Unemployment Claims (week of Jan 31, forecast 209K), with higher figures weakening USD. Friday February 6 at 1:30 PM UTC includes Non-Farm Payrolls (Jan, forecast 50K) and Unemployment Rate (Jan, forecast 4.4%), the week's highlight—weak data could favor EUR upside. 💡
📝 Trade Setup
🎯 Entry (Long):
1.1800 – 1.1835
(Entry from current price is valid with proper risk & position sizing.)
🎯 Target:
• 1.2080
❌ Stop Loss:
• Daily close below 1.1828
⚖️ Risk-to-Reward:
• ~ 1:2.5
💡 Your view?
Does EURUSD continue higher toward 1.2080, or will ECB/NFP volatility force another consolidation before the next leg up? 👇
EURUSD closed January below the 1M MA200! Bear Cycle confirmed?The EURUSD pair closed last month's (January's) 1M candle below its 1M MA200 (orange trend-line) even though it broke above it for the first time in 8 years (since February 2018)! As mentioned on our last week's analysis, that was would be a strong bearish signal long-term, as the pair hasn't closed a 1M candle above the 1M MA200 since November 2014 and every test or approach near it was a market Top, like January 2021 and February 2018.
So as long as the market keeps closing monthly candles below its 1M MA200, we will stay bearish, looking towards a 2-year Bear Cycle, similar to 2021 - 2022 and 2018 - 2019. As mentioned last week, we have a minimum Target at 1.0200 (near the Jan 2025 Low Support) for this Bear Cycle.
In addition, look the huge 1M RSI Lower Highs Bearish Divergence (against the price's Higher Highs) following the June 2025 rejection on the 8-year Resistance. An extra signal of strength reversal.
---
** Please LIKE 👍, FOLLOW ✅, SHARE 🙌 and COMMENT ✍ if you enjoy this idea! Also share your ideas and charts in the comments section below! This is best way to keep it relevant, support us, keep the content here free and allow the idea to reach as many people as possible. **
---
💸💸💸💸💸💸
👇 👇 👇 👇 👇 👇

EURUSD: Growth & Bullish Forecast
Remember that we can not, and should not impose our will on the market but rather listen to its whims and make profit by following it. And thus shall be done today on the EURUSD pair which is likely to be pushed up by the bulls so we will buy!
Disclosure: I am part of Trade Nation's Influencer program and receive a monthly fee for using their TradingView charts in my analysis.
❤️ Please, support our work with like & comment! ❤️

AUDCHF: Short Signal with Entry/SL/TP
AUDCHF
- Classic bearish formation
- Our team expects fall
SUGGESTED TRADE:
Swing Trade
Sell AUDCHF
Entry Level - 0.5398
Sl - 0.5411
Tp - 0.5380
Our Risk - 1%
Start protection of your profits from lower levels
Disclosure: I am part of Trade Nation's Influencer program and receive a monthly fee for using their TradingView charts in my analysis.
❤️ Please, support our work with like & comment! ❤️

GOLD Massive Long! BUY!
My dear friends,
My technical analysis for GOLD is below:
The market is trading on 4708.4 pivot level.
Bias - Bullish
Technical Indicators: Both Super Trend & Pivot HL indicate a highly probable Bullish continuation.
Target - 4829.8
Recommended Stop Loss - 4622.8
About Used Indicators:
A pivot point is a technical analysis indicator, or calculations, used to determine the overall trend of the market over different time frames.
Disclosure: I am part of Trade Nation's Influencer program and receive a monthly fee for using their TradingView charts in my analysis.
———————————
WISH YOU ALL LUCK

EURUSD WEEKLY OUTLOOKPrimary focus:
– EURUSD
– London & NY sessions
What to lookout for:
Is price expanding or ranging?
No rush.
No forcing trades.
Let the market come to us.

XAUUSD Long: Defends Trend Support, Targeting $5,190 SupplyHello traders! Here’s a clear technical breakdown of XAUUSD (2H) based on the current chart structure. Gold remains in a broader bullish environment after a strong impulsive move that developed from a well-defined accumulation range. Following this consolidation phase, price broke to the upside and began respecting a rising trend line, confirming sustained buyer control and healthy trend conditions. During the advance, multiple bullish breakouts occurred above prior resistance levels, each followed by continuation, reinforcing the strength of the underlying trend. This bullish leg ultimately pushed price into a major Supply Zone around 5,190, where upside momentum began to stall.
Currently, at the supply area, Gold faced strong selling pressure, leading to a sharp pullback and the formation of a descending supply line, signaling short-term corrective pressure within the broader uptrend. Price then dropped toward a key Demand Zone near 4,940, which aligns closely with the rising trend line and a previous breakout structure. This confluence of horizontal demand and dynamic trend support makes the zone technically significant. The recent decline appears corrective rather than impulsive, suggesting profit-taking and short-term distribution instead of a full trend reversal.
My scenario: as long as XAUUSD holds above the 4,940 Demand Zone and continues to respect the rising trend line, the broader bullish structure remains intact. A sustained reaction from this demand area could lead to a recovery move back toward the 5,190 Supply Level (TP1). A clean breakout and acceptance above this supply would confirm bullish continuation and open the door for further upside expansion. However, a decisive breakdown below the demand zone and trend line would invalidate the bullish bias and signal a deeper corrective phase. For now, Gold is at a key decision area, with buyers attempting to defend structure and resume the broader uptrend. Manage your risk!

Chart Analysis & Trade Idea (Micro Silver – 1H)Price was moving inside a consolidation / range (blue box).
A strong bearish breakout occurred from the range, showing seller dominance.
After a sharp drop, price has reached a demand zone (green box).
Demand Zone Insight:
Buyer interest is visible inside the demand zone.
Strong rejection from the lows indicates selling pressure is weakening.
A possible liquidity sweep (SL hunt) below the lows followed by stabilization suggests reversal potential.
Trade Idea (Bullish Reversal Setup):
Entry: Buy from the demand zone or after bullish confirmation
Stop Loss: Below the demand zone / recent low
Targets:
TP1: 90.00
TP2: 95.00
TP3: 100.00 (next supply / resistance area)
Confirmation Signals:
Bullish engulfing or strong bullish close on 1H / 15M
Break of minor structure (higher high) for confirmation.

SOL Breakdown in Bearish ChannelThis 2-hour SOL/USD chart with Ichimoku Cloud shows a sustained downtrend inside a descending channel. After topping near the upper resistance, price rolled over, lost cloud support, and formed a bearish consolidation before breaking lower. SOL continues to trade below key resistance around 128–130, with the cloud acting as overhead pressure. The projected downside target sits near 104, signaling bearish continuation unless price reclaims the channel and cloud.

XAUUSD Trend Reversal (CHOCH)
This is a 1-hour XAUUSD (Gold/USD) chart. Price was moving inside a rising channel supported by the Ichimoku cloud. After making a high, the market showed a Change of Character (CHOCH), broke below key support and the cloud, and shifted from bullish to bearish structure. Strong selling pressure followed, with price heading toward the lower marked target zone, signaling downside continuation.
Entry at 4895
Target point 4580

XAGUSD Channel Breakdown
This is a 1-hour XAGUSD (Silver/USD) chart. Price was moving in a clear ascending channel with Ichimoku support, then broke down below the channel and key support zone. After the breakdown, strong bearish momentum appeared, indicating a trend reversal from bullish to bearish, with downside continuation toward the marked lower target area.

GBPJPY Is Going Up! Long!
Take a look at our analysis for GBPJPY.
Time Frame: 4h
Current Trend: Bullish
Sentiment: Oversold (based on 7-period RSI)
Forecast: Bullish
The market is trading around a solid horizontal structure 210.351.
The above observations make me that the market will inevitably achieve 212.357 level.
P.S
The term oversold refers to a condition where an asset has traded lower in price and has the potential for a price bounce.
Overbought refers to market scenarios where the instrument is traded considerably higher than its fair value. Overvaluation is caused by market sentiments when there is positive news.
Like and subscribe and comment my ideas if you enjoy them!

Gold Reclaims Support After Sharp Drop - 5,100 Resistance as TP1Hello traders! Here’s my technical outlook on XAUUSD (4H) based on the current chart structure. Gold initially traded within a clearly defined range, where price moved sideways, signaling a period of consolidation and market balance before the next impulsive move. From this range, XAUUSD broke to the upside and transitioned into a well-structured ascending channel, confirming strong buyer control with a consistent sequence of higher highs and higher lows. Price respected both the rising support line and the channel resistance, highlighting healthy bullish conditions throughout this phase. As the uptrend developed, gold eventually approached the key Resistance / Seller Zone around 5,100, where selling pressure became evident. Although price briefly broke above this level, the move lacked acceptance and resulted in a sharp rejection, forming a fake breakout and trapping late buyers. Following this rejection, XAUUSD dropped aggressively toward the Buyer Zone around 4,890–4,810, which aligns with previous resistance turned support and a key horizontal support level. The reaction from this area was strong, indicating active demand and buyer interest returning to the market. Currently, price is stabilizing above the Buyer Zone and attempting to recover after the fake breakdown. This behavior suggests a corrective rebound rather than a full trend reversal at this stage. Structurally, as long as gold holds above the Buyer Zone and maintains acceptance above support, a recovery move toward the 5,100 Resistance Level (TP1) remains possible. This area also overlaps with the Seller Zone, where selling pressure is likely to reappear. My scenario: holding above the Buyer Zone keeps the corrective bullish recovery intact, with 5,100 as the primary upside target. A strong rejection from resistance could resume downside pressure, while a decisive breakdown below the Buyer Zone would invalidate the recovery scenario and signal continuation of the broader corrective move. For now, XAUUSD is at a key decision area, with buyers attempting to defend support and build upside momentum. Please share this idea with your friends and click Boost 🚀

EUR/USD – 1H | Range Breakdown & Bearish Continuation SetupEUR/USD previously traded in a clear accumulation range (green box), which acted as a base for a strong bullish impulsive move. After the breakout, price entered a distribution / consolidation zone (blue box), where upside momentum weakened and sellers gradually gained control.
Price has now broken below the range support, confirming a bearish range breakdown. The current structure shows:
Lower highs forming inside the range before the breakdown
Strong rejection from the upper boundary of the blue zone
Acceptance below the range, indicating bearish continuation potential
Bias: Bearish
Key Level: Former range support acting as resistance
Expectation: A corrective pullback toward the broken support, followed by continuation to the downside.
Trade Idea (Conceptual):
Look for sell opportunities on retracements into the broken range
Bearish continuation favored while price remains below the range low
Downside targets lie toward the next demand zone / liquidity below
Market Logic:
This is a classic range expansion → distribution → breakdown scenario. Once price fails to reclaim the range, continuation moves often follow as trapped buyers exit positions.

Why the Same Strategy Performs Differently in Crypto and ForexMany traders experience the same frustration. A strategy shows consistency in one market and breaks down in another. The instinctive reaction is to question the rules, indicators, or entries. In most cases, the strategy is not the problem. The environment is.
Crypto and Forex operate under very different structural conditions. Crypto trends tend to expand faster, with sharper volatility and deeper intraday swings. Liquidity is thinner, order books change rapidly, and price frequently overshoots levels before stabilizing. Forex moves more slowly, with deeper liquidity and more controlled reactions, especially during active sessions.
These differences change how a strategy behaves in practice. Stop placement that works well in Forex can be too tight for Crypto, where routine volatility regularly exceeds technical boundaries. Profit targets that feel conservative in Crypto may be unrealistic in Forex, where expansion unfolds more gradually. The logic of the setup remains sound, but the execution parameters no longer match the market.
Time also plays a role. Crypto trades continuously, meaning trends can develop at any hour and extend without the pauses created by session boundaries. Forex activity is concentrated around specific windows, and strategies often perform best when aligned with those periods. Running the same rules outside their optimal timing reduces effectiveness.
Risk sequencing further amplifies these differences. In Crypto, clusters of volatility can create rapid drawdowns even when the strategy remains statistically valid. In Forex, losses are often more evenly distributed, allowing smoother equity curves. Traders who do not adjust position sizing or expectations misinterpret this as inconsistency.
Successful traders adapt execution while preserving logic. Entry criteria, risk models, and trade management evolve to fit the market’s structure. The strategy stays the same. The application changes. Understanding this distinction is what allows traders to remain consistent across asset classes rather than constantly searching for something new.

Trading Gold Without a Stop Loss: A Slow Suicide1️⃣ No Stop Loss Is Not Courage
Many traders believe that trading gold without a Stop Loss shows confidence, toughness, or the ability to withstand volatility.
In reality, it often means the opposite.
Not using a Stop Loss usually comes from one simple reason: an unwillingness to admit being wrong. When price moves against the position, instead of accepting a controlled loss, traders choose to hold and convince themselves that gold will eventually come back.
The problem is that the market does not operate on personal belief.
Not having a Stop Loss does not make you stronger.
It only makes your mistakes harder to fix.
2️⃣ In Gold Trading, No Stop Loss Means No Brakes
XAUUSD is a high-volatility market that reacts aggressively to news and capital flows.
Price can move far and fast — sometimes within minutes.
Trading gold without a Stop Loss is like driving downhill without brakes.
At first, it may feel manageable.
But once momentum accelerates, you no longer have a choice.
Gold does not care where you entered.
And it will not stop just because your account is in pain.
3️⃣ A Trade Without a Stop Loss Rarely Kills You Instantly
The real danger is that it kills you slowly.
It starts with a small drawdown.
Then a deeper one.
Until you no longer have the emotional clarity to exit.
What began as a trade becomes:
- A holding position
- A hope trade
- A prayer trade
At that point, it is not just your account at risk — your discipline and mental control are already gone.
And once emotions take over decision-making, the outcome is usually inevitable.
4️⃣ Long-Term Traders Are Not the Ones Who Win the Most
They are the ones who lose with limits.
A Stop Loss is not there to be hit.
It exists so you always know:
- Where you are wrong
- How much you are willing to lose
- And whether you can come back tomorrow
In gold trading, a Stop Loss is not a personal preference.
It is the price of staying in the game.
Without it, sooner or later, the market will teach you this lesson — with real money.

GBP/AUD BEST PLACE TO BUY FROM|LONG
Hello, Friends!
GBP/AUD pair is trading in a local downtrend which we know by looking at the previous 1W candle which is red. On the 4H timeframe the pair is going down too. The pair is oversold because the price is close to the lower band of the BB indicator. So we are looking to buy the pair with the lower BB line acting as support. The next target is 1.970 area.
Disclosure: I am part of Trade Nation's Influencer program and receive a monthly fee for using their TradingView charts in my analysis.
✅LIKE AND COMMENT MY IDEAS✅
