Potential bullish rise?GBP/CHF could make a short-term pullback to the support level, which is a pullback support, and could bounce from this level to our take profit.
Entry: 1.0607
Why we like it:
There is a pullback support level.
Stop loss: 1.0531
Why we like it:
There is a pullback support level.
Take profit: 1.0714
Why we like it:
There is an overlap resistance level.
Enjoying your TradingView experience? Review us!
Please be advised that the information presented on TradingView is provided to Vantage (‘Vantage Global Limited’, ‘we’) by a third-party provider (‘Everest Fortune Group’). Please be reminded that you are solely responsible for the trading decisions on your account. There is a very high degree of risk involved in trading. Any information and/or content is intended entirely for research, educational and informational purposes only and does not constitute investment or consultation advice or investment strategy. The information is not tailored to the investment needs of any specific person and therefore does not involve a consideration of any of the investment objectives, financial situation or needs of any viewer that may receive it. Kindly also note that past performance is not a reliable indicator of future results. Actual results may differ materially from those anticipated in forward-looking or past performance statements. We assume no liability as to the accuracy or completeness of any of the information and/or content provided herein and the Company cannot be held responsible for any omission, mistake nor for any loss or damage including without limitation to any loss of profit which may arise from reliance on any information supplied by Everest Fortune Group.
Forex

Bullish bounce setup?EUR/CHF is falling towards the support level, which is a pullback support that is slightly above the 61.8% Fibonacci retracement and could bounce from this level to our take profit.
Entry: 0.9175
Why we like it:
There is a pullback support level that is slightly above the 61.8% Fibonacci retracement.
Stop loss: 0.9137
Why we like it:
There is a swing low support level.
Take profit: 0.9235
Why we like it:
There is a pullback resistance level.
Enjoying your TradingView experience? Review us!
Please be advised that the information presented on TradingView is provided to Vantage (‘Vantage Global Limited’, ‘we’) by a third-party provider (‘Everest Fortune Group’). Please be reminded that you are solely responsible for the trading decisions on your account. There is a very high degree of risk involved in trading. Any information and/or content is intended entirely for research, educational and informational purposes only and does not constitute investment or consultation advice or investment strategy. The information is not tailored to the investment needs of any specific person and therefore does not involve a consideration of any of the investment objectives, financial situation or needs of any viewer that may receive it. Kindly also note that past performance is not a reliable indicator of future results. Actual results may differ materially from those anticipated in forward-looking or past performance statements. We assume no liability as to the accuracy or completeness of any of the information and/or content provided herein and the Company cannot be held responsible for any omission, mistake nor for any loss or damage including without limitation to any loss of profit which may arise from reliance on any information supplied by Everest Fortune Group.

Could we see a bounce from here?EUR/JPY is reacting off the support level, which is a pullback support and could rise from this level to our take profit.
Entry: 183.49
Why we like it:
There is a pullback support level.
Stop loss: 182.31
Why we like it:
There is a pullback support level.
Take profit: 185.46
Why we like it:
There is a pullback resistance level.
Enjoying your TradingView experience? Review us!
Please be advised that the information presented on TradingView is provided to Vantage (‘Vantage Global Limited’, ‘we’) by a third-party provider (‘Everest Fortune Group’). Please be reminded that you are solely responsible for the trading decisions on your account. There is a very high degree of risk involved in trading. Any information and/or content is intended entirely for research, educational and informational purposes only and does not constitute investment or consultation advice or investment strategy. The information is not tailored to the investment needs of any specific person and therefore does not involve a consideration of any of the investment objectives, financial situation or needs of any viewer that may receive it. Kindly also note that past performance is not a reliable indicator of future results. Actual results may differ materially from those anticipated in forward-looking or past performance statements. We assume no liability as to the accuracy or completeness of any of the information and/or content provided herein and the Company cannot be held responsible for any omission, mistake nor for any loss or damage including without limitation to any loss of profit which may arise from reliance on any information supplied by Everest Fortune Group.

GBP/USD | Sweep first! (READ THE CAPTION)By examining the hourly chart of GBPUSD, we can see that it's been going lower for a while now, showing an initial reaction to the Bullish breaker before dropping further down, now being traded at 1.36700. I would like to see GBPUSD going further down, going inside last week's NWOG, sweeping the Sellside Liquidity below 1.36600 level and then make an upwards move.
Targets for GBPUSD: 1.36680, 1.36600 and 1.36520.

XAUUSD (Gold) – 1H Support Reaction After Sharp SelloffAfter a strong rejection from the higher resistance area, price made a sharp bearish correction into a major support zone. Current reaction suggests a possible relief bounce, but structure remains corrective unless resistance is reclaimed.
Major Support: 4760 – 4800
Recovery Resistance: 5050 – 5120
Higher Resistance: 5350 – 5400
Market is in a corrective phase. Watch for support hold and breakout above resistance to confirm recovery continuation. Risk management is essential.

USD/JPY | Going for the NWOG high! (READ THE CAPTION)As you can see, USDJPY has been struggling with Jan 26th's NWOG Low. At the moment it has passed it and this weeks NWOG, being traded at 155.20. I expect USDJPY to go through the Consequent Encroachment of last week's NWOG and go for the high of it.
For now, the targets are: 155.27, 155.40, 155.53 and 155.66.

EUR/USD | Where is it headed? (READ THE CAPTION)As you can see in the hourly chart of EURUSD, after hitting 1.2083 last week, it started to gradually drop in price, now being traded at 1.18630. So far today, it's been going up and down the Jan 26th and Feb 2nd NWOGs, now being slightly higher than the Jan 26th NWOG high. I expect EURUSD to test Jan 27th NDOG. If it fails to go above the NDOG, it could drop 1.18300, sweeping the liquidity there and then going back up.
Bearish Targets for EURUSD: 1.18570, 1.18490, 1.1841 and 1.1833.
Bullish targets: 1.1866, 1.1874 and 1.1883.

AUDJPY: Price Action & Swing Analysis
The analysis of the AUDJPY chart clearly shows us that the pair is finally about to tank due to the rising pressure from the sellers.
Disclosure: I am part of Trade Nation's Influencer program and receive a monthly fee for using their TradingView charts in my analysis.
❤️ Please, support our work with like & comment! ❤️

EURGBP: Bullish Continuation & Long Trade
EURGBP
- Classic bullish setup
- Our team expects bullish continuation
SUGGESTED TRADE:
Swing Trade
Long EURGBP
Entry Point - 0.8654
Stop Loss - 0.8650
Take Profit - 0.8661
Our Risk - 1%
Start protection of your profits from lower levels
Disclosure: I am part of Trade Nation's Influencer program and receive a monthly fee for using their TradingView charts in my analysis.
❤️ Please, support our work with like & comment! ❤️

NZDJPY My Opinion! SELL!
My dear friends,
Please, find my technical outlook for NZDJPY below:
The instrument tests an important psychological level 93.349
Bias - Bearish
Technical Indicators: Supper Trend gives a precise Bearish signal, while Pivot Point HL predicts price changes and potential reversals in the market.
Target - 92.827
About Used Indicators:
Super-trend indicator is more useful in trending markets where there are clear uptrends and downtrends in price.
Disclosure: I am part of Trade Nation's Influencer program and receive a monthly fee for using their TradingView charts in my analysis.
———————————
WISH YOU ALL LUCK

Chart Analysis & Trading Idea (Gold / XAUUSD – 15 min)Price is in an overall bearish structure (lower highs & lower lows).
After a strong drop, price made a pullback into the marked upper demand / supply area (actually acting as resistance now).
The highlighted Demand Zone above has already been tested and rejected, showing selling pressure.
Current price action suggests weak bullish momentum and potential trend continuation to the downside.
Trading Idea:
Sell from the upper zone / resistance area if price shows rejection (bearish candle, wick, or structure break).
Targets:
First target: Lower demand zone
Extended target: Below the demand zone if momentum increases
Stop Loss:
Above the upper zone / recent high
Bias:
📉 Bearish – sell on pullback
If you want, I can also:

USD JPY long. Post PMI data Following Friday's PPI data, today's US PMI data adds weight to USD weakness being overdone (for now).
The market appears to like the data with the S&P reacting positively and there is also a case for AUD, NZD or GBP long Vs the JPY.
For better or worse I've chosen the USD because if feel it should directly benefit from the positive data.
The main risk to the trade is BOJ shenanigans causing intervention concerns.

Accumulation, Manipulation, and DistributionMarkets do not move randomly. They rotate through phases that allow large participants to build positions, protect those positions, and eventually exit them. Accumulation, manipulation, and distribution describe this rotation. They are not patterns to trade blindly. They are a framework for understanding why price behaves the way it does at certain locations.
Accumulation occurs when price moves sideways after a decline or during a pause in a larger trend. Volatility contracts, ranges tighten, and progress slows. This is not indecision. It is inventory building. Large positions cannot be entered in one candle without moving price against themselves. Accumulation allows orders to be filled gradually while keeping price contained. Breakouts during this phase often fail because the market is still absorbing liquidity, not ready to expand.
Manipulation is the transition phase. Once enough inventory is built, the market seeks liquidity to fuel expansion. This usually appears as a sharp move beyond the range highs or lows. Stops are triggered, breakout traders enter, and price briefly accelerates. If the move lacks follow-through and quickly reclaims the range, it signals that the breakout was used to fill orders, not to establish direction. The purpose is not deception for its own sake. It is efficient execution.
Distribution follows expansion. After a directional move, price begins to stall. Impulses weaken, volatility compresses, and progress slows again.
This is where positions built earlier are reduced or closed. Distribution often forms near obvious highs or after extended trends, where late participants are still entering with confidence. Liquidity becomes available again, allowing exits without collapsing price immediately.
These phases repeat across timeframes.
A small accumulation on a lower timeframe can exist inside a higher timeframe distribution. This nesting explains why markets can trend strongly while still producing frequent false signals intraday. The phase you are trading matters more than the setup you are using.
The practical edge comes from alignment. Accumulation favors patience and waiting for confirmation. Manipulation requires restraint, not chasing. Distribution demands risk management and reduced exposure. When traders misidentify the phase, they trade against the market’s purpose. When they recognize it, execution becomes calmer, risk becomes clearer, and losses become easier to control.
Understanding accumulation, manipulation, and distribution does not predict exact turning points. It explains intent. When you trade with that intent instead of reacting to candles, you stop fighting the market and start working with it.

USOIL Is Going Up! Buy!
Here is our detailed technical review for USOIL.
Time Frame: 4h
Current Trend: Bullish
Sentiment: Oversold (based on 7-period RSI)
Forecast: Bullish
The market is approaching a significant support area 62.274.
The underlined horizontal cluster clearly indicates a highly probable bullish movement with target 65.500 level.
P.S
We determine oversold/overbought condition with RSI indicator.
When it drops below 30 - the market is considered to be oversold.
When it bounces above 70 - the market is considered to be overbought.
Like and subscribe and comment my ideas if you enjoy them!

AUDCAD Will Fall! Short!
Take a look at our analysis for AUDCAD.
Time Frame: 1h
Current Trend: Bearish
Sentiment: Overbought (based on 7-period RSI)
Forecast: Bearish
The market is on a crucial zone of supply 0.949.
The above-mentioned technicals clearly indicate the dominance of sellers on the market. I recommend shorting the instrument, aiming at 0.944 level.
P.S
Overbought describes a period of time where there has been a significant and consistent upward move in price over a period of time without much pullback.
Like and subscribe and comment my ideas if you enjoy them!

SILVER BULLS ARE STRONG HERE|LONG
Hello, Friends!
SILVER pair is in the downtrend because previous week’s candle is red, while the price is obviously falling on the 4H timeframe. And after the retest of the support line below I believe we will see a move up towards the target above at 10,123.0 because the pair oversold due to its proximity to the lower BB band and a bullish correction is likely.
Disclosure: I am part of Trade Nation's Influencer program and receive a monthly fee for using their TradingView charts in my analysis.
✅LIKE AND COMMENT MY IDEAS✅

GBPUSDGBP is less attractive for long setups, as major liquidity pools on the monthly timeframe have already been taken. We need to see whether selling pressure will persist. For now, the plan is continuation of the bullish 1W OF and 1D OF via a pullback into the discount range.

Buy the Rumor and Sell The NewsMarkets move before information becomes official because positioning always precedes confirmation. By the time news is released, expectations are already priced in. “Buy the rumor” describes this positioning phase, where capital reallocates based on anticipation rather than facts.
Traders who act only on confirmation arrive when risk is highest and asymmetry is lowest.
Rumors form when uncertainty exists and narrative fills the gap. Expectations about events, data, upgrades, or macro decisions begin circulating long before outcomes are known. During this phase, liquidity is thin and positioning builds gradually. Price advances not because certainty exists, but because participants want exposure before clarity removes opportunity.
As the rumor spreads, price often trends cleanly. Pullbacks are shallow, momentum holds, and dips are bought quickly. This is not because the outcome is guaranteed, but because risk is perceived as acceptable relative to potential upside.
The danger appears near confirmation. When the news becomes official, uncertainty collapses. Everyone knows the outcome, and participation peaks. Liquidity increases sharply as late buyers enter and early participants begin exiting. This is why markets frequently stall, reverse, or distribute immediately after positive news. The trade was never about the event itself. It was about positioning ahead of it.
Selling after confirmation is not manipulation. It is inventory management. Capital that entered early needs liquidity to exit. News provides that liquidity. When expectations are fully priced, continuation requires new incentive, not old information.
The practical takeaway is not to trade headlines. It is to observe behavior before them. Watch how price reacts during anticipation. Strong trends with controlled pullbacks suggest accumulation. Choppy price with sharp spikes suggests distribution forming. When confirmation arrives, reassess rather than assume continuation.
“Buy the rumor” works because markets move on expectations and pause on certainty. Traders improve when they stop reacting to news and start reading how the market positions itself in advance. The edge lies in understanding when probability is expanding and when it has already been spent.

EURUSD last move before we dumpRisky trade with a good R/R
I believe we have one more move before we crash down on euro and get bullish on dollar pairs
fasten your seatbelts!! FX:EURUSD

TheGrove | USDJPY Buy | Idea Trading AnalysisUSDJPY is moving in an ascending channel.. Price is trading inside a bullish ascending channel after a strong break of structure.
Previous resistance has flipped into demand, confirming bullish continuation.
We expect a decline in the channel after testing the current level which suggests that the price will continue to rise..
Hello Traders, here is the full analysis.
I think we can soon see more fall from this range! GOOD LUCK! Great BUY opportunity USDJPY
I still did my best and this is the most likely count for me at the moment.
-------------------
Traders, if you liked this idea or if you have your own opinion about it, write in the comments. I will be glad 🤝

#052: Long Investment Opportunity on USD/JPY
The USD/JPY exchange rate is experiencing a particularly interesting market phase, where underlying bearish pressure coexists with technical signals of a possible short-term reaction. After a sharp decline, the price showed signs of slowing, suggesting the entry into a consolidation phase, typical of markets absorbing directional excess.
From a structural perspective, the main trend remains down, consistent with a sequence of lower highs and lower lows on higher time frames. However, this very trend has favored a progressive accumulation of speculative positions in the same direction, creating the conditions for a potential technical rebound. In such environments, the market often tends to move against the grain, hitting areas of liquidity before deciding on the next direction.
Price action analysis highlights how the latest phases of decline have been accompanied by increased volatility and impulsive movements, elements that often herald a phase of rebalancing. The appearance of candlesticks with pronounced wicks and less directional closes suggests that selling pressure is gradually diminishing, leaving room for corrective reactions.
From a volume perspective, the market is also showing signs of absorption. After the initial push, volumes tend to stabilize, indicating that the most aggressive traders have already taken positions. In these environments, subsequent movements are often driven by technical re-entries and position coverings, rather than new directional initiatives.
On the macroeconomic front, the monetary policy differential continues to support the dollar in the medium to long term, while the yen remains structurally weak. However, in the short term, this imbalance does not prevent the market from experiencing temporary rebounds, especially when positioning becomes excessively unbalanced. It is precisely in these phases that the exchange rate tends to move more technically than fundamentally.
The intermarket picture is currently not showing signs of strong risk aversion that would favor a decisive flow towards the yen. This reduces the likelihood of immediate downward accelerations and strengthens the hypothesis of a price breathing space. Bond and currency markets appear to be moving in a more orderly fashion, without sudden shocks.
In summary, USD/JPY is in an unstable equilibrium: the main trend remains bearish, but the market is showing signs of a corrective phase. In these contexts, patience and a good understanding of the structure become crucial, as the most interesting moves often emerge precisely when consensus appears excessively biased in one direction.
As always, the price will provide clarity. The market's ability to sustain any rebounds or, conversely, decisively resume its main direction will offer valuable insights into institutional investors' intentions in the coming sessions.

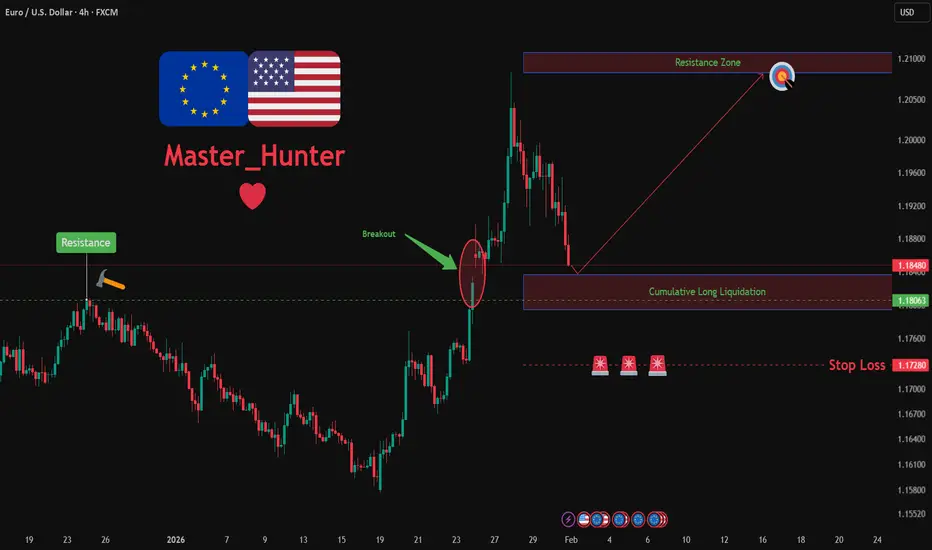
EURUSD: Bullish Push to 1.208?FX:EURUSD is eyeing a bullish continuation on the 4-hour chart , with price rebounding from support after recent consolidation, converging with a potential entry zone that could fuel upside momentum if buyers push through short-term resistance. This setup suggests a rally opportunity amid the ongoing uptrend, targeting higher levels with approximately 1:2.5 risk-reward .🔥
Entry between 1.1800–1.18350 for a long position. Target at 1.2080 . Set a stop loss at a daily close below 1.1828 , yielding a risk-reward ratio of approximately 1:2.5 . Monitor for confirmation via a bullish candle close above entry with rising volume, leveraging the pair's momentum near support.🌟
Fundamentally , EURUSD is trading around 1.182 in early February 2026, with key events this week potentially driving volatility. For the Euro, Thursday February 5 at 1:15 PM UTC brings the ECB Interest Rate Decision (previous 1.75%), where a hold or dovish signals could weaken EUR amid economic concerns. Also on February 5, the ECB Press Conference at 1:45 PM UTC for policy insights that may cause sharp moves. For the US Dollar, Wednesday February 4 at 2:15 PM UTC features ADP Non-Farm Employment Change (Jan, forecast 41K), potentially pressuring USD if softer. Thursday February 5 at 1:30 PM UTC brings Unemployment Claims (week of Jan 31, forecast 209K), with higher figures weakening USD. Friday February 6 at 1:30 PM UTC includes Non-Farm Payrolls (Jan, forecast 50K) and Unemployment Rate (Jan, forecast 4.4%), the week's highlight—weak data could favor EUR upside. 💡
📝 Trade Setup
🎯 Entry (Long):
1.1800 – 1.1835
(Entry from current price is valid with proper risk & position sizing.)
🎯 Target:
• 1.2080
❌ Stop Loss:
• Daily close below 1.1828
⚖️ Risk-to-Reward:
• ~ 1:2.5
💡 Your view?
Does EURUSD continue higher toward 1.2080, or will ECB/NFP volatility force another consolidation before the next leg up? 👇
EURUSD closed January below the 1M MA200! Bear Cycle confirmed?The EURUSD pair closed last month's (January's) 1M candle below its 1M MA200 (orange trend-line) even though it broke above it for the first time in 8 years (since February 2018)! As mentioned on our last week's analysis, that was would be a strong bearish signal long-term, as the pair hasn't closed a 1M candle above the 1M MA200 since November 2014 and every test or approach near it was a market Top, like January 2021 and February 2018.
So as long as the market keeps closing monthly candles below its 1M MA200, we will stay bearish, looking towards a 2-year Bear Cycle, similar to 2021 - 2022 and 2018 - 2019. As mentioned last week, we have a minimum Target at 1.0200 (near the Jan 2025 Low Support) for this Bear Cycle.
In addition, look the huge 1M RSI Lower Highs Bearish Divergence (against the price's Higher Highs) following the June 2025 rejection on the 8-year Resistance. An extra signal of strength reversal.
---
** Please LIKE 👍, FOLLOW ✅, SHARE 🙌 and COMMENT ✍ if you enjoy this idea! Also share your ideas and charts in the comments section below! This is best way to keep it relevant, support us, keep the content here free and allow the idea to reach as many people as possible. **
---
💸💸💸💸💸💸
👇 👇 👇 👇 👇 👇
