GOLD at Key Decision Zone — Will Price Reject or Expand Higher?Description
Gold has returned to a critical imbalance area following a strong bearish impulse, placing price at an important reaction zone. The current structure shows price consolidating within a supply region where previous selling pressure entered the market.
Traders often monitor these zones to observe whether price shows rejection and continuation toward lower liquidity, or acceptance that may support short-term upside expansion. The highlighted levels represent areas where market participants typically wait for confirmation and structure development rather than predicting direction.
This chart focuses on market structure, liquidity behavior, and reaction zones commonly observed in volatile sessions. Watching how price behaves within this region can offer insight into potential short-term momentum shifts and overall market positioning.
This analysis is shared for educational and chart-study purposes to help traders better understand price action and liquidity movement.
Posted on TradingView for market structure observation and learning.
Forex

EURCAD Is Bearish! Short!
Here is our detailed technical review for EURCAD.
Time Frame: 4h
Current Trend: Bearish
Sentiment: Overbought (based on 7-period RSI)
Forecast: Bearish
The market is trading around a solid horizontal structure 1.613.
The above observations make me that the market will inevitably achieve 1.608 level.
P.S
Overbought describes a period of time where there has been a significant and consistent upward move in price over a period of time without much pullback.
Like and subscribe and comment my ideas if you enjoy them!

EURJPY Is Very Bearish! Sell!
Take a look at our analysis for EURJPY.
Time Frame: 1h
Current Trend: Bearish
Sentiment: Overbought (based on 7-period RSI)
Forecast: Bearish
The market is testing a major horizontal structure 182.081.
Taking into consideration the structure & trend analysis, I believe that the market will reach 180.865 level soon.
P.S
Please, note that an oversold/overbought condition can last for a long time, and therefore being oversold/overbought doesn't mean a price rally will come soon, or at all.
Like and subscribe and comment my ideas if you enjoy them!

DXY Analysis (February 13, 2026): Technicals & Macro-Fundamental1. Technical Analysis: Levels and Structure
The DXY index is under pressure, testing critical support zones following the decline in 2025. We are approaching key levels that will trigger either a technical bounce or an accelerated drop.
Current Price: ~97.05 (Consolidation zone).
Trend: Descending (Medium-term Bearish).
Key Levels (Support & Resistance):
Resistance 1 (R1): 97.75 — Mirror level (former support). A break above is necessary for bulls to catch their breath.
Resistance 2 (R2): 98.70 — January 2026 highs.
Pivot (Trend Reversal): 100.20 — Only a close above this invalidates the global "bearish" scenario.
Support 1 (S1): 96.65–96.80 — Local "bottom". If this fails to hold, price drops lower.
Support 2 (S2): 96.00 — Psychological barrier.
Support 3 (S3): 94.50 — Next major target upon a breakdown of 96.00.
2. Fundamental Analysis: Macro Risks
A. Fed Rate & Inflation
The market expects rate cuts to ~3.25–3.50% by year-end. Monetary easing reduces US bond yields, making the dollar less attractive for carry trades compared to previous years.
B. US National Debt
Figures: US National Debt reached $38.56 trillion in February 2026 (up $2.35T YoY).
Impact on DXY: The massive debt load weighs on the dollar long-term. Investors fear "fiscal dominance," where the Fed is forced to print money or keep rates low to service debt. This is a classic currency devaluation scenario.
Forecast: The CBO (Congressional Budget Office) predicts debt will exceed 101% of GDP in 2026 and continue rising to record highs by 2030. This creates structural selling pressure for the USD.
C. De-dollarization Trend
CB Reserves: The dollar's share of global reserves continues to decline. From ~71% in 1999, it has fallen to ~56-57% by 2026.
Diversification: Central Banks (especially in Asia and BRICS) are actively buying Gold and other currencies, reducing reliance on US Treasuries. This is a long-term trend slowly but surely eroding DXY strength.
Nuance: Despite the drop in reserves, the dollar still dominates global payments (about 50% of all SWIFT transactions). The "death of the dollar" is exaggerated in the short term but evident in the long term.
3. Trading Conclusion (Action Plan)
For the Trader (Short-term):
Bias: Bearish, but cautious. We are sitting at support.
Scenario: Wait for a reaction at 96.65. If we break below — short to 96.00 and 94.50. If we bounce — long with a short target up to 97.75.
Risk: A sudden spike in bond yields (US10Y) could give the dollar a temporary boost.
For the Investor (Mid/Long-term):
The combination of rising national debt ($38.5T+) and declining reserve share suggests that any DXY rally should be viewed as an opportunity to exit into hard assets (BTC, Gold, Real Estate). Globally, the dollar is losing purchasing power.

EUR/GBP BULLS WILL DOMINATE THE MARKET|LONG
EUR/GBP SIGNAL
Trade Direction: long
Entry Level: 0.870
Target Level: 0.871
Stop Loss: 0.870
RISK PROFILE
Risk level: medium
Suggested risk: 1%
Timeframe: 1h
Disclosure: I am part of Trade Nation's Influencer program and receive a monthly fee for using their TradingView charts in my analysis.
✅LIKE AND COMMENT MY IDEAS✅

EUR/USD | Recovery or further drop? (READ THE CAPTION)Well hello folks, Amirali here.
As you can see in the 15m chart of EURUSD, last night it had a sudden and massive drop in price, with no official reason. Then afterwards, it recovered a little bit but after today's NDOG, it continued to further drop and it is now being traded at 1.1849. I expect EURUSD to drop further into the Jan 26th NWOG's C.E. (Consequent Encroachment), and then wait to see how it moves after hitting there.
If it bounces back up, the targets will be: 1.1860, 1.1868, 1.1876, 1.1884, 1.1892 and 1.1900.
But if it fails to bounce back: 1.1840, 1.1832, 1.1824, 1.1816 and 1.1808.


EURUSD FREE SIGNAL|LONG|
✅EURUSD clean bullish displacement from 6H discount zone after FVG mitigation confirms bullish BOS. Price respecting internal range liquidity, forming higher low. Expect continuation toward external buy-side liquidity at premium target above.
—————————
Entry: 1.1855
Stop Loss: 1.1765
Take Profit: 1.1983
Time Frame: 6H
—————————
LONG🚀
✅Like and subscribe to never miss a new idea!✅

Could we see a reversal from here?CAD/JPY has bounced off the pivot and could potentially rise to the 38.2% Fibonacci retracement.
Pivot: 111.82
1st Support: 110.88
1st Resistance: 113.13
Disclaimer:
The opinions given above constitute general market commentary and do not constitute the opinion or advice of IC Markets or any form of personal or investment advice.
Any opinions, news, research, analyses, prices, other information, or links to third-party sites contained on this website are provided on an "as-is" basis, are intended to be informative only, and are not advice, a recommendation, research, a record of our trading prices, an offer of, or solicitation for, a transaction in any financial instrument and thus should not be treated as such. The information provided does not involve any specific investment objectives, financial situation, or needs of any specific person who may receive it. Please be aware that past performance is not a reliable indicator of future performance and/or results. Past performance or forward-looking scenarios based upon the reasonable beliefs of the third-party provider are not a guarantee of future performance. Actual results may differ materially from those anticipated in forward-looking or past performance statements. IC Markets makes no representation or warranty and assumes no liability as to the accuracy or completeness of the information provided, nor any loss arising from any investment based on a recommendation, forecast, or any information supplied by any third party.

Bearish drop off?AUD/JPY is rising towards the pivot and could reverse to the 1st support.
Pivot: 108.65
1st Support: 106.89
1st Resistance: 109.92
Disclaimer:
The opinions given above constitute general market commentary and do not constitute the opinion or advice of IC Markets or any form of personal or investment advice.
Any opinions, news, research, analyses, prices, other information, or links to third-party sites contained on this website are provided on an "as-is" basis, are intended to be informative only, and are not advice, a recommendation, research, a record of our trading prices, an offer of, or solicitation for, a transaction in any financial instrument and thus should not be treated as such. The information provided does not involve any specific investment objectives, financial situation, or needs of any specific person who may receive it. Please be aware that past performance is not a reliable indicator of future performance and/or results. Past performance or forward-looking scenarios based upon the reasonable beliefs of the third-party provider are not a guarantee of future performance. Actual results may differ materially from those anticipated in forward-looking or past performance statements. IC Markets makes no representation or warranty and assumes no liability as to the accuracy or completeness of the information provided, nor any loss arising from any investment based on a recommendation, forecast, or any information supplied by any third party.

Bullish continuation setup?AUD/NZD is falling towards the pivot and could bounce to the 1st resistance, which is a swing high resistance.
Pivot: 1.16828
1st Support: 1.16203
1st Resistance: 1.17994
Disclaimer:
The opinions given above constitute general market commentary and do not constitute the opinion or advice of IC Markets or any form of personal or investment advice.
Any opinions, news, research, analyses, prices, other information, or links to third-party sites contained on this website are provided on an "as-is" basis, are intended to be informative only, and are not advice, a recommendation, research, a record of our trading prices, an offer of, or solicitation for, a transaction in any financial instrument and thus should not be treated as such. The information provided does not involve any specific investment objectives, financial situation, or needs of any specific person who may receive it. Please be aware that past performance is not a reliable indicator of future performance and/or results. Past performance or forward-looking scenarios based upon the reasonable beliefs of the third-party provider are not a guarantee of future performance. Actual results may differ materially from those anticipated in forward-looking or past performance statements. IC Markets makes no representation or warranty and assumes no liability as to the accuracy or completeness of the information provided, nor any loss arising from any investment based on a recommendation, forecast, or any information supplied by any third party.

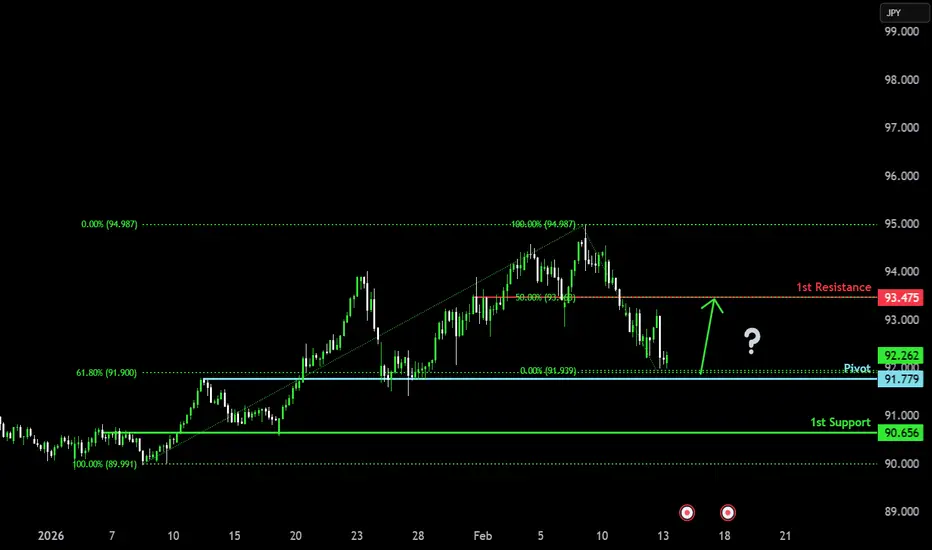
Bullish reversal off key support?NZD/JPY is falling towards the pivot, which has been identified as an overlap support that aligns with the 61.8% Fibonacci retracement and could bounce to the 1st resistance.
Pivot: 91.77
1st Support: 90.65
1st Resistance: 93.47
Disclaimer:
The opinions given above constitute general market commentary and do not constitute the opinion or advice of IC Markets or any form of personal or investment advice.
Any opinions, news, research, analyses, prices, other information, or links to third-party sites contained on this website are provided on an "as-is" basis, are intended to be informative only, and are not advice, a recommendation, research, a record of our trading prices, an offer of, or solicitation for, a transaction in any financial instrument and thus should not be treated as such. The information provided does not involve any specific investment objectives, financial situation, or needs of any specific person who may receive it. Please be aware that past performance is not a reliable indicator of future performance and/or results. Past performance or forward-looking scenarios based upon the reasonable beliefs of the third-party provider are not a guarantee of future performance. Actual results may differ materially from those anticipated in forward-looking or past performance statements. IC Markets makes no representation or warranty and assumes no liability as to the accuracy or completeness of the information provided, nor any loss arising from any investment based on a recommendation, forecast, or any information supplied by any third party.
Bullish bounce off?USD/ZAR has bounced off the pivot, which is a pullback support that aligns with the 38.2% Fibonacci retracement and could rise to the 1st resistance, which has been identified as an overlap resistance that aligns with the 38.2% Fibonacci retracement.
Pivot: 15.91419
1st Support: 15.83200
1st Resistance: 16.04854
Disclaimer:
The opinions given above constitute general market commentary and do not constitute the opinion or advice of IC Markets or any form of personal or investment advice.
Any opinions, news, research, analyses, prices, other information, or links to third-party sites contained on this website are provided on an "as-is" basis, are intended to be informative only, and are not advice, a recommendation, research, a record of our trading prices, an offer of, or solicitation for, a transaction in any financial instrument and thus should not be treated as such. The information provided does not involve any specific investment objectives, financial situation, or needs of any specific person who may receive it. Please be aware that past performance is not a reliable indicator of future performance and/or results. Past performance or forward-looking scenarios based upon the reasonable beliefs of the third-party provider are not a guarantee of future performance. Actual results may differ materially from those anticipated in forward-looking or past performance statements. IC Markets makes no representation or warranty and assumes no liability as to the accuracy or completeness of the information provided, nor any loss arising from any investment based on a recommendation, forecast, or any information supplied by any third party.

AUD/CAD Technical Outlook: Bearish Target at 0.9500The OANDA:AUDCAD pair is currently facing significant overhead supply at the 0.9645 level. A failure to consolidate above this multi-month resistance suggests a liquidity grab (fakeout) followed by a structural shift. We anticipate a corrective move targeting the 0.9500 psychological handle, representing a price decline of approximately 1.5%.
Technical Analysis
Resistance Confluence: The 0.9645 zone acts as a historical pivot point. On the daily chart, price action shows signs of exhaustion, characterized by long upper wicks (shooting star candles), indicating aggressive selling pressure.
Mean Reversion: Price is currently overextended from its 50-day and 200-day Exponential Moving Averages (EMAs). A move toward 0.9500 aligns with a healthy mean reversion toward the 200-EMA, which often acts as a magnet during trend corrections.
Oscillator Divergence: On the H4 and Daily timeframes, the RSI (Relative Strength Index) is displaying a "Bearish Divergence"—making lower highs while price makes higher highs. This is a classic signal of fading momentum.
Fundamental Drivers (The "Solar-Mind" Context)
Commodity Divergence: While both are "commodity currencies," the CAD is currently bolstered by stable oil prices and a hawkish stance from the Bank of Canada (BoC). Conversely, the AUD is sensitive to shifts in Chinese industrial demand. Any cooling in global manufacturing data favors the CAD over the AUD.
Yield Differentials: If the RBA (Reserve Bank of Australia) signals a pause while the BoC remains data-dependent on inflation, the interest rate differential will likely weigh on AUD/CAD, driving the pair toward the 0.9500 support floor.
Trade Parameters
Entry Zone: 0.9640 – 0.9645 (Near current resistance)
Primary Target: 0.9500 (Major psychological support)
Stop Loss: 0.9710 (Above the recent swing high to invalidate the bearish thesis)
Risk/Reward Ratio: Approximately 1:2.2

USDCAD can crash if it closes below its 1M MA50.The USDCAD pair hit last month its 1M MA50 (blue trend-line) for the first time since the September 2022 bullish break-out. That trend-line has technically been the pivot that separated the Bull from the Bear Cycles in the past years.
The pair has been on a macro consolidation within a wide range for almost 11 years (since May 2015). Every touch on its Resistance Zone has been a massive long-term sell opportunity and equally a buy opportunity on its Support Zone. Last time the market hit the Resistance Zone was exactly 1 year ago (February 2025) and we gave a huge Sell Signal.
So if the price closes a 1M candle below the 1M MA50, we will take it as a bearish continuation signal, targeting the 0.236 Fibonacci level at 1.26000. This will still be slightly above the 1M MA200 (orange trend-line), which has been untouched since June 2015 and is the next macro Support level of interest.
Note that every time the 1W RSI broke below its 30.00 oversold barrier, it coincided with the price hitting its long-term Support Zone, thus being a massive buy opportunity.
---
** Please LIKE 👍, FOLLOW ✅, SHARE 🙌 and COMMENT ✍ if you enjoy this idea! Also share your ideas and charts in the comments section below! This is best way to keep it relevant, support us, keep the content here free and allow the idea to reach as many people as possible. **
---
💸💸💸💸💸💸
👇 👇 👇 👇 👇 👇

Bullish bounce for the Swissie?The price has bounced off the support level, which is a pullback support, and could rise from this level to our take profit.
Entry: 0.7680
Why we like it:
There is a pullback support level.
Stop loss: 0.7599
Why we like it:
There is a swing low support level.
Take profit: 0.7795
Why we like it:
There is a pullback resistance level.
Enjoying your TradingView experience? Review us!
Please be advised that the information presented on TradingView is provided to Vantage (‘Vantage Global Limited’, ‘we’) by a third-party provider (‘Everest Fortune Group’). Please be reminded that you are solely responsible for the trading decisions on your account. There is a very high degree of risk involved in trading. Any information and/or content is intended entirely for research, educational and informational purposes only and does not constitute investment or consultation advice or investment strategy. The information is not tailored to the investment needs of any specific person and therefore does not involve a consideration of any of the investment objectives, financial situation or needs of any viewer that may receive it. Kindly also note that past performance is not a reliable indicator of future results. Actual results may differ materially from those anticipated in forward-looking or past performance statements. We assume no liability as to the accuracy or completeness of any of the information and/or content provided herein and the Company cannot be held responsible for any omission, mistake nor for any loss or damage including without limitation to any loss of profit which may arise from reliance on any information supplied by Everest Fortune Group.

Bearish reversal off overlap resistance?USD/CAD is rising towards the resistance level, which is an overlap resistance and could reverse from this level to our take profit.
Entry: 1.3660
Why we like it:
There is an overlap resistance level.
Stop loss: 1.3714
Why we like it:
There is a swing high resistance level.
Take profit: 1.3592
Why we like it:
There is a pullback support level.
Enjoying your TradingView experience? Review us!
Please be advised that the information presented on TradingView is provided to Vantage (‘Vantage Global Limited’, ‘we’) by a third-party provider (‘Everest Fortune Group’). Please be reminded that you are solely responsible for the trading decisions on your account. There is a very high degree of risk involved in trading. Any information and/or content is intended entirely for research, educational and informational purposes only and does not constitute investment or consultation advice or investment strategy. The information is not tailored to the investment needs of any specific person and therefore does not involve a consideration of any of the investment objectives, financial situation or needs of any viewer that may receive it. Kindly also note that past performance is not a reliable indicator of future results. Actual results may differ materially from those anticipated in forward-looking or past performance statements. We assume no liability as to the accuracy or completeness of any of the information and/or content provided herein and the Company cannot be held responsible for any omission, mistake nor for any loss or damage including without limitation to any loss of profit which may arise from reliance on any information supplied by Everest Fortune Group.

GBP-JPY Bearish Breakout! Buy!
Hello,Traders!
GBPJPY strong displacement broke structure below horizontal supply, confirming bearish BOS. Liquidity sweep above range completed, now trading in discount with momentum. Expect continuation toward resting sell-side liquidity below.Time Frame 5H.
Sell!
Comment and subscribe to help us grow!
Check out other forecasts below too!
Disclosure: I am part of Trade Nation's Influencer program and receive a monthly fee for using their TradingView charts in my analysis.

USD/JPY ANALYSIS - 12.02.2026━━━━━━━━━━━━━━━━━━━━━━━━━━━━━━━━━━━━━━━━━━━━━━━━━
📊 USD/JPY ANALYSIS - 12.02.2026
━━━━━━━━━━━━━━━━━━━━━━━━━━━━━━━━━━━━━━━━━━━━━━━━━
📅 WEEKLY TIMEFRAME
──────────────────────────────────────────────────
There is no surprise or tought about UJ, long term it is bullish and fundamentally we are going to keep it bullish until policies will change. Altough the fact that long term is bullish, on the most imediate price action we can note some things such as: price made a huge liquidation of a swing high, entered supply zone and imediatelly bears took the price down, validating also a bearish orderflow. Currentlly as we are speaking, we saw after the selloff a imediate bullish reaction because of the demand zone that seems to hold price steady.
Right now, we are in a battle of supply vs demand on the weekly chart on USDJPY with the most current trend beeing bearish pressure.
📸 Chart:
📊 DAILY TIMEFRAME
──────────────────────────────────────────────────
If we move on to the daily chart, we can see better and in detail how price reacted to the main zones, especially that we can see daily demand and supply zones inside our main weekly zones.
Agreeable, we made a weekly liquidation but on daily we can see also some major sellside liquidations and right now price is testing again a powerfull demand zone on daily (wich is inside the weekly demand zone). Why powerfull? because we have a liquidation inside it and imediate reaction.
In my point of view, last selloff was because of the bearish ordeflow that is keept intact but if we do not count the weekly liquidation, on daily nothing much happend from the bulls yet. No progression, no manipulation. Bulls just kept their power and just let bears push it lower just to gain some strength in the future to make another push to upside.
In case of this demand to break, we are still inside the weekly demand zone and also because of the price beeing bullish on long term, i would still look for a upside recovery in near future.
📸 Chart:
⏱️ 4H TIMEFRAME
──────────────────────────────────────────────────
On the 4h chart we can presume 2 scenarios. One bullish and one bearish.
Bullish scenario
With the price that is squizing inside the 4h demand + daily demand + weekly demand i am looking for a LTF orderflow bullish to get involved with the momentum and buy USDJPY until some more liquidation will happen or, why not, until we can touch the supply zone on 4h chart.
For me it is worth the shoot to engage with some buys inside this area, with my stop loss near the daily demand zone and my take profit arround 3R.
Bearish scenario
We can agree on the fact that price currentlly is way too bearish. We have potential too see just a mini liquidation on a imediate high and after that price to continue the momentum to downside.. Still lots of demands on daily and also inside weekly.
📸 Chart:
⚡ 1H TIMEFRAME
──────────────────────────────────────────────────
To be really transparent, this would be my trade proposed for upcoming period on UJ.
As we can see, 1h is even more clear, we had a liquidation + a change of character. Right now i assume that we have another retracement to test again the demand, also another liquidation and i want to see price reacting to upside and connecting with the 1h zone.
If not..it is what it is.
📸 Chart:
━━━━━━━━━━━━━━━━━━━━━━━━━━━━━━━━━━━━━━━━━━━━━━━━━

Potential bearish drop off?GBP/USD has rejected off the resistance level, which is a pullback resistance and could drop from this level to our take profit.
Entry: 1.3643
Why we like it:
There is a pullback resistance level.
Stop loss: 1.3704
Why we like it:
There is a pullback resistance.
Take profit: 1.3551
Why we like it:
There is a pullback support level.
Enjoying your TradingView experience? Review us!
Please be advised that the information presented on TradingView is provided to Vantage (‘Vantage Global Limited’, ‘we’) by a third-party provider (‘Everest Fortune Group’). Please be reminded that you are solely responsible for the trading decisions on your account. There is a very high degree of risk involved in trading. Any information and/or content is intended entirely for research, educational and informational purposes only and does not constitute investment or consultation advice or investment strategy. The information is not tailored to the investment needs of any specific person and therefore does not involve a consideration of any of the investment objectives, financial situation or needs of any viewer that may receive it. Kindly also note that past performance is not a reliable indicator of future results. Actual results may differ materially from those anticipated in forward-looking or past performance statements. We assume no liability as to the accuracy or completeness of any of the information and/or content provided herein and the Company cannot be held responsible for any omission, mistake nor for any loss or damage including without limitation to any loss of profit which may arise from reliance on any information supplied by Everest Fortune Group.

Falling towards key support?EUR/USD is falling towards the support level, which is an overlap support and could bounce from this level to our take profit.
Entry: 1.1805
Why we like it:
There is an overlap support level.
Stop loss: 1.1733
Why we like it:
There is an overlap support level that aligns with the 61.8% Fibonacci projection.
Take profit: 1.1915
Why we like it:
There is a pullback resistance level.
Enjoying your TradingView experience? Review us!
Please be advised that the information presented on TradingView is provided to Vantage (‘Vantage Global Limited’, ‘we’) by a third-party provider (‘Everest Fortune Group’). Please be reminded that you are solely responsible for the trading decisions on your account. There is a very high degree of risk involved in trading. Any information and/or content is intended entirely for research, educational and informational purposes only and does not constitute investment or consultation advice or investment strategy. The information is not tailored to the investment needs of any specific person and therefore does not involve a consideration of any of the investment objectives, financial situation or needs of any viewer that may receive it. Kindly also note that past performance is not a reliable indicator of future results. Actual results may differ materially from those anticipated in forward-looking or past performance statements. We assume no liability as to the accuracy or completeness of any of the information and/or content provided herein and the Company cannot be held responsible for any omission, mistake nor for any loss or damage including without limitation to any loss of profit which may arise from reliance on any information supplied by Everest Fortune Group.

Bullish bounce off?US Dollar Index has bounced off the support level, which is a pullback support that aligns with the 61.8% Fibonacci retracement and could potentially rise from this level to our take profit.
Entry: 96.31
Why we like it:
There is a pullback support that aligns with the 61.8% Fibonacci retracement.
Stop loss: 95.53
Why we like it:
There is a swing low support level.
Take profit: 97.46
Why we like it:
There is an overlap resistance level.
Enjoying your TradingView experience? Review us!
Please be advised that the information presented on TradingView is provided to Vantage (‘Vantage Global Limited’, ‘we’) by a third-party provider (‘Everest Fortune Group’). Please be reminded that you are solely responsible for the trading decisions on your account. There is a very high degree of risk involved in trading. Any information and/or content is intended entirely for research, educational and informational purposes only and does not constitute investment or consultation advice or investment strategy. The information is not tailored to the investment needs of any specific person and therefore does not involve a consideration of any of the investment objectives, financial situation or needs of any viewer that may receive it. Kindly also note that past performance is not a reliable indicator of future results. Actual results may differ materially from those anticipated in forward-looking or past performance statements. We assume no liability as to the accuracy or completeness of any of the information and/or content provided herein and the Company cannot be held responsible for any omission, mistake nor for any loss or damage including without limitation to any loss of profit which may arise from reliance on any information supplied by Everest Fortune Group.

EURJPY BEARISH BREAKOUT|SHORT|
✅EURJPY clean break below the 4H supply with strong displacement confirms bearish BOS. Price swept buy-side liquidity and left a clear FVG imbalance. Expect a minor retracement into premium before continuation toward sell-side liquidity pools.Time Frame 4H.
SHORT🔥
✅Like and subscribe to never miss a new idea!✅
