USD/JPY ANALYSIS - 12.02.2026━━━━━━━━━━━━━━━━━━━━━━━━━━━━━━━━━━━━━━━━━━━━━━━━━
📊 USD/JPY ANALYSIS - 12.02.2026
━━━━━━━━━━━━━━━━━━━━━━━━━━━━━━━━━━━━━━━━━━━━━━━━━
📅 WEEKLY TIMEFRAME
──────────────────────────────────────────────────
There is no surprise or tought about UJ, long term it is bullish and fundamentally we are going to keep it bullish until policies will change. Altough the fact that long term is bullish, on the most imediate price action we can note some things such as: price made a huge liquidation of a swing high, entered supply zone and imediatelly bears took the price down, validating also a bearish orderflow. Currentlly as we are speaking, we saw after the selloff a imediate bullish reaction because of the demand zone that seems to hold price steady.
Right now, we are in a battle of supply vs demand on the weekly chart on USDJPY with the most current trend beeing bearish pressure.
📸 Chart:
📊 DAILY TIMEFRAME
──────────────────────────────────────────────────
If we move on to the daily chart, we can see better and in detail how price reacted to the main zones, especially that we can see daily demand and supply zones inside our main weekly zones.
Agreeable, we made a weekly liquidation but on daily we can see also some major sellside liquidations and right now price is testing again a powerfull demand zone on daily (wich is inside the weekly demand zone). Why powerfull? because we have a liquidation inside it and imediate reaction.
In my point of view, last selloff was because of the bearish ordeflow that is keept intact but if we do not count the weekly liquidation, on daily nothing much happend from the bulls yet. No progression, no manipulation. Bulls just kept their power and just let bears push it lower just to gain some strength in the future to make another push to upside.
In case of this demand to break, we are still inside the weekly demand zone and also because of the price beeing bullish on long term, i would still look for a upside recovery in near future.
📸 Chart:
⏱️ 4H TIMEFRAME
──────────────────────────────────────────────────
On the 4h chart we can presume 2 scenarios. One bullish and one bearish.
Bullish scenario
With the price that is squizing inside the 4h demand + daily demand + weekly demand i am looking for a LTF orderflow bullish to get involved with the momentum and buy USDJPY until some more liquidation will happen or, why not, until we can touch the supply zone on 4h chart.
For me it is worth the shoot to engage with some buys inside this area, with my stop loss near the daily demand zone and my take profit arround 3R.
Bearish scenario
We can agree on the fact that price currentlly is way too bearish. We have potential too see just a mini liquidation on a imediate high and after that price to continue the momentum to downside.. Still lots of demands on daily and also inside weekly.
📸 Chart:
⚡ 1H TIMEFRAME
──────────────────────────────────────────────────
To be really transparent, this would be my trade proposed for upcoming period on UJ.
As we can see, 1h is even more clear, we had a liquidation + a change of character. Right now i assume that we have another retracement to test again the demand, also another liquidation and i want to see price reacting to upside and connecting with the 1h zone.
If not..it is what it is.
📸 Chart:
━━━━━━━━━━━━━━━━━━━━━━━━━━━━━━━━━━━━━━━━━━━━━━━━━
Forex

Potential bearish drop off?GBP/USD has rejected off the resistance level, which is a pullback resistance and could drop from this level to our take profit.
Entry: 1.3643
Why we like it:
There is a pullback resistance level.
Stop loss: 1.3704
Why we like it:
There is a pullback resistance.
Take profit: 1.3551
Why we like it:
There is a pullback support level.
Enjoying your TradingView experience? Review us!
Please be advised that the information presented on TradingView is provided to Vantage (‘Vantage Global Limited’, ‘we’) by a third-party provider (‘Everest Fortune Group’). Please be reminded that you are solely responsible for the trading decisions on your account. There is a very high degree of risk involved in trading. Any information and/or content is intended entirely for research, educational and informational purposes only and does not constitute investment or consultation advice or investment strategy. The information is not tailored to the investment needs of any specific person and therefore does not involve a consideration of any of the investment objectives, financial situation or needs of any viewer that may receive it. Kindly also note that past performance is not a reliable indicator of future results. Actual results may differ materially from those anticipated in forward-looking or past performance statements. We assume no liability as to the accuracy or completeness of any of the information and/or content provided herein and the Company cannot be held responsible for any omission, mistake nor for any loss or damage including without limitation to any loss of profit which may arise from reliance on any information supplied by Everest Fortune Group.

Falling towards key support?EUR/USD is falling towards the support level, which is an overlap support and could bounce from this level to our take profit.
Entry: 1.1805
Why we like it:
There is an overlap support level.
Stop loss: 1.1733
Why we like it:
There is an overlap support level that aligns with the 61.8% Fibonacci projection.
Take profit: 1.1915
Why we like it:
There is a pullback resistance level.
Enjoying your TradingView experience? Review us!
Please be advised that the information presented on TradingView is provided to Vantage (‘Vantage Global Limited’, ‘we’) by a third-party provider (‘Everest Fortune Group’). Please be reminded that you are solely responsible for the trading decisions on your account. There is a very high degree of risk involved in trading. Any information and/or content is intended entirely for research, educational and informational purposes only and does not constitute investment or consultation advice or investment strategy. The information is not tailored to the investment needs of any specific person and therefore does not involve a consideration of any of the investment objectives, financial situation or needs of any viewer that may receive it. Kindly also note that past performance is not a reliable indicator of future results. Actual results may differ materially from those anticipated in forward-looking or past performance statements. We assume no liability as to the accuracy or completeness of any of the information and/or content provided herein and the Company cannot be held responsible for any omission, mistake nor for any loss or damage including without limitation to any loss of profit which may arise from reliance on any information supplied by Everest Fortune Group.

Bullish bounce off?US Dollar Index has bounced off the support level, which is a pullback support that aligns with the 61.8% Fibonacci retracement and could potentially rise from this level to our take profit.
Entry: 96.31
Why we like it:
There is a pullback support that aligns with the 61.8% Fibonacci retracement.
Stop loss: 95.53
Why we like it:
There is a swing low support level.
Take profit: 97.46
Why we like it:
There is an overlap resistance level.
Enjoying your TradingView experience? Review us!
Please be advised that the information presented on TradingView is provided to Vantage (‘Vantage Global Limited’, ‘we’) by a third-party provider (‘Everest Fortune Group’). Please be reminded that you are solely responsible for the trading decisions on your account. There is a very high degree of risk involved in trading. Any information and/or content is intended entirely for research, educational and informational purposes only and does not constitute investment or consultation advice or investment strategy. The information is not tailored to the investment needs of any specific person and therefore does not involve a consideration of any of the investment objectives, financial situation or needs of any viewer that may receive it. Kindly also note that past performance is not a reliable indicator of future results. Actual results may differ materially from those anticipated in forward-looking or past performance statements. We assume no liability as to the accuracy or completeness of any of the information and/or content provided herein and the Company cannot be held responsible for any omission, mistake nor for any loss or damage including without limitation to any loss of profit which may arise from reliance on any information supplied by Everest Fortune Group.

EURJPY BEARISH BREAKOUT|SHORT|
✅EURJPY clean break below the 4H supply with strong displacement confirms bearish BOS. Price swept buy-side liquidity and left a clear FVG imbalance. Expect a minor retracement into premium before continuation toward sell-side liquidity pools.Time Frame 4H.
SHORT🔥
✅Like and subscribe to never miss a new idea!✅

The GBPJPY Trap | Smart Money’s Next Big Move📉 GBPJPY – Potential Completion of Wave (B), Major Correction Ahead
The long-term bullish cycle on GBPJPY appears to be approaching exhaustion, with technical structure and macro dynamics both signaling a potential Wave (2) corrective phase in motion.
🧩 Elliott Wave Structure
The impulsive advance from the 2020 lows likely represents Wave (1) of a broader cycle, topping near the 208.00 region. Current price action suggests a completed Wave (B) within a larger (A)-(B)-(C) corrective structure, implying downside continuation toward the Wave (2) completion zone between 168.00–158.00 .
📊 Market Structure & Smart Money Context
A Break of Structure (BOS) has emerged beneath 205.00, confirming distribution after prolonged accumulation. Price has also swept liquidity above the prior swing high, aligning with classic Smart Money Concepts — premium pricing before a potential markdown phase.
🔍 Fibonacci & Confluence Zones
The 0.618–0.786 retracement of the Wave (1) impulse coincides with the 168.00–158.00 area, a key Fibonacci confluence that aligns with prior weekly demand and unmitigated imbalance zones . This confluence supports a high-probability reaccumulation area once corrective pressure subsides.
💼 Fundamental Backdrop
From a macro perspective, GBP remains constrained by persistent inflation and stagnating growth, while JPY fundamentals are shifting as the BoJ hints at policy normalization. Any tightening in Japanese yields could amplify downside momentum in GBPJPY.
🎯 Projected Levels
Near-term support: 175.00
Key demand zone: 168.00–158.00
Long-term invalidation: Below 158.00
🕰 Outlook
Until the market confirms a higher-timeframe reversal pattern within the identified demand zone, further downside remains probable. Medium-term traders should monitor liquidity sweeps and BOS confirmations on lower timeframes for re-entry setups.
Stay sharp — Wave C could be fast and decisive! ⚡
What’s your take, traders? 🤔
Do you think Wave C is about to drop hard or will bulls surprise us again? 🐻📉🐂
📈Drop your analysis 👇 — let’s see who nails the next big move! 🚀
⚠️ Disclaimer:
This analysis is for educational purposes only and does not constitute financial advice. Always perform your own due diligence before executing any trades.
#GBPJPY #ElliottWave #SmartMoneyConcepts #MarketStructure #ForexAnalysis #TechnicalAnalysis #Fibonacci #FXTrading #MacroAnalysis #TradingView

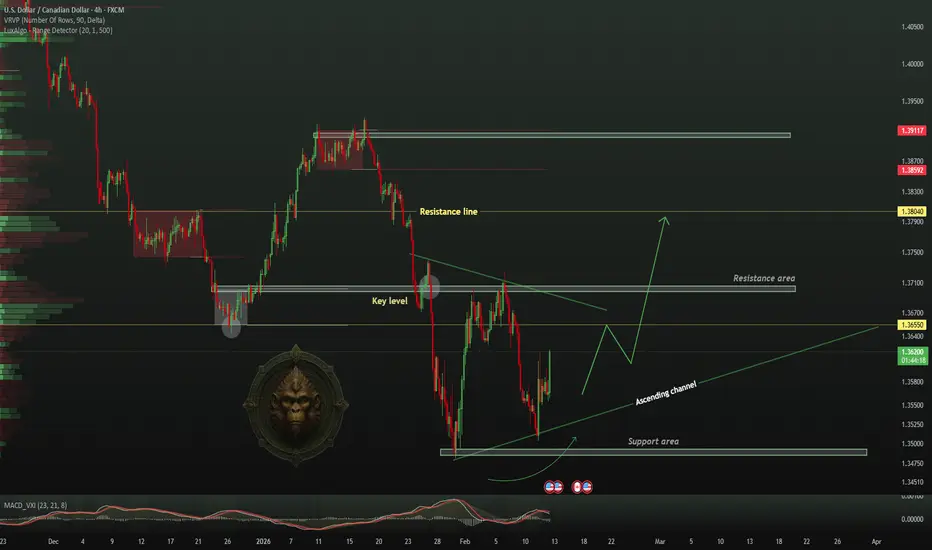
TheGrove | USDCAD Buy | Idea Trading AnalysisUSDCAD is falling towards a support level which is a pullback support and could bounce from this level to our take profit.
We expect a decline in the channel after testing the current level which suggests that the price will continue to rise
Hello Traders, here is the full analysis.
I think we can soon see more fall from this range! GOOD LUCK! Great BUY opportunity USDCAD
I still did my best and this is the most likely count for me at the moment.
-------------------
Traders, if you liked this idea or if you have your own opinion about it, write in the comments. I will be glad 🤝
The value of the Option Open Interest Heatmap in futures tradingThe Option Open Interest Heatmap provided by CME is a free tool often underestimated by traders. Yet it offers a clear reading of the structural forces that influence the behaviour of the underlying, whether in FX, indices, commodities, or rates.
Unlike a traditional view focused on price action and volume, the options heatmap immediately shows where open positions are concentrated at each strike and each expiry. It gives shape and depth to the influence of options on the dynamics of the underlying contract.
For a trader who deals exclusively in the underlying but wants to understand what truly drives accelerations, slowdowns, or reversals, this tool is an important source of information.
Option Open Interest: a risk map rather than a directional signal
Option open interest measures the total number of outstanding contracts, broken down by strike and maturity. It is not a directional indicator in the usual sense but a map of risk, hedging activity, and speculative bets that institutional players are taking at various price levels.
A simple list of numbers would not capture these interactions. The heatmap, however, provides an immediate view of position density. The most heavily loaded areas stand out and reveal where market forces are concentrated.
For a trader, this representation acts as an atlas of zones likely to influence the path of the underlying, often more deeply and mechanically than simple technical support and resistance.
Why options OI directly shapes the behaviour of the underlying
The value for a futures trader does not stem from any intention to trade options, but from the need to understand the behaviours induced by these positions. When a strike accumulates a large volume of puts or calls, it often becomes a natural magnet for the underlying. As expiry approaches, the hedging adjustments that dealers must carry out push prices toward that zone: this is the pinning phenomenon.
Conversely, if price breaks through a particularly dense cluster, the reaction can be much more explosive. Moving past a strike loaded with options abruptly changes dealers’ risk structure, triggering mechanical buying or selling flows on the underlying contract. The trader who does not follow the heatmap can be unsettled by these sharp moves. The one who does immediately understands that these moves are structural adjustments often invisible on a simple price chart.
Since many market movements originate from these clusters, the heatmap also makes it possible to compare risk distribution across expiries, revealing areas of immediate tension in near-term maturities or more strategic stakes in longer maturities.
A practical tool for futures traders: working zones, scenarios, and gamma structure
For a futures trader, the heatmap leads to concrete decisions. It helps identify zones where institutions have strong incentives, and therefore the levels where the market tends to stall, or on the contrary, zones where it is likely to accelerate.
It improves scenario evaluation: gradual stabilisation around a heavily loaded strike, a targeted test of a cluster-defined level, or tensions arising in an area where near-spot options generate negative gamma.
Gamma influence is central here. When near-spot options contain a large share of open interest, dealer positioning partly shapes the market environment. A dealer who is long gamma (buyer of options) tends to stabilise prices and reduce volatility. A dealer who is short gamma, by contrast, amplifies moves in both directions to meet hedging needs.
The heatmap therefore becomes indispensable for identifying zones where these constraints may alter the dynamics of the underlying, and for distinguishing purely technical moves from structural ones.
Final Thoughts: an essential and complementary structural dimension
The Option Open Interest Heatmap is not meant to replace a trader’s classic analytical tools, but it enriches analysis by highlighting forces that are invisible on a simple price chart. It helps anticipate slowdown zones, inflection points, pinning risks, or accelerations triggered by the unwinding of an options cluster. Altogether, these elements allow the trader to approach the market with a more complete understanding of the forces at play.
By integrating this map of options positioning into the analytical process, the trader gains a much clearer view of probable scenarios and significantly strengthens decision-making. Understanding the influence of options on the underlying is not marginal: it is often a decisive factor in reading the market correctly and improving trading quality.
---
When charting futures, the data provided could be delayed. Traders working with the ticker symbols discussed in this idea may prefer to use CME Group real-time data plan on TradingView: tradingview.com/cme/ .
This consideration is particularly important for shorter-term traders, whereas it may be less critical for those focused on longer-term trading strategies.
General Disclaimer:
The trade ideas presented herein are solely for illustrative purposes forming a part of a case study intended to demonstrate key principles in risk management within the context of the specific market scenarios discussed. These ideas are not to be interpreted as investment recommendations or financial advice. They do not endorse or promote any specific trading strategies, financial products, or services. The information provided is based on data believed to be reliable; however, its accuracy or completeness cannot be guaranteed. Trading in financial markets involves risks, including the potential loss of principal. Each individual should conduct their own research and consult with professional financial advisors before making any investment decisions. The author or publisher of this content bears no responsibility for any actions taken based on the information provided or for any resultant financial or other losses.

CHFJPY: Bullish Forecast & Bullish Scenario
The price of CHFJPY will most likely increase soon enough, due to the demand beginning to exceed supply which we can see by looking at the chart of the pair.
Disclosure: I am part of Trade Nation's Influencer program and receive a monthly fee for using their TradingView charts in my analysis.
❤️ Please, support our work with like & comment! ❤️

USD-CAD Will Grow! Buy!
Hello,Traders!
USDCAD holds firm above demand after liquidity sweep. Bullish BOS and strong reaction from discount suggest continuation toward buy-side liquidity at premium highs. Time Frame 2H.
Buy!
Comment and subscribe to help us grow!
Check out other forecasts below too!
Disclosure: I am part of Trade Nation's Influencer program and receive a monthly fee for using their TradingView charts in my analysis.

CADCHF: Long Trade Explained
CADCHF
- Classic bullish setup
- Our team expects bullish continuation
SUGGESTED TRADE:
Swing Trade
Long CADCHF
Entry Point - 0.5649
Stop Loss - 0.5641
Take Profit - 0.5663
Our Risk - 1%
Start protection of your profits from lower levels
Disclosure: I am part of Trade Nation's Influencer program and receive a monthly fee for using their TradingView charts in my analysis.
❤️ Please, support our work with like & comment! ❤️

AUDJPY Massive Long! BUY!
My dear friends,
My technical analysis for AUDJPY is below:
The market is trading on 108.99 pivot level.
Bias - Bullish
Technical Indicators: Both Super Trend & Pivot HL indicate a highly probable Bullish continuation.
Target - 109.62
About Used Indicators:
A pivot point is a technical analysis indicator, or calculations, used to determine the overall trend of the market over different time frames.
Disclosure: I am part of Trade Nation's Influencer program and receive a monthly fee for using their TradingView charts in my analysis.
———————————
WISH YOU ALL LUCK

EURCAD Will Collapse! SELL!
My dear friends,
EURCAD looks like it will make a good move, and here are the details:
The market is trading on 1.6142 pivot level.
Bias - Bearish
Technical Indicators: Supper Trend generates a clear short signal while Pivot Point HL is currently determining the overall Bearish trend of the market.
Goal - 1.6125
Recommended Stop Loss - 1.6152
About Used Indicators:
Pivot points are a great way to identify areas of support and resistance, but they work best when combined with other kinds of technical analysis
Disclosure: I am part of Trade Nation's Influencer program and receive a monthly fee for using their TradingView charts in my analysis.
———————————
WISH YOU ALL LUCK

BITCOIN Will Fall! Short!
Here is our detailed technical review for BITCOIN.
Time Frame: 1h
Current Trend: Bearish
Sentiment: Overbought (based on 7-period RSI)
Forecast: Bearish
The market is approaching a significant resistance area 68,030.86.
Due to the fact that we see a positive bearish reaction from the underlined area, I strongly believe that sellers will manage to push the price all the way down to 65,890.40 level.
P.S
We determine oversold/overbought condition with RSI indicator.
When it drops below 30 - the market is considered to be oversold.
When it bounces above 70 - the market is considered to be overbought.
Like and subscribe and comment my ideas if you enjoy them!

XAUUSD on Rangbound before [ Bullish streak]XAUUSD is still with Rangebound along Rising pattern is still intact .(Non-Farm Payrolls) data delivered exactly as we were waiting.
If Price-action remains intact above the Lower trendline & structural support then we could see another spike
-1st POI 5045-5035
Target : 5145 - 5170
-2nd POI 4980-4970 for optimal buy
⚠️ secondly if H1-H4 Candle (Body) closes below 5030 then wait for implusive drop towards 4990-4970.

EUR/CAD SENDS CLEAR BEARISH SIGNALS|SHORT
Hello, Friends!
EUR-CAD uptrend evident from the last 1W green candle makes short trades more risky, but the current set-up targeting 1.610 area still presents a good opportunity for us to sell the pair because the resistance line is nearby and the BB upper band is close which indicates the overbought state of the EUR/CAD pair.
Disclosure: I am part of Trade Nation's Influencer program and receive a monthly fee for using their TradingView charts in my analysis.
✅LIKE AND COMMENT MY IDEAS✅

Positive Bias Still Hovering Over This PairThe USD/CAD pair traded with a positive bias around 1.3580 during today's Asian session. This strengthening was driven by the dominance of the US dollar following the release of solid employment data, although further gains were limited by stable crude oil prices.
🛠️ USD/CAD Technical Analysis (Intraday)
Technically, the pair is testing a short-term resistance area.
⚡Immediate Support ($1.3520 - $1.3540): This level serves as the first line of defense for buyers. As long as the price remains above 1.3520, the daily bias remains bullish.
⚡Key Resistance ($1.3620): A breakout of this level will open the way to the next psychological target at 1.3700.
⚡RSI Indicator: Located around 58, indicating healthy upward momentum but beginning to approach the overbought zone.

XAUUSD BULISH ANALYSIS .[READ CAPTION]what you about this idea"]
📊 Trade Idea – Support Reaction Setup
Price is retracing into a key demand zone (5,020–5,040) after forming higher highs and higher lows. Market structure remains bullish unless support breaks.
🔹 Bias: Bullish above 5,020
🔹 Entry Idea: Bullish confirmation inside support (rejection / strong close)
🔹 Target: 5,090–5,100 resistance area
🔹 Invalidation: Sustained break below support

NZDJPY: Will Start Growing! Here is Why:
Our strategy, polished by years of trial and error has helped us identify what seems to be a great trading opportunity and we are here to share it with you as the time is ripe for us to buy NZDJPY.
Disclosure: I am part of Trade Nation's Influencer program and receive a monthly fee for using their TradingView charts in my analysis.
❤️ Please, support our work with like & comment! ❤️

NZDUSD: Bearish Continuation & Short Signal
NZDUSD
- Classic bearish formation
- Our team expects fall
SUGGESTED TRADE:
Swing Trade
Sell NZDUSD
Entry Level - 0.6069
Sl - 0.6076
Tp - 0.6056
Our Risk - 1%
Start protection of your profits from lower levels
Disclosure: I am part of Trade Nation's Influencer program and receive a monthly fee for using their TradingView charts in my analysis.
❤️ Please, support our work with like & comment! ❤️

GBPCHF - Bearish Trap Set at the Channel CeilingHello Trading Fam! 👋
This GBP/CHF 4-hour chart indicates a strong bearish (downtrend) setup:
Descending Channel: The pair is contained within a clear downward-sloping channel, marking an "overall bearish" trend.
Daily Resistance: Price is trading below a significant red resistance zone around 1.0600–1.0650.
Targeted Retest: The analysis anticipates a brief rally toward the 1.0550 structure level (yellow box), which aligns with the upper channel trendline.
Trade Bias: Traders are advised to "look for shorts" (sell) at that confluence point, expecting a continuation move toward lower lows.
Don’t forget to like and share your thoughts in the comments! ❤️

EURJPY Technical Analysis! BUY!
My dear subscribers,
EURJPY looks like it will make a good move, and here are the details:
The market is trading on 181.82 pivot level.
Bias - Bullish
Technical Indicators: Both Super Trend & Pivot HL indicate a highly probable Bullish continuation.
Target - 183.38
About Used Indicators:
The average true range (ATR) plays an important role in 'Supertrend' as the indicator uses ATR to calculate its value. The ATR indicator signals the degree of price volatility.
Disclosure: I am part of Trade Nation's Influencer program and receive a monthly fee for using their TradingView charts in my analysis.
———————————
WISH YOU ALL LUCK

Post NFP thoughts:When I saw the the NFP data, before looking a chart, I thought USD long, possibly Vs JPY, I also thought the across the board positive numbers would be good for the overall risk environment.
Indeed, that was the initial reaction. But it was very short lived, USD selling returned very quicky. Maybe it was the revisions, maybe it was JPY liquidity as USD JPY continues to unwind post election, in what appears to be 'buy the rumour' (last week) 'sell the fact' (this week).
Maybe it's the market signalling an underlying desire to sell the USD, as the saying goes, if an instrument doesn't strengthen on good news, it doesn't bode well.
For now, until USD JPY shows signs of a meaningful push up, I'll continue to view the dollar as the preferred short option. But I'll wait and see the reaction to today's US session and, (or) tomorrow's US CPI data.
Don't be down hearted if you did get caught out with a USD long yesterday. For me, it was a logical thought process. NFP reactions are notoriously choppy at the best of times.
*Side note, Friday's European session GBP data is worth keeping an eye on for a potential short term trade in either direction, if there is an opportunity, I would close the trade before the release of the US CPI data .
