EUR/JPY BEARS ARE STRONG HERE|SHORT
Hello, Friends!
EUR-JPY uptrend evident from the last 1W green candle makes short trades more risky, but the current set-up targeting 184.374 area still presents a good opportunity for us to sell the pair because the resistance line is nearby and the BB upper band is close which indicates the overbought state of the EUR/JPY pair.
Disclosure: I am part of Trade Nation's Influencer program and receive a monthly fee for using their TradingView charts in my analysis.
✅LIKE AND COMMENT MY IDEAS✅
Forex

GOLD SHORT FROM RESISTANCE
GOLD SIGNAL
Trade Direction: short
Entry Level: 4,924.40
Target Level: 4,811.58
Stop Loss: 4,998.92
RISK PROFILE
Risk level: medium
Suggested risk: 1%
Timeframe: 1h
Disclosure: I am part of Trade Nation's Influencer program and receive a monthly fee for using their TradingView charts in my analysis.
✅LIKE AND COMMENT MY IDEAS✅

Three Inside Up For AUOANDA:AUDUSD on the close of the 8Hr Candle has formed a Three Inside Up candlestick pattern!
The Three Inside Up is a Bullish Reversal Candlestick Pattern that consists of:
1) Large Bearish Candle
2) Bullish Candle that takes back 50% of the First Candle
3) Large Bullish Candle that Closes with a Gap Up from the High of the First Candle
Long Opportunity is generated on the Open of the proceeding candle with a Stop Loss set Below the Low of the Pattern.

USDCAD losing strength!USDCAD starting to drop in the NY session. Few major news on the way which could make it plunge.

Bearish Pullback Into Resistance, Downside Target in FocusMarket Structure
Price previously made a strong impulsive drop, followed by a rounded bottom / corrective recovery.
That recovery looks corrective, not impulsive (overlapping candles, curved structure), suggesting a bearish continuation setup rather than a trend reversal.
Key Zones
Major Resistance (≈ 5,100 – 5,130)
This zone previously acted as support, then flipped to resistance (classic S/R flip).
Price is projected to retest this zone before rejecting.
Support / Target Zone (≈ 4,750)
Strong demand zone where price previously reacted sharply.
Labeled clearly as the downside target.
Pattern & Bias
The white projection suggests a pullback → lower high → continuation down.
This resembles a bearish retracement into resistance, aligned with:
Prior breakdown level
Failure to reclaim key resistance
Momentum on the right side is weaker than the prior sell-off → bearish divergence in structure.
Trade Idea (Based on the Drawing)
Bias: Bearish below resistance
Entry Area: Near the resistance zone (~5,100)
Invalidation: Clean break and hold above resistance
Target: Support zone around ~4,750
Summary
Gold appears to be in a bearish continuation phase, with price likely retracing into resistance before rolling over. As long as resistance holds, the path of least resistance remains downward toward the marked

GBPUSD: Bearish Drop to 1.334?FX:GBPUSD is eyeing a bearish reversal on the 4-hour chart , with price testing resistance after recent highs in an upward trendline from June 2025, converging with a potential entry zone that could spark downside momentum if sellers defend amid volatility. This setup suggests a pullback opportunity post-rally, targeting lower support levels with more than 1:2 risk-reward .🔥
Entry between 1.3566–1.3586 for a short position. Target at 1.3341 . Set a stop loss at a close above 1.3664 , yielding a risk-reward ratio of more than 1:2 . Monitor for confirmation via a bearish candle close below entry with rising volume, leveraging the pair's dynamics near resistance.🌟
Fundamentally , GBPUSD is trading around 1.357 in early February 2026, with key events this week. For the US Dollar, Nonfarm Payrolls (Jan, forecast 50K) on February 6 at 1:30 PM UTC, the week's highlight—weak data could favor GBP upside. 💡
📝 Trade Setup
🎯 Entry (Short):
1.3566 – 1.3586
(Entry from current price is valid with proper risk & position sizing.)
🎯 Target:
• 1.3341
❌ Stop Loss:
• Close above 1.3664
⚖️ Risk-to-Reward:
• > 1:2
💡 Your view?
Is this the start of a healthy pullback toward 1.3340, or will GBP bulls push through resistance and extend the rally? 👇

XAUUSD | 15M – Technical Analysis (Educational)Market Structure:
Gold is trading within a bearish market structure after a clear downside break. The recent upside move appears corrective rather than impulsive.
Technical Context:
Price previously formed a bearish BOS
Current movement shows a retracement into premium
Buy-side liquidity (BSL) is resting above recent highs
Multiple Fair Value Gaps (15M & H1) remain unmitigated
Higher-timeframe imbalance aligns with bearish continuation
Expectation:
If price trades into the highlighted FVG / liquidity zone, a reaction may occur. From a structural perspective, continuation toward lower liquidity zones remains a valid scenario unless higher-timeframe acceptance is seen.
Note:
This chart reflects a technical perspective only and is shared for educational purposes. Always apply your own confirmation and risk management.

GBPCAD: Bullish Continuation is Highly Probable! Here is Why:
Our strategy, polished by years of trial and error has helped us identify what seems to be a great trading opportunity and we are here to share it with you as the time is ripe for us to buy GBPCAD.
Disclosure: I am part of Trade Nation's Influencer program and receive a monthly fee for using their TradingView charts in my analysis.
❤️ Please, support our work with like & comment! ❤️

AUDUSD: Short Trade with Entry/SL/TP
AUDUSD
- Classic bearish pattern
- Our team expects retracement
SUGGESTED TRADE:
Swing Trade
Sell AUDUSD
Entry - 0.6985
Stop - 0.7002
Take - 0.6958
Our Risk - 1%
Start protection of your profits from lower levels
Disclosure: I am part of Trade Nation's Influencer program and receive a monthly fee for using their TradingView charts in my analysis.
❤️ Please, support our work with like & comment! ❤️

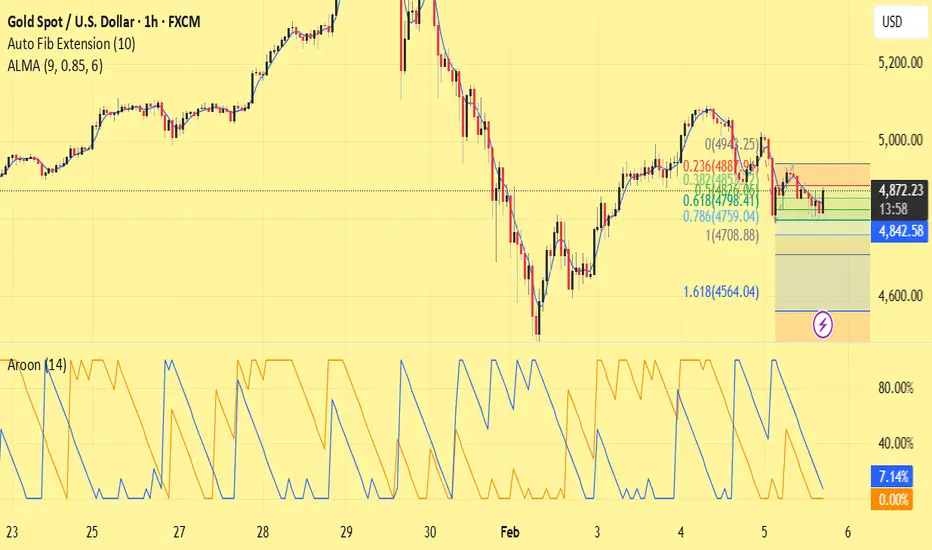
Fibonacci Resistance Caps the Recovery | Consolidation PhaseChart Analysis
Market Structure
After a sharp sell-off, Gold staged a technical rebound but is now trading in a sideways to corrective phase below a key Fibonacci resistance zone. The structure suggests a corrective pullback within a broader bearish swing, rather than the start of a new uptrend.
Technical Confluence
Fibonacci Retracement: The 0.236 – 0.382 zone is acting as resistance and limiting further upside.
ALMA (9): Price is hovering around the moving average, indicating weak momentum and indecision.
Auto Fib Extension: The 1.618 extension remains a potential downside target if selling pressure resumes.
Aroon (14): Weak Aroon Up and relatively stronger Aroon Down point to fading bullish strength.
Price Action
Repeated upper wicks and small-bodied candles near resistance signal supply pressure. Buyers have so far failed to achieve a clean breakout above the resistance area.
Trade Idea
Bias: Neutral to Bearish
Sell Zone: Rejection from the Fibonacci resistance zone
Targets:
First target: Recent swing low
Extended targets: 0.786 retracement / 1.618 extension
Invalidation: A clear and sustained close above the 0.382 Fibonacci level
Conclusion
As long as XAUUSD remains below the Fibonacci resistance and momentum stays weak, the current price action is best viewed as consolidation ahead of a potential downside continuation.
Always manage risk and wait for confirmation.
CHFJPY Will Collapse! SELL!
My dear subscribers,
My technical analysis for CHFJPY is below:
The price is coiling around a solid key level - 201.99
Bias - Bearish CHFJPY
Technical Indicators: Pivot Points High anticipates a potential price reversal.
Super trend shows a clear sell, giving a perfect indicators' convergence.
Goal - 201.09
About Used Indicators:
By the very nature of the supertrend indicator, it offers firm support and resistance levels for traders to enter and exit trades. Additionally, it also provides signals for setting stop losses
Disclosure: I am part of Trade Nation's Influencer program and receive a monthly fee for using their TradingView charts in my analysis.
———————————
WISH YOU ALL LUCK

NZD-USD Free Signal! Sell!
Hello,Traders!
NZDUSD
Price reacts from a well-defined horizontal supply zone after a corrective pullback. Bearish displacement and acceptance below supply suggest smart money distribution, favoring continuation toward lower liquidity.
--------------------
Stop Loss: 0.6011
Take Profit: 0.5968
Entry: 0.5994
Time Frame: 3H
--------------------
Sell!
Comment and subscribe to help us grow!
Check out other forecasts below too!
Disclosure: I am part of Trade Nation's Influencer program and receive a monthly fee for using their TradingView charts in my analysis.

EURJPY: Bullish Push to 186.40?As the previous analysis worked exactly as predicted, FX:EURJPY is eyeing a bullish continuation on the 4-hour chart , with price rebounding from the upward channel's lower boundary after lower high, converging with a potential entry zone at support that could fuel upside momentum if buyers hold amid recent volatility. This setup indicates a rally opportunity post-pullback, targeting higher resistance levels with near 1:4 risk-reward .🔥
Entry between 184.50–184.76 for a long position (entry from current price with proper risk management is recommended)🎯. Target at 186.40 . Set a stop loss at a daily close below 184.35 , yielding a risk-reward ratio of near 1:4 . Monitor for confirmation via a bullish candle close above entry with increasing volume, capitalizing on the pair's upward bias in the channel.🌟
Fundamentally , EURJPY is trading around 185.1 in early February 2026, with limited high-impact events this week, but key Japanese developments could influence JPY weakness. For the Yen, the Snap General Election on February 7 may lead to Monday's market gap, with outcomes impacting Nikkei and yen sentiment. Monday February 9 at 12:00 AM UTC features Eco Watchers Survey: Current (Jan, previous 48.6) and Outlook (Jan, previous 50.5), where weaker consumer sentiment could pressure JPY. For the Euro, no major releases this week, leaving the pair sensitive to JPY catalysts and broader USD flows. 💡
📝 Trade Setup
🎯 Entry (Long):
184.50 – 184.76
(Entry from current price is valid with proper risk & position sizing.)
🎯 Target:
• 186.40
❌ Stop Loss:
• Daily close below 184.35
⚖️ Risk-to-Reward:
• ~ 1:4
💡 Your take?
Does EURJPY extend toward 186.40 after this pullback, or do you expect more consolidation before the next leg higher? 👇

CAD/JPY | BSL sweep (READ THE CAPTION)After last week's massive NWOG and the dramatic fall of the CADJPY, it moved upwards and then faced a little bit of correction after this week's NWOG, it gone up to 114.91 and dropped a little bit, leaving a Liquidity Pool below and the went back up and is being traded at 114.81. I expect CADJPY to sweep the liquidity above the 114.91 and then wait to see if it goes down again or will go for the next liquidity pool above 115.43 to make a move.
Targets: 115.00, 115.10 and 115.20.
If it fails to sweep the liquidity and drops: 114.72, 114.62, 114.52 and 114.42.

USD/CAD | Stuck! (READ THE CAPTION)As you can see in the daily chart of USDCAD, after it hit the Bullish OB, it has been going higher and higher, and started today by going through the Volume Imbalance, but it eventually fell inside the Volume Imbalance zone again. I expect it to retest the Vol Imbalance as well as Feb 6th NDOG soon and I want it to go through it. Currently it's being traded at 1.3684 and It is stuck between the Feb 3rd NDOG and Feb 6th NDOG.
For now, here are the targets for USDCAD: 1.3688, 1.3694, 1.3700 and 1.3707.

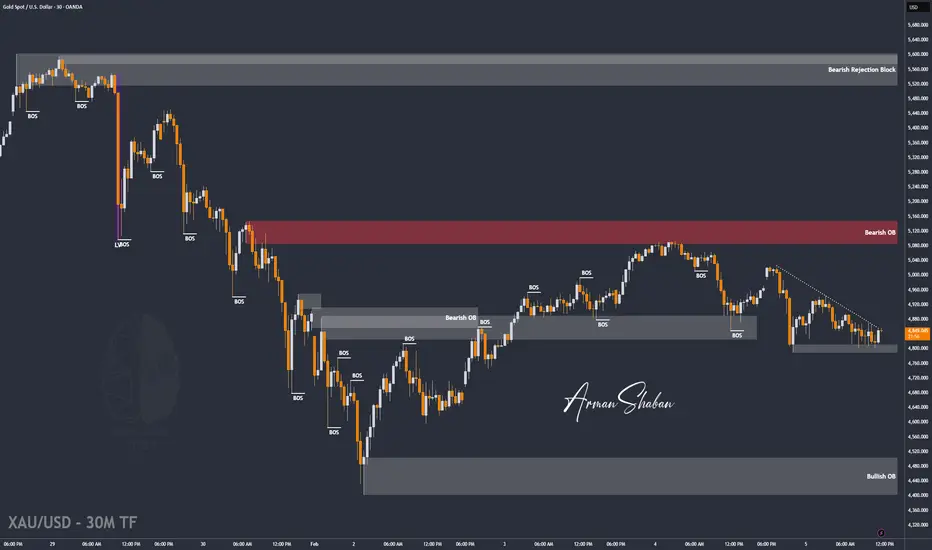
XAU/USD | Gold Short-Term Bounce After Liquidity Grab!By analyzing the #Gold chart on the 30-minute timeframe, we can see that after our previous analysis, price moved exactly as expected and first corrected down to $4,790. After reaching this key level and sweeping the liquidity below it, gold turned bullish again and is now trading around $4,850.
If price can stabilize above $4,839, we can expect further upside in gold. The next potential targets for this move are $4,876 and $4,913.
Please support me with your likes and comments to motivate me to share more analysis with you and share your opinion about the possible trend of this chart with me !
Best Regards , Arman Shaban
Bitsounis / EURAUD Short limitEURAUD has broken the upward trend in 1h.
and I am waiting for an entry in the fib level zone.

USDCHF - The Breakdown You Can’t Afford to IgnoreHello Traders! 👋
What are your thoughts on USDCHF?
This chart shows a bearish technical analysis for the USD/CHF (US Dollar vs. Swiss Franc) currency pair on a daily timeframe.
The overall sentiment is that the pair has broken below long-term support and is now showing signs of further weakness.
Key Takeaways
Bearish Breakdown: The price has fallen significantly below a long-standing consolidation range (the blue support zone around 0.7850).
Role Reversal: The previous "Support" (blue zone) is now acting as "Resistance." The red arrow indicates a "retest" of this level—a common technical pattern where price returns to a broken level before continuing lower.
Descending Trend: The purple lines highlight a series of "Lower Highs," indicating a sustained downward trend over the past several months.
Don’t forget to like and share your thoughts in the comments! ❤️

AUDUSD Will Go Down! Short!
Take a look at our analysis for AUDUSD.
Time Frame: 4h
Current Trend: Bearish
Sentiment: Overbought (based on 7-period RSI)
Forecast: Bearish
The market is testing a major horizontal structure 0.697.
Taking into consideration the structure & trend analysis, I believe that the market will reach 0.689 level soon.
P.S
Please, note that an oversold/overbought condition can last for a long time, and therefore being oversold/overbought doesn't mean a price rally will come soon, or at all.
Like and subscribe and comment my ideas if you enjoy them!

NZDUSD Will Move Lower! Sell!
Please, check our technical outlook for NZDUSD.
Time Frame: 1h
Current Trend: Bearish
Sentiment: Overbought (based on 7-period RSI)
Forecast: Bearish
The market is approaching a key horizontal level 0.598.
Considering the today's price action, probabilities will be high to see a movement to 0.593.
P.S
The term oversold refers to a condition where an asset has traded lower in price and has the potential for a price bounce.
Overbought refers to market scenarios where the instrument is traded considerably higher than its fair value. Overvaluation is caused by market sentiments when there is positive news.
Like and subscribe and comment my ideas if you enjoy them!

NZDCAD: Bullish Forecast & Outlook
The charts are full of distraction, disturbance and are a graveyard of fear and greed which shall not cloud our judgement on the current state of affairs in the NZDCAD pair price action which suggests a high likelihood of a coming move down.
Disclosure: I am part of Trade Nation's Influencer program and receive a monthly fee for using their TradingView charts in my analysis.
❤️ Please, support our work with like & comment! ❤️

CADCHF: Bearish Continuation & Short Signal
CADCHF
- Classic bearish setup
- Our team expects bearish continuation
SUGGESTED TRADE:
Swing Trade
Short CADCHF
Entry Point - 0.5685
Stop Loss - 0.5689
Take Profit - 0.5677
Our Risk - 1%
Start protection of your profits from lower levels
Disclosure: I am part of Trade Nation's Influencer program and receive a monthly fee for using their TradingView charts in my analysis.
❤️ Please, support our work with like & comment! ❤️

GBPCHF Expected Growth! BUY!
My dear followers,
I analysed this chart on GBPCHF and concluded the following:
The market is trading on 1.0565 pivot level.
Bias - Bullish
Technical Indicators: Both Super Trend & Pivot HL indicate a highly probable Bullish continuation.
Target - 1.0602
About Used Indicators:
A super-trend indicator is plotted on either above or below the closing price to signal a buy or sell. The indicator changes color, based on whether or not you should be buying. If the super-trend indicator moves below the closing price, the indicator turns green, and it signals an entry point or points to buy.
Disclosure: I am part of Trade Nation's Influencer program and receive a monthly fee for using their TradingView charts in my analysis.
———————————
WISH YOU ALL LUCK
