AUDCAD is Breaking Triangle — Bullish Breakout Ahead of CPI?Today, I want to share a long trading opportunity on the AUDCAD pair ( FX:AUDCAD ), so stay tuned!
Currently, AUDCAD has successfully broken through its resistance line and is now situated within a heavy resistance zone(0.9585 CAD-0.9247 CAD).
From a classic technical analysis perspective, if we look at the AUDCAD chart on the 4-hour timeframe, we can see a symmetrical triangle pattern, which suggests a continuation of the recent bullish trend of AUDCAD.
From an Elliott Wave perspective, it appears that AUDCAD has completed microwave 4 of the main wave 5, and we can expect the start of microwave 5 of the main wave 5. The breakout above the upper line of the symmetrical triangle could confirm the end of the microwave 4.
Additionally, today’s Canadian CPI data could act as a key catalyst for AUDCAD.
Based on recent macro trends, I expect inflation pressures in Canada to remain soft.
If CPI comes at or below expectations, it should weaken CAD and support a bullish continuation on AUDCAD.
As long as the structure holds, I remain biased to the long side.
As a result, I expect that after breaking the upper line of the symmetrical triangle, AUDCAD could rise at least to 0.9357 CAD.
First Target: 0.9357 CAD
Second Target: 0.9397 CAD
Stop Loss(SL): 0.9241 CAD
💡 Please respect each other's opinions and express agreement or disagreement politely.
📌Australian Dollar/Canadian Dollar Analysis (AUDCAD), 4-hour time frame.
🛑 Always set a Stop Loss(SL) for every position you open.
✅ This is just my idea; I’d love to see your thoughts too!
🔥 If you find it helpful, please BOOST this post and share it with your friends.
Forexanalysis

XAUUSD (Gold) 1H – Buy the Dip from Strong Demand ZoneGold is currently pulling back into a key demand/support zone, which previously acted as a strong base for bullish continuation. This area is marked as a high-probability buy zone, where smart money showed interest earlier.
Price reaction from this zone suggests buyers are still active. As long as the support holds, we can expect a bullish reversal and continuation toward higher highs.
🔹 Trade Idea:
Buy Zone: Marked demand area (best place for buy)
Target: Previous highs / upside continuation
Invalidation: Clear break and close below the demand zone
⚠️ Always wait for confirmation and follow proper risk management.

Bias Analysis – GBPAUD – HTFHTF Protected Low: 2.00585
HTF Liquidity Draw: 2.02015
Bias: Bullish
Execution depends on lower timeframe confirmation.
Bias only.

EURUSD – Bearish Continuation from Seller ZoneEURUSD is currently reacting from a strong seller zone after a corrective pullback. Price previously formed a range, followed by a strong impulsive move to the upside, but momentum is now weakening inside a descending channel, indicating potential bearish continuation.
🔴 Sell Zone: Previous supply / resistance area
🟢 Support Level: Marked support below acting as target area
🎯 TP: Prior demand & support zone
🛑 SL: Above seller zone highs
📌 Bias: Bearish while price remains below the seller zone
📈 Confirmation: Look for bearish rejection, lower highs, or bearish candles inside the zone
⚠️ Risk Management: Always use proper position sizing and wait for confirmation before entry.

EURUSD | 1H | Trend Reversal SetupPrice is currently moving inside a descending channel, showing strong bearish momentum. After tapping a key demand zone, we expect a technical bounce followed by a bullish continuation if confirmation appears.
🔹 Buy Zone: 1.1630 – 1.1650
🔹 Invalidation: Below demand zone
🔹 Target: 1.1720 – 1.1740
🔹 Structure: Falling channel + demand reaction
📈 Wait for confirmation (bullish candle / break of channel) before entry.
⚠️ Proper risk management is recommended.

XAUUSD Bullish Breakout | Resistance Flip → Target AheadGold (XAUUSD) has successfully broken above a key resistance zone, confirming a bullish structure shift on the 1H timeframe. After strong rejection from the lows, price reclaimed resistance and is now showing continuation momentum.
📈 Bias: Bullish
🎯 Target Zone: Marked upper resistance / liquidity area
📉 Invalidation: Below the previous resistance (now support)
A clean break & hold above resistance supports further upside. Ideal setup for trend-following traders waiting for confirmation and pullback entries.
Risk Management:
⚠️ Always use proper stop-loss
📊 Risk only 1–2% per trade
❌ Idea invalid if price closes back below the marked zone

XAUUSD Bearish Breakdown After Rising Channel Short Setupold (XAUUSD) has broken down from a rising channel, signaling a potential bearish continuation. Price faced strong rejection near the channel top and supply zone, followed by a sharp move below structure. As long as price stays below the resistance area, selling pressure remains valid with downside targets toward the marked demand zone.
Wait for confirmation and manage risk properly — patience = profit.
Risk Management:
✔️ Clear invalidation above resistance
✔️ Trade with proper position sizing

XAUUSD Sell Setup| Breakdown & Liquidity GrabGold shows strong bearish momentum after rejecting key resistance. Price has broken structure and retested the supply zone, indicating continuation to the downside. Looking for sell entries with proper risk management as price targets the next liquidity zone below.
🔻 Bias: Bearish
🎯 Target: Lower demand & liquidity area
🛑 SL: Above supply zone
⚠️ Note: Wait for confirmation, manage risk properly

USDJPY Retests Broken Resistance — Next Leg Up?The USDJPY ( FX:USDJPY ) has indeed performed as I expected in the previous idea , breaking through the falling wedge pattern and surpassing the anticipated targets, even reaching above the resistance zone(156.960 JPY-156.130 JPY).
Currently, it seems that USDJPY is undergoing a pullback towards the broken resistance zone(156.960 JPY-156.130 JPY) and is potentially entering the Potential Reversal Zone(PRZ) .
From the Elliott Wave perspective, it appears that USDJPY is completing the microwave 4 of the main wave 5. This microwave 4 may find its completion in the Potential Reversal Zone(PRZ) or near key support lines.
I expect that once USDJPY enters the Potential Reversal Zone(PRZ) , it will resume its upward movement, potentially climbing up to around 157.730 JPY. And if the bullish momentum remains strong, we could look forward to even higher targets for USDJPY.
First Target: 157.729 JPY.
Second Target: 158.24 JPY.
Stop Loss(SL): 154.82 JPY.
Points may shift as the market evolves
Please respect each other's ideas and express them politely if you agree or disagree.
📌 U.S. Dollar/Japanese Yen Analyze (USDJPY), 1-hour time frame.
🛑 Always set a Stop Loss(SL) for every position you open.
✅ This is just my idea; I’d love to see your thoughts too!
🔥 If you find it helpful, please BOOST this post and share it with your friends.

XAUUSD Bullish Continuation After Retest | Liquidity Expansion📊 Gold (XAUUSD) Price Action – Structure, Retest & Continuation Bias
This chart represents Gold Spot (XAUUSD) and highlights a bullish continuation setup based on market structure, liquidity behavior, and zone reaction.
After a strong impulsive move to the upside, price formed a temporary consolidation phase, indicating healthy profit-taking rather than trend weakness. This pause is important because it allowed the market to build new liquidity before the next leg higher.
🔹 Key Market Structure & Zones
Price previously created a clear bullish displacement, breaking above prior intraday resistance. Following this move, the market pulled back into a marked retesting zone, which aligns with previous demand and structure support. This retest is crucial, as it confirms that buyers are still active and defending the level.
The candles inside the retesting area show rejection and absorption, suggesting that selling pressure is weakening while buyers are stepping back in. This behavior often precedes a continuation move in the direction of the dominant trend.
🔹 Consolidation Zone (CZ) & Price Acceptance
The chart highlights a Consolidation Zone (CZ) where price spent time ranging before expanding upward. Markets tend to revisit such zones to rebalance orders. The current reaction around this area shows price acceptance, which strengthens the bullish bias.
A successful hold above the retesting zone increases the probability of a push toward higher levels.
🔹 Mini Reversal Zone & Upside Projection
Above the current price, a Mini Reversal Zone is marked. This area represents a short-term supply or reaction zone where price may experience a brief pause or shallow pullback. However, if bullish momentum remains strong, price is expected to break through this zone, triggering stops and fresh buy orders.
The projected path on the chart reflects:
Minor pullback
Continuation above resistance
Expansion toward higher liquidity targets
🔹 Trade Bias & Market Psychology
Overall sentiment remains bullish as long as price holds above the retesting support zone. The structure suggests that smart money has already accumulated positions lower and is now pushing price higher in phases.

EURUSD ANALYSIS & FORECAST | Wave Structure That WORKSEURUSD MARKET ANALYSIS & FOREX FORECAST: Wave Structure Breakdown
Complete market analysis using wave structure methodology. High-probability sell entry executed with 2:1+ risk: reward targeting break below momentum low.
📊 TOP-DOWN MARKET ANALYSIS:
Recent High: 1.18042 (Tuesday, 17th December 2025)
Since making this momentum high, EURUSD has been attempting to complete its bearish secondary trend (pullback/correction phase).
🌊 1HR CHART WAVE STRUCTURE:
Wave Count Analysis:
Price has printed two momentum lows:
Wave 1 Momentum Low ✓
Wave 3 Momentum Low @ 1.17024 ✓
Current Position: Wave 4 (Bullish Pullback)
The current bullish run is Wave 4, a pullback from Momentum Low 3 to a structural point. This wave should terminate below Wave 2 (trend invalidation point).
🎯 FOREX FORECAST - What's Next:
Expected Move:
Once Wave 4 completes, we expect a break below Momentum Low 3 (1.17024) to form Wave 5 and complete the larger bearish structure.
💡 Why This WORKS - Objectivity Through Structure:
This market understanding and price behaviour analysis allows us to be:
✅ Objective - No emotion
✅ Clear - No guessing
✅ Strict - Follow the rules
We know exactly what we're looking for and when to act.
🔬 ADVANCED EXECUTION - Internal Wave Analysis:
Method: Isolating the minor wave within the major swing
Focus Area: Wave 4 → Wave 5 (final leg of this Wave 4 structure)
Fractal Nature Applied:
Counted the internal bars based on fractal, what WORKS on big timeframes WORKS on small timeframes. This is the beauty of understanding the wave structure.
💼 TRADE EXECUTION:
Entry: Internal Wave 5 completion @ 1.07454
Why This WORKS:
This timing is a key component of the WavesOfSuccess methodology because it provides:
✅ High-probability entries
✅ Low-risk execution
✅ Optimal entry at reversal point
Stop Loss: 1.1763 (17.6 pips risk)
Target: Break below 1.1703 (72.4 pips potential)
Risk:Reward: >2:1 (2.05:1 minimum, potential for more)
Key Principle:
Wave structure provides the roadmap. Fractals ensure consistency across timeframes. Precision timing creates asymmetric risk: reward opportunities.
This is market analysis that WORK, it is mechanical, objective and repeatable.
👍 Boost if this market analysis helps
👤 Follow for continued EURUSD FOREX FORECAST updates

USDJPY bullish setupHarmonic ABCD pattern 4 hour
Trend reversal with RSI div at 1 hour
Support at fib 0.382
RRR > 1:3
Risk 1-5%

USDJPY Breaks Falling Wedge Pattern, Ready to pump!USDJPY ( FX:USDJPY ) has started to climb from its Support lines and Support zone(155.100 JPY-154.120 JPY), showing good momentum in its upward movement.
From a classical technical analysis perspective, it seems that USDJPY has successfully broken the upper lines of the falling wedge pattern on the 1-hour timeframe, which is a positive sign for the continuation of the bullish trend.
From an Elliott Wave perspective, it appears that USDJPY has completed main wave 4 using a Double Three Correction(WXY) within the Support zone(155.100 JPY-154.120 JPY).
Looking ahead, I expect USDJPY to resume its upward movement following a pullback to its Fibonacci levels, potentially rising at least to the 155.94 JPY.
First Target: 155.94 JPY.
Second Target: 156.27 JPY.
Stop Loss(SL): 154.82 JPY.
Please respect each other's ideas and express them politely if you agree or disagree.
📌 U.S. Dollar/Japanese Yen Analyze (USDJPY), 1-hour time frame.
🛑 Always set a Stop Loss(SL) for every position you open.
✅ This is just my idea; I’d love to see your thoughts too!
🔥 If you find it helpful, please BOOST this post and share it with your friends.

EURUSD Update: Target 2 Hit + Wave Extension | USDJPY ConflictFollow-up on yesterday's EURUSD call plus new USDJPY analysis showing interesting timeframe conflict.
📉 EURUSD UPDATE - Target 2 Achieved
Yesterday's Outcome:
Price broke below our second target as prescribed. The bearish setup played out perfectly.
Current Analysis:
Wave structure on the 5-minute chart shows significant downside potential remains.
🌊 Wave Structure Breakdown:
Current Position: Wave 2 printing extension
What This Means:
Wave 2 is extending, which creates a specific roadmap for the move:
Expected Sequence:
Wave 2 Extension - Current phase (5 data points)
Momentum Low (Wave 3) - Strong downside move
Pullback (Wave 4) - Brief correction
Concluding Wave 5 - Final leg down
Trading Strategy:
Sell every structural rally on the 5-minute chart. Each pullback within this wave structure represents a selling opportunity as the larger downtrend continues.
Execution: Wait for rallies to structural levels, then sell the rejection.
💴 USDJPY ANALYSIS - Timeframe Conflict
The Interesting Setup:
USDJPY is showing conflicting signals across timeframes—a common but tradeable scenario.
5-Minute Chart (Short-Term):
Price broke above the last rally high. Technically, this break signals exhaustion and creates a sell signal—a potential failure pattern where price breaks higher but can't sustain.
1-Hour Chart (Bigger Picture):
The larger timeframe structure still suggests higher prices should be expected. The bullish trend remains intact on the H1.
⚖️ The Conflict:
5Min: Bearish (break and potential failure)
1HR: Bullish (trend still up)
How to Trade This:
Two approaches depending on your style:
Approach 1 - Timeframe Priority:
Favour the H1 bias (bullish). Use 5-min pullbacks as buying opportunities within the larger uptrend.
Approach 2 - Short-Term Traders:
Trade the 5-min sell signal for a quick scalp, but manage risk tightly and expect the H1 trend to eventually reassert itself.
Recommended: Wait for timeframe alignment. When 5-min and H1 agree, the probability increases significantly.
Summary:
EURUSD: Sell structural rallies—Wave 2 extension suggests more downside
USDJPY: Timeframe conflict—5min bearish, H1 bullish. Wait for clarity or trade with appropriate timeframe bias.
👍 Boost if these updates help your trading
👤 Follow for continued multi-pair analysis
💬 Which pair are you trading? Comment below

EURUSD at Key Supply Zone – Shorts AheadEURUSD is reacting from a strong supply zone after taking buy-side liquidity. Price shows rejection and potential lower-high formation, suggesting a bearish continuation toward demand zones. Waiting for confirmation before entry. Trade with proper risk management.

XAGUSD Analysis - Strong Sell-Off & Bullish Reversal Is Loading 📊 XAGUSD (Silver) – 30 Minute Chart Detailed Analysis
This chart presents a 30-minute timeframe analysis of XAGUSD, highlighting a sharp bearish displacement, a key reaction zone, and the potential for a short-term bullish reversal if confirmation appears.
🔍 Market Structure Overview
Price was previously in a clear bullish structure, forming higher highs and higher lows.
After topping near the 64.50 – 64.70 area, the market printed a strong impulsive bearish candle, breaking the prior structure decisively.
This move qualifies as a Break of Structure (BOS) to the downside, indicating aggressive sell-side participation.
📉 Impulsive Move & Liquidity Sweep
The large bearish candle suggests:
Liquidity grab above recent highs
Institutional selling pressure
The move also fulfilled a measured move (≈ 2x range expansion), often seen at temporary exhaustion points.
🟦 Reversal Zone (Key Area of Interest)
The highlighted blue box represents a demand / mitigation zone around 61.70 – 61.95.
This area aligns with:
Previous minor consolidation
Reaction after strong displacement
Potential order block / imbalance mitigation
Price is currently consolidating inside this zone, indicating hesitation and reduced momentum from sellers.
🔄 What the Market Needs (Confirmation Logic)
At this level, the market does NOT justify immediate entries. A valid trade requires confirmation, such as:
Bullish engulfing candle
Strong rejection wicks from the zone
Break and close above short-term internal highs
Change of character (CHOCH) on lower timeframes
👉 The chart explicitly notes “Need Pattern”, emphasizing patience and discipline.
📈 Bullish Scenario
If confirmation occurs:
Expect a pullback-reversal toward:
62.80
63.50
Potentially the previous high zone if momentum builds
This would be a corrective move, not yet a full trend reversal unless higher structure confirms.
📉 Bearish Scenario
If price fails to hold the reversal zone:
Continuation toward:
61.20
60.80
This would confirm sellers remain in control and the zone has failed.
🧠 Trading Psychology Insight
This setup rewards:
Patience
Confirmation-based entries
Risk management over prediction
The market has already moved aggressively — the edge lies in waiting, not chasing.

RBA Holds Firm – Fed Turns Dovish: AUDUSD Ready to Surge!When looking at AUDUSD right now, we’re seeing a pair supported by both fundamentals and technicals. The RBA holding rates steady and refusing to ease policy, while the Fed shifts toward rate cuts and a more dovish tone , has weakened the USD and given the AUD a clear short-term advantage.
On the H1 chart, price was recently rejected from a strong resistance zone and is now pulling back toward the support area around 0.6620 — a level aligned with the recent swing low and the lower edge of the Ichimoku cloud. If price holds this zone and shows bullish reaction, the ideal scenario is for AUDUSD to form a higher low and retest 0.6650, potentially extending toward the upper resistance band.
As long as the higher-low structure remains intact and price stays above this key support region, the preferred approach is still buying on dips , rather than fighting the trend. Now we simply wait to see whether the market offers a “clean pullback” into 0.6620 for an entry — or decides to break upward without hesitation.

EURUSD Bearish Setup Triggered — TRZ + PRZ Confluence AheadToday, I want to share a short setup for EURUSD( FX:EURUSD ) and explain why this could be a great opportunity, so stay tuned!
Right now, EURUSD has entered a heavy resistance zone($1.192-$1.166), Time Reversal Zone(TRZ), and is approaching a Potential Reversal Zone (PRZ) .
The EURUSD also seems to be near the upper lines of two ascending channels, making a breakout less likely in the immediate term.
Additionally, a negative Regular Divergence(RD-) can be observed between the two peaks on the 4-hour chart, reinforcing the bearish outlook.
EURUSD reacted bearishly after the latest U.S. Unemployment Claims came in much stronger than expected (191K vs. 219K forecast). The data signals a resilient labor market, reducing expectations for near-term Fed rate cuts and giving the U.S. dollar fresh momentum as long as yields remain supported, with rallies facing selling interest unless the broader macro tone shifts in favor of risk assets.
Given these factors, I anticipate that EURUSD, after breaking the lower line of the ascending channel(small), could drop at least to $1.15940.
First Target: $1.1594
Stop Loss(SL): $1.172
Points may shift as the market evolves
What do you think about EURUSD? Will it break through the heavy resistance and the PRZ, or not?
💡 Please respect each other's opinions and express agreement or disagreement politely.
📌 Euro/U.S Dollar Analyze (EURUSD), 4-hour time frame.
🛑 Always set a Stop Loss(SL) for every position you open.
✅ This is just my idea; I’d love to see your thoughts too!
🔥 If you find it helpful, please BOOST this post and share it with your friends.

Ready for Big Move | Liquidity Sweep Setup Explained📌 Market Structure Update:
Gold is currently trading inside a tightening triangle pattern, showing clear liquidity grabs on both sides. After yesterday’s strong drop, price tapped a key demand zone and reacted aggressively. Now the market is moving between well-defined supply & demand zones, giving both bullish and bearish setups.
🔶 Key Observations
🟫 Major Supply Zone (Top Zone)
Price previously rejected strongly from this area, showing sellers are active here. If price retests this zone again, expect another possible sell reaction.
🟨 Intraday Supply Zone
A smaller supply just below the major zone. Price may spike into this area before giving downside continuation or bull trap.
🔷 Triangle Structure
Price is squeezing between diagonal support & resistance. A breakout is coming soon.
📉 Bearish Scenario
Failure to break the triangle top or rejection from the yellow zone may push price back into demand, and a break of the blue support could target the 4,180 liquidity zone.

AUDUSD: Mild Uptrend Set to Continue!Hello traders! Today, we will analyze the AUDUSD currency pair, and based on both fundamental and technical factors, I believe that AUDUSD is set to continue its mild uptrend in the short term.
AUDUSD is currently trading in an ascending channel , with strong support at 0.66265 and resistance targets around 0.66300 - 0.66600. The Fed maintains a stable monetary policy , helping USD remain steady , while the RBA continues its accommodative stance , supporting the AUD.
Clarifying the Fundamental Factors:
In the current market context, the Fed has maintained a stable monetary policy, which allows USD to retain its stability compared to other currencies, including the AUD. The Fed has no immediate plans to cut interest rates, creating a relatively stable environment for the USD, which supports its value against other currencies.
Although the RBA still maintains an accommodative policy, there have been no significant moves recently, but the economic stability in Australia continues to support the AUD. Economic indicators have shown modest improvement, and the stability in the economy prevents the AUD from weakening sharply. As a result, this creates favorable conditions for AUDUSD to maintain its mild uptrend.
Good luck with your trading!

EURUSD Ready for Reversal Smart Money Sell SetupAfter a strong intraday correction, EURUSD is now moving inside a rising channel, showing clear signs of bullish exhaustion. Price tapped into the premium zone / supply area, where sellers previously dominated, and is now forming a corrective wave structure.
🔍 What the Chart Shows
Price created a sharp bullish leg but failed to break cleanly above the key resistance.
Multiple rejections inside the upper supply zone signal weakening buyers.
Market is building a liquidity trap with higher-high attempts inside a rising structure.
Once liquidity is taken from the top, price is expected to reverse aggressively.
📉 My Expectation
I’m anticipating one more liquidity grab into the supply zone…
Then a clean bearish reversal targeting the discount area shown in the chart.
🎯 Key Levels
Rejection Zone (Sell Area): 1.16600 – 1.16720
Bearish Target Zone: 1.16180 – 1.16220
Invalidation: Clear breakout above 1.16720
🧠 Why This Setup is High Probability
✔ Liquidity buildup above recent highs
✔ Clear supply zone reaction
✔ Weak corrective bullish structure
✔ Smart money price behavior
This is a classic “grab liquidity & drop” setup — ideal for swing/ intraday traders.

XAUUSD | Bullish Reversal From Demand Zone🔥 XAUUSD | Intraday Reversal Setup – Buying From Demand Zone 🔥
Gold (XAUUSD) just tapped a fresh intraday demand zone, showing a sharp rejection wicks and a strong bullish push back above structure. Price is forming a potential short-term reversal, giving a clean BUY setup with multiple Take-Profit levels.
🟢 Why This Buy Setup?
Price respected a key support zone with aggressive buyer reaction.
Strong bullish engulfing candle after liquidity sweep.
Market structure turning bullish on lower timeframe.
Clear RR with defined TP1, TP2, TP3.
🎯 Targets (TP Levels)
TP1: Safe scalper target
TP2: Trend continuation target
TP3: Final extension target
🛡️ Stop Loss
SL placed below the rejection wick — protecting the setup while keeping RR favorable

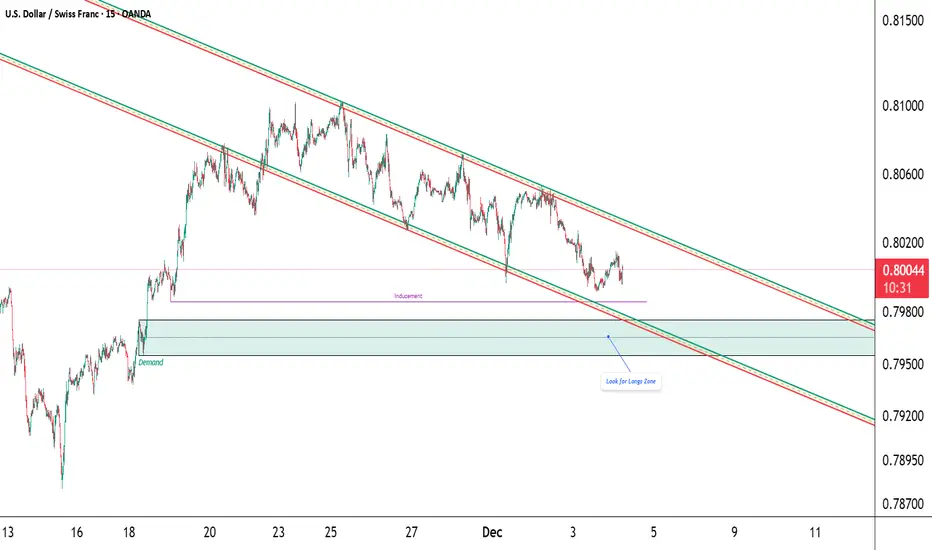
USD/CHF – Watching for liquidity sweep into origin demandPrice is trading inside a clean descending channel.
Below current price sits untouched inducement — a liquidity pool that lines up perfectly with the origin demand zone where the previous impulsive rally started.
If price sweeps that inducement and taps the demand zone, I’ll look for confirmation (MSS + FVG/OB) for a potential move back toward the channel midline or upper boundary.
Bias: Bullish upon sweep + tap
Invalidation: Clean break below demand
Confluence: Channel low + origin demand + resting liquidity
Not financial advice.