Market Outlook | GU, UJ & Gold Analysis | Nov 10–14In this video, we unpack how structure, sentiment, and events shaped last week’s price action across GBP/USD, USD/JPY, and XAU/USD (Gold) and what these clues reveal about where the market might head next.
The video highlights how the market reacted to the quiet U.S. week caused by the government shutdown, and how traders positioned themselves ahead of the major data coming up, from UK employment and GDP figures to U.S. CPI, PPI, and Retail Sales.
You’ll Learn:
✅Why each market moved the way it did last week in simple, clear terms.
✅How I connect fundamental sentiment with real chart structures.
✅Key price zones and levels I am watching in the coming trading week.
✅How I anticipate reactions to upcoming economic data.
Stay till the end for my outlook and mindset tip, and check the comment section throughout the week for real-time updates as I monitor price action.
Timestamps:
00:01 – Welcome & overview
01:35 – GBP/USD breakdown
06:55 – USD/JPY analysis
11:05 – XAU/USD (Gold) insights
14:05 – Closing outlook & mindset
⚠️ This isn’t a signal service; it’s my personal trading map, shared to help you think and trade smarter.
Forexanalysis

NZD/USD: Tech and Geostrategic Levers for ReboundThe NZD/USD pair currently trades near $0.5640$, softening after the Reserve Bank of New Zealand (RBNZ) survey. Two-year inflation expectations held steady at $2.28\%$ for Q4 2025. This neutral RBNZ outlook currently limits the New Zealand Dollar's (NZD) strength. Furthermore, the likely end of the US government shutdown supports the US Dollar (USD). Despite these immediate headwinds, several structural and technological factors create significant upside potential for the Kiwi currency.
Macroeconomic Catalyst: US Labor Weakness
The USD presently gains strength from the US Senate's vote to end the government shutdown. Nevertheless, the post-shutdown release of delayed US economic data, specifically the Nonfarm Payrolls (NFP), creates high-risk volatility. Private-sector surveys recently indicated a cooling trend in the US labor market. Any weakness confirmed by official US data will immediately exert severe selling pressure on the USD. This scenario presents the most potent near-term catalyst for NZD/USD appreciation.
Geostrategic Stability and Trade Corridors
New Zealand maintains a stable and predictable political environment. This institutional quality significantly enhances global investor confidence. Geostrategically, New Zealand benefits from its reliable trade links, primarily with the Asian economies. While US-China trade tensions create short-term market risk, New Zealand’s role as a smaller, diversified commodity and services provider mitigates the direct impact severity. The country remains a highly reliable partner, fostering strong long-term capital inflow.
High-Tech Diversification and Patent Strength
New Zealand actively pivots its economy toward higher-value exports. Technology, especially Agritech and Fintech, is driving growth. The tech sector currently ranks as the third-largest export industry, increasing foreign currency revenue. Strong R&D investment supports this structural diversification. New Zealand creates patented solutions for sustainable agriculture worldwide . Global demand for these science-backed, proprietary solutions structurally supports NZD strength long-term.
Conclusion
The NZD faces short-term pressure from US political resolution and RBNZ neutrality. However, market participants must look beyond immediate volatility. Structural drivers are in place. These include conditional USD weakness and New Zealand's growing strength in high-tech exports and geopolitical reliability. We project these factors will drive the NZD/USD pair higher as the market shifts focus from present risks to future economic fundamentals.

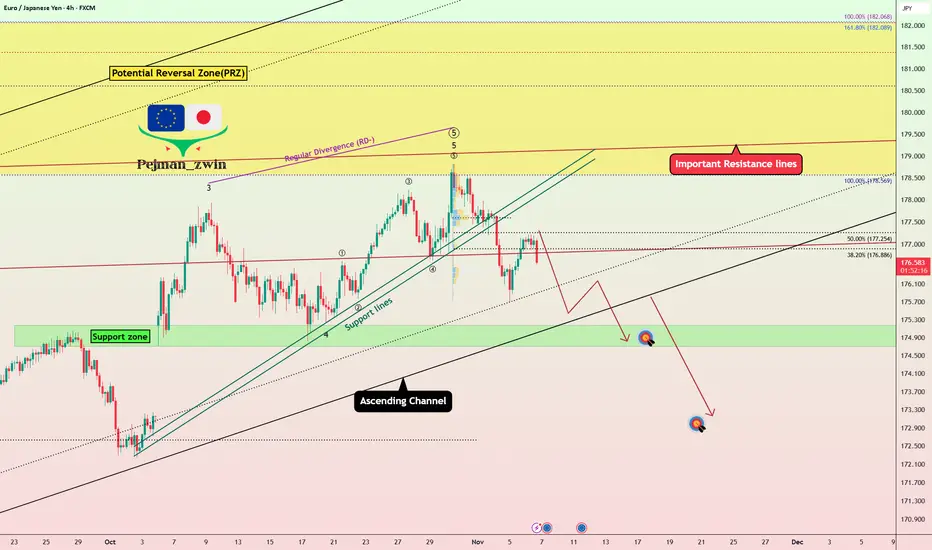
EURJPY Weakening Fast – Correction Phase Beginning!EURJPY ( OANDA:EURJPY ) started to fall nicely from the Potential Reversal Zone(PRZ) and important resistacne lines and managed to break the Support lines .
In the above timeframe, EURJPY is moving in an Ascending Channel .
In terms of Elliott wave theory , it seems that EURJPY has managed to complete the main wave 5 and with the break of the ascending channel , we can confirm the end of the main wave 5 . I see the beginning of the imminent corrective waves .
I expect EURJPY to decline at least to the Support zone(175.18 JPY-174.71 JPY) and lower lines of the ascending channel in the coming hours, and if the ascending channel breaks, the second target could be around 173.144 JPY .
Stop Loss(SL): 178.32 JPY
Please respect each other's ideas and express them politely if you agree or disagree.
Euro/Japanese Yen Analyze ( EURJPY ), 4-hour time frame.
Be sure to follow the updated ideas.
Do not forget to put a Stop loss for your positions (For every position you want to open).
Please follow your strategy and updates; this is just my Idea, and I will gladly see your ideas in this post.
Please do not forget the ✅' like '✅ button 🙏😊 & Share it with your friends; thanks, and Trade safe.
Silver Correction Ending: Major Drop AheadSilver (XAG/USD) has completed a 5-wave decline, marking the end of Wave (A)/(1) near the 45.53 level. Since then, price has been retracing upward in a complex W–X–Y corrective structure, which appears to be forming the final leg of Wave (B)/(2). The rise is losing strength near the upper channel, hinting that bulls may soon exhaust. Once Wave (B)/(2) finishes, the next big move is expected to be a strong bearish Wave (C)/(3) decline targeting lower zones near or below 45. In simple terms: last leg of correction nearly done → next big drop ahead.
Stay tuned!
@Money_Dictators
Thank you :)

EURUSD Technical Setup – Bullish Move Incoming?EURUSD ( FX:EURUSD ) is currently positioned near the lower line of a potential descending channel and is hovering around a Support zone($1.1542-$1.1514) . There's also a smaller descending channel that formed last week, which is something we should consider in our EURUSD analysis .
There's a Regular Divergence (RD+) between the two recent lows that EURUSD has made, which is a good sign of a possible reversal.
In terms of Elliott Wave theory , it appears that EURUSD has completed the main wave 5, with the main wave 3 being an Extended wave . A break of the upper line of the descending channel(small) could confirm the end of the main wave 5.
I expect that EURUSD could at least move up toward the next Resistance zone($1.1586-$1.1575) .
Second Target: $1.1597
Stop Loss(SL)= $1.14857
Please respect each other's ideas and express them politely if you agree or disagree.
Euro/U.S. Dollar Analyze (EURUSD), 1-hour time frame.
Be sure to follow the updated ideas.
Do not forget to put a Stop loss for your positions (For every position you want to open).
Please follow your strategy and updates; this is just my Idea, and I will gladly see your ideas in this post.
Please do not forget the ✅' like '✅ button 🙏😊 & Share it with your friends; thanks, and Trade safe.

AUD/NZD Nearing Peak: Expect Controlled PullbackAUD/NZD has completed a clean 5-wave impulsive move to the upside, finishing Wave (1)/(A) near the recent peak. From here, the price looks ready to start a deeper correction in the form of Wave (2)/(B), which may pull back toward the lower support zone inside the rising channel. This corrective move could unfold in multiple legs before turning bullish again. Once Wave (2)/(B) completes, the chart expects a strong rally into Wave (3)/(C), aiming for new highs. In simple terms: a healthy pullback first, then a powerful upside continuation.
Stay tuned!
@Money_Dictators
Thank you :)

AUD/CAD Approaching Support: Strong Bounce IncomingAUD/CAD has finished a strong 5-wave move to the upside, completing Wave (1)/(A). Since then, price has been moving in a corrective channel and is now forming an A-B-C decline toward the lower support zone. The current structure suggests one more push down to complete Wave C of (2)/(B), where buyers are likely to step back in. Once that final dip finishes, the chart expects a powerful Wave (3)/(C) rally to the upside, targeting new highs. In simple terms: small drop left → correction ends → strong bullish continuation ahead.
Stay tuned!
@Money_Dictators
Thank you :)

AUDUSD | Smart Money Building Long Positions From Demand ZoneAUDUSD is showing early signs of strength after reacting perfectly from the higher-timeframe demand zone (0.6530–0.6550). Price is consolidating near intraday support, suggesting possible accumulation before a liquidity sweep to the upside.
Trade Outlook:
Demand Zone: 0.6530–0.6550 (retest area)
Liquidity Target 1: 0.6596
Liquidity Target 2: 0.6615
Bias: Bullish unless price breaks below 0.6530
Possible Play: Look for BOS + retrace entry confirmation inside demand

USDJPY Eyes 153.20 Support as Fed Signals Patience on Rate CutsHey Traders,
In today’s trading session, we’re monitoring USDJPY for a buying opportunity around the 153.200 zone. The pair remains in a broader uptrend and is currently in a correction phase, approaching a key support and resistance area aligned with the ascending trendline.
Structure: USDJPY continues to print higher highs and higher lows, maintaining strong bullish momentum. The 153.200 level serves as a critical zone of confluence where buyers have historically stepped in.
Fundamentals:
Recent Fed commentary emphasized patience before cutting rates, citing the need for more evidence of cooling inflation. This reinforces a hawkish tone, supporting the Dollar
Trade safe, Joe.

NZDJPY — Waiting for the Sweep Before the ImpulseThe market is setting its own stage.
The green ABC correction is approaching its final C-leg — right into a cluster of confluence: trendline support, an internal order block, and a liquidity pocket resting beneath the prior lows.
I’m waiting for that final sweep into the OB/trendline area before stepping in to ride the pink impulsive C-leg toward the upper channel and buyside liquidity zone near 88.6 – 88.8 .
The plan is simple:
– Let the algorithm complete its cleanup below.
– Watch for an MSS and fair-value-gap confirmation.
– Ride the next displacement toward the liquidity resting above.
Invalidation:
If price violates the order block decisively and structure fails to shift, the setup expires.
Strengths:
– Clear multi-timeframe wave alignment (green correction → pink impulse)
– Strong OB + trendline + liquidity sweep confluence
– High reward potential once the pink C-leg activates
Weaknesses:
– Early entries before sweep risk being trapped
– Yen volatility can disrupt lower-timeframe confirmations
Summary:
Patience before precision. I’m waiting for the sweep to finish — then decoding the next wave of chaos.

AUDUSD – corrective math in motion.Price retraces into the prior order block that broke structure, completing a textbook ABC correction inside a premium zone. Liquidity pools just above IDM hint at a sweep before continuation toward 0.63.
Strengths :
Confluence between wave symmetry, premium retracement, and liquidity structure. Clear invalidation point above IDM keeps risk defined.
Weaknesses :
AUD fundamentals (RBA policy shifts, USD softness) could disrupt structure-based setups. No confirmed momentum shift yet on lower timeframes — patience required.
SmellyTaz — decoding chaos .

Does US Tech Dominance Outweigh Dovish Fed Policy?The recent slight rise in the USD/CHF pair toward 0.7940 signals a crucial shift in favor of the US Dollar, despite immediate monetary headwinds. While the Federal Reserve is broadly expected to deliver a dovish 25 bps rate cut driven by cooling US inflation and a soft job market, the DXY remains resilient. This Dollar strength is not simply speculative; it highlights profound structural weakness in the Swiss Franc. The chronically negative Swiss ZEW Survey Expectations, which improved only marginally to -46.4 in September, point to persistent domestic economic pessimism, which significantly erodes the Franc's safe-haven appeal. This divergence of underlying economic health proves more influential than short-term rate expectations.
The influence of geopolitical and geostrategic risk further supports the US Dollar. Upcoming high-stakes discussions between the US and Chinese leaders on trade and technology issues, including tariffs and rare earth controls, inject uncertainty into global markets. When major power tensions escalate, the US Dollar automatically benefits from its unrivaled status as the world’s most dominant reserve currency. Capital rapidly flows from smaller, risk-exposed jurisdictions and into USD-denominated assets. This flight to the world's most liquid currency strengthens the Dollar against rivals like the Franc, which is typically a safe-haven but lacks the USD's depth and liquidity.
Crucially, the long-term upward trajectory of the USD/CHF is underpinned by US technological dominance. The United States leads decisively in high-tech sectors, particularly in AI and life sciences. This leadership, evidenced by robust patent analysis and significant private sector investment, guarantees a continuous inflow of global capital. Generative AI alone is projected to add trillions in annual economic value, primarily benefiting US-listed companies. This enduring, structural edge in high-tech and science creates a massive, consistent demand for US assets, systematically bolstering the Dollar's value and allowing it to outperform the Franc, regardless of short-term interest rate adjustments.
In summary, the USD/CHF gain is a complex interaction of factors. Although the Fed is expected to cut rates, a fundamentally weak Swiss economic outlook and immediate geopolitical risks drive capital to the superior stability of the Dollar. Ultimately, the US Dollar's strength derives from the unmatched geostrategic advantage of its reserve status and its sustained global leadership in technology and innovation. These long-term structural drivers decisively outweigh the immediate dovish signals from the Federal Reserve, positioning the USD for continued strength against the Franc.

XAU/USD Completing Wave Y: Final Dip Before RallyGold has completed its major 5-wave rise and is now finishing a corrective W-X-Y pattern. The recent drop looks like the final leg of this correction, meaning sellers are getting weaker. Price may show a small bounce up and then one last dip to complete the correction. After that final drop, a strong new uptrend is expected to start again. In short: correction ending soon, last dip big bullish move ahead.
Stay tuned!
@Money_Dictators
Thank you :)

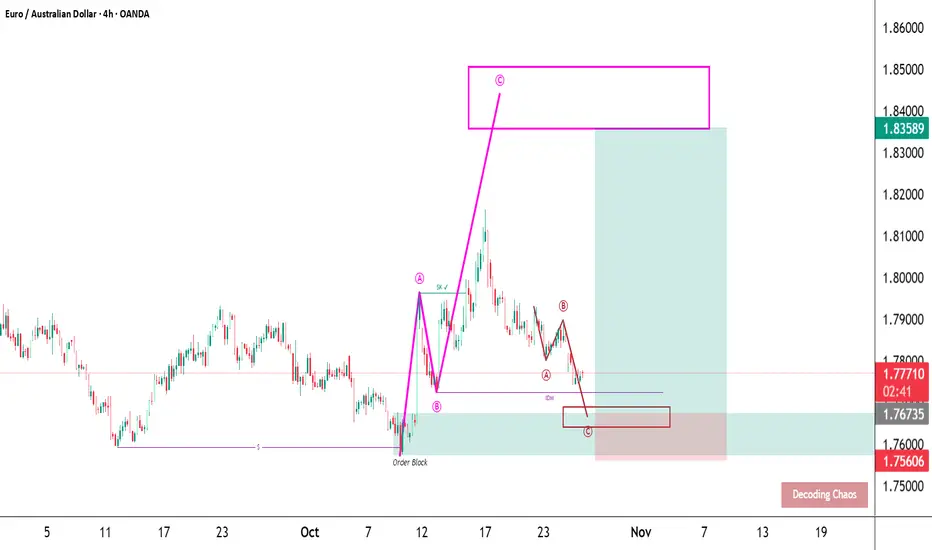
EURAUD – structure breathes in waves.Price retraces toward a clean order block within a discount zone after a strong impulsive leg. Correction is forming a precise ABC pattern, likely to complete near 1.767 before the next wave resumes toward 1.835.
Strengths:
Wave symmetry, confluence with order block, and IDM liquidity structure all align. Setup maintains bullish context from higher timeframe while defining risk clearly below C.
Weaknesses:
Momentum confirmation pending; daily RSI could signal exhaustion if recovery stalls. EUR fundamentals remain sensitive to data shocks that can distort technical structure.
SmellyTaz — decoding chaos.
AUDUSD Bullish Trade SetupTrend: Bearish
Divergence: Bullish
Reversal Pattern: Double Bottom
Bias: Bullish
Scenario:Entry at LH Break
Trade Plan
Stop Loss : 0.644
Entry Level: 0.65315
TP: 0.6635

DXY AnalysisOn the weekly chart, the price has formed a new trading range. We mark it out and move down to the daily timeframe.
After the correction, the price reacted from an inefficiency zone, showing buyer interest.
At the moment, I’m considering two bullish scenarios:
1️⃣ An impulsive breakout of the daily FVG zone followed by an expansion of the current range.
2️⃣ A reaction from the FVG zone, then a sweep of Friday’s low, after which the price could resume its upward movement.
I see the second scenario as more likely, as it would allow the market to collect liquidity before continuing higher.

GBPUSD Shooting Star Near Resistance Lines – Short Opportunity?Today, I want to share a potential Short opportunity on the GBPUSD ( FX:GBPUSD ) pair.
GBPUSD , as I expected in my previous idea , reached its target .
At the moment, GBPUSD has broken through a Support zone($1.340-$1.333) , but overall it is still moving within a Heavy Support zone($1.343-$1.313) and is near Resistance lines .
From a candlestick pattern perspective , it looks like GBPUSD is forming a Shooting Star near these Resistance lines .( To confirm the Shooting Star pattern, we need to wait until the end of the last 4-hour candle)
In terms of Elliott Wave theory , it seems that GBPUSD has completed wave 4 , and we should be looking for the start of wave 5 soon .
I expect GBPUSD in the coming hours to at least retest the 200_EMA(Daily) . If that breaks, the next target would be the Support lines , and if those support lines break, we could even see a move down to the Heavy Support zone($1.343-$1.313) .
Stop Loss(SL): 1.3412 USD
Please respect each other's ideas and express them politely if you agree or disagree.
British Pound / U.S Dollar Analysis (GBPUSD), 4-hour time frame.
Be sure to follow the updated ideas.
Do not forget to put a Stop loss for your positions (For every position you want to open).
Please follow your strategy and updates; this is just my Idea, and I will gladly see your ideas in this post.
Please do not forget the ✅' like '✅ button 🙏😊 & Share it with your friends; thanks, and Trade safe.

NZDJPY Long Trade IdeaTrend: Bearish
Divergence: Bullish
Reversal Pattern: Double Bottom
Bias: Bullish
Scenario: Entry at LH Break
Trade Plan
Stop Loss : 86.25
Entry Level: 87
TP: 87.75

AUDCAD Long Trade IdeaTrend: Bearish
Divergence: Bullish
Reversal Pattern: Double Bottom
Bias: Bullish
Scenario: Broke LH we will take entry at 0.382 FIB
Trade Plan
Stop Loss: 0.90565
Entry Level: 0.91215
TP: 0.9187

AUDJPY Long Trade IdeaTrend: Bearish
Divergence: Bullish
Reversal Pattern: Double Bottom
Bias: Bullish
Scenario: Buy Stop at Breakout of bearish Trendline
Trade Plan
Stop Loss : 99.75
Entry Level: 99.6
TP: 101.45

AUDJPY Bullish Trade IdeaTrend: Bearish
Divergence: Bullish
Reversal Pattern: Double Bottom
Bias: Bullish
Scenario: Buy Stop at Breakout of bearish Trendline
Trade Plan
Stop Loss : 99.75
Entry Level: 99.135
TP: 100.52

Forex Market Outlook | GU, UJ & Gold Analysis | Oct 13–17In this weekend’s Market Outlook, we break down the big moves from last week and share what to watch for in the coming week (Oct 13–17). We’ll look at GBP/USD, USD/JPY, and XAU/USD side by side, combining fundamentals (news, sentiment, data) with technicals (key price zones and chart setups).
By the end of this video, you’ll understand:
✅Why did the USD gain strength despite the government shutdown?
✅The key levels to watch on GBP/USD, USD/JPY, and Gold.
✅How upcoming events like Powell’s speech, UK jobs data, and U.S. inflation could move the markets.
⚠️ This isn’t a signal service; it’s my personal trading map, shared to help you think and trade smarter.
🔔 I’ll also be dropping updates in the comments section as the week unfolds, so keep an eye there for my real-time thoughts.

Long Bias Maintained – Waiting for LTF Confirmation from Demand Hello Traders,
I hope you're all doing well.
Reflecting on this pair: although price action moved in our favor yesterday, we didn’t get a valid entry. Today, I’m maintaining the same bullish bias and will look to go long from the recent demand zone, provided we get confirmation on the lower timeframes (LTF).
Let me know your thoughts on this analysis.
Happy trading!
