AUDCAD; Heikin Ashi Trade Idea📈 Hey Traders!
Here’s a fresh outlook from my trading desk. If you’ve been following me for a while, you already know my approach:
🧩 I trade Supply & Demand zones using Heikin Ashi chart on the 4H timeframe.
🧠 I keep it mechanical and clean — no messy charts, no guessing games.
❌ No trendlines, no fixed sessions, no patterns, no indicator overload.
❌ No overanalyzing the market; use only two time frames.
❌ No scalping, and no need to be glued to the screen.
✅ I trade exclusively with limit orders, so it’s more of a set-and-forget style.
✅ This means more freedom, less screen time, and a focus on quality setups.
✅ Just a simplified, structured plan and a calm mindset.
💬 Let’s Talk:
💡Do you trade supply & demand too ?
💡What’s your go-to timeframe ?
💡Ever tried Heikin Ashi ?
📩 Got questions about my strategy or setup? Drop them below — ask me anything, I’m here to share.
Let’s grow together and keep it simple. 👊
Forexeducation

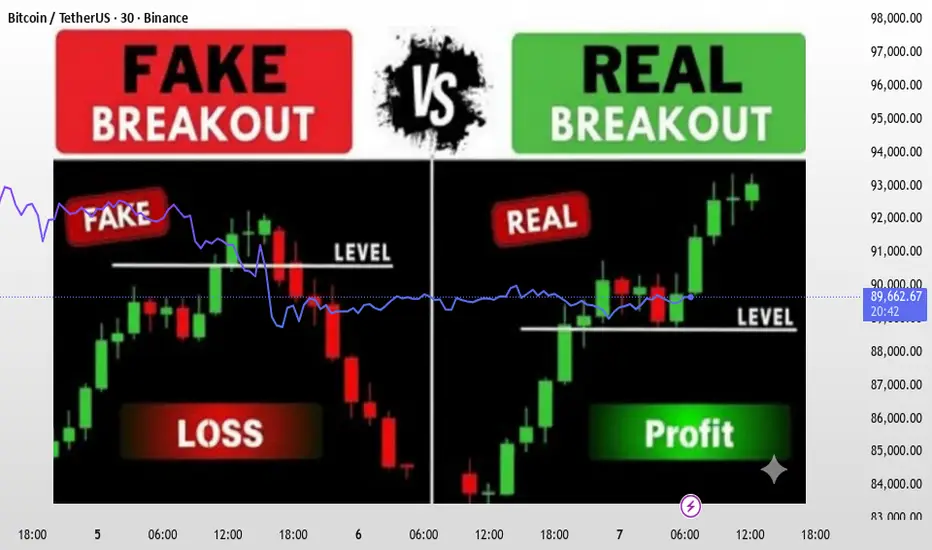
Breakout vs Fakeout – How to Identify the DifferenceBreakout vs Fakeout — The Complete Professional Guide
How Smart Money Creates Traps & How Traders Can Avoid Them
Breakouts and fakeouts are among the most misunderstood events in trading. Many traders enter too early, get trapped, and watch price reverse exactly after their entry. This educational idea explains, in depth, how institutions create fakeouts, how real breakouts are structured, and how you can confirm the difference using pure price action.
---
🔹 Understanding Market Behavior Behind Breakouts
Markets move from accumulation → manipulation → expansion.
The breakout or fakeout usually happens during the manipulation phase.
Smart Money (SMC) concepts play a major role here:
- Market builds liquidity above equal highs & below equal lows.
- Traders place buy stops or sell stops near key zones.
- Institutions trigger these stops to fill large orders.
- Only after trapping liquidity does the real move begin.
So before analysing a breakout, always ask:
👉 Who needs liquidity here — retail or institutions?
---
🔹 What Makes a Breakout Real?
A real breakout is not just a wick or a temporary push. It is a structural shift backed by momentum and confirmation.
✅ 1. Strong Candles With Clear Body Closes
A real breakout has wide-body candles closing decisively above resistance or below support.
Weak candles = weak intention.
✅ 2. Break + Retest + Continuation
The strongest breakouts follow this pattern:
1. Price breaks the level
2. Comes back for a clean retest
3. Holds structure
4. Forms a continuation pattern
This retest phase filters 70–80% of fakeouts.
✅ 3. Market Structure Shift (MSS / BOS)
For a bullish breakout:
- Price creates Higher Highs (HH) and Higher Lows (HL)
For bearish breakout:
- Price creates Lower Lows (LL) and Lower Highs (LH)
A breakout without structure change is not reliable.
✅ 4. Volume & Volatility Expansion
Breakouts must show an increase in:
- Volatility
- Candle size
- Trading activity
If volume remains flat, the breakout may fail.
---
🔹 How to Spot a Fakeout Before It Traps You
Fakeouts are intentional liquidity grabs. Here are the strongest warning signs:
❌ 1. Break Happens With Weak Candles
Small bodies, long wicks, hesitation candles — all indicate uncertainty.
❌ 2. Price Fails to Close Outside the Zone
This is the #1 rule:
If price does not close outside resistance/support, it is most likely a fakeout.
❌ 3. Instant Rejection Back Into the Range
If price breaks the level and immediately returns inside, institutions are hunting stops.
❌ 4. No Retest — Just a Sharp Reverse
Real breakouts retest.
Fakeouts don’t.
They reverse fast because their only purpose was liquidity collection.
❌ 5. Presence of Equal Highs / Equal Lows
When the market forms equal highs/lows, it signals liquidity pools.
Fakeouts usually occur right above/below these areas.
---
🔹 Advanced Confirmation Technique (Institutional Logic)
Here’s a professional-level method used by SMC traders:
1. Identify the liquidity zone (EQ highs/lows)
These serve as targets for traps.
2. Wait for the first breakout
Do not enter here.
3. Look for the rejection candle
A “fakeout candle” usually has:
- Long wick
- Small body
- Closes back inside the structure
4. Wait for BOS (Break of Structure)
Once price reverses and breaks an internal structure, the fakeout is confirmed.
5. Enter on the retest of the trap zone
This is the safest and most profitable entry.
---
🔹 Practical Example (General)
Let’s say Gold is ranging between $2400 - $2420.
- Price spikes above $2420, hits stops, and forms a long-wick candle
- The breakout candle fails to close above resistance
- Price immediately drops back inside the range
- Internal structure breaks → fakeout confirmed
- Retest of $2420 becomes the ideal sell entry
This exact behavior happens in XAUUSD almost daily.
---
🧠 Final Professional Tip
Breakouts are easy to trade once you stop trying to predict them.
Let the market show you:
- Strong close
- Clear retest
- Momentum
- Structural break
And avoid all entries based only on a wick touching resistance or support.
Patience is the difference between a trapped trader and a profitable trader.
Your boosts, comments, and likes motivate me to share more accurate analyses like this.
👉 If you found this helpful, please Boost the idea and leave a comment — it really helps!
— JT_CHARTsMaster
How I Managed To Achieve 13.83% By Improving My Win Loss RatioThe SMC model that I used provided a beautiful mechanical system for me but did not provide a win loss ratio. The account balance would keep going down inspite of the great RRR.
I added the classical school and the Stochastic to see if I can get better results by those filters. What happened is that the daily stochastic became my major indicator and all the others, including the SMC model, became support confirmations.
The last thing that I added was the opening trades mechanism. I would open multiple trades during the day and once I am satisfied of the positive result I would close all trades. I might close all on the same day of opening.
In four weeks of testing this methodology I was able to turn my win loss ration from a disaster to even the wins exceeding the losses, and not one single batch was closed negative. All trade batches were closed on the positive.
This is a great method not only to increase my balance but also to increase my confidence.
I am not preaching that my plan is great, what I want to concentrate on is the value of education and continuous learning.

NZDCADHello Traders! 👋
What are your thoughts on NZDCAD?
NZD/CAD has been moving in a continuous downward structure and has now reached a key support zone. In this area, we expect a positive reaction from the price. At the moment, the descending trendline is preventing further bullish movement, but we expect that at this stage the price will manage to break above it and reach the projected targets. Therefore, you can wait for the descending trendline to break, and after the breakout, enter on the pullback.
Don’t forget to like and share your thoughts in the comments! ❤️

EURUSD 5Min: Downtrend Continuation - Failure Trade Execution Setup Analysis:
Price in established downtrend with pullback (discount) to the last posted high. After breaking above this high, buyers failed to show conviction - no follow-through. This signals weakness and validates our sell entry.
Trade Execution:
Entry: 1.15845
Stop Loss (Invalidation): 1.15900
Risk: -5.5 pips
Target: 1.15160 (Fibonacci -23.6% extension)
Initial Risk: Reward: 3.04:1
Trade Management:
After several hours, price approached T1 but reversed before reaching the target. Price came within 1 pip of our target before showing reversal signals.
Decision: Manually closed via mobile for +12 pips profit, protecting gains against the emerging reversal pattern.
How To Behave While In Trade - Five Fundamental Truths:
1️⃣ Anything can happen in the market
2️⃣ Every moment is unique
3️⃣ An edge is just an indication of higher probability
4️⃣ There will be random distribution between wins and losses
5️⃣ I don't need to know what happens next
Key Lesson: Sometimes taking partial profits or closing early based on price action is better than waiting for a full target. Mechanical trading includes reading price behaviour and protecting your gains.
Outcome: ✅ Closed manually for +12 pips profit due to reversal pattern near target.
This is the WavesOfSuccess methodology - React to price, manage risk, protect profits.
👍 Boost if you found this valuable
👤 Follow for more live trade breakdowns

CADJPY Downtrend Continuation - WavesOfSuccess MethodologyTrade Execution:
Wednesday, 11th November 2025 @ 09:35 GMT
Entry triggered after price closed below the Momentum Low bar at 110.01, confirming downtrend continuation.
Trade Management:
Entry: 110.01
Stop Loss (Invalidation): 110.08
Risk: -8.6 pips
Target: 109.73 (Fibonacci 76.4% retracement to -23.6% extension)
Risk: Reward Ratio: 3.06:1 (Risking 8.6 pips to capture 26.1 pips)
Result:
Target achieved at 13:28 GMT after New York session open. ✅
The Psychological Edge - How to Behave While in Trade
This is MORE important than technical analysis. Master these five fundamental truths:
1️⃣ Anything can happen in the market
2️⃣ Every moment is unique
3️⃣ An edge is just an indication of higher probability
4️⃣ There will be random distribution between wins and losses
5️⃣ I don't need to know what happens next
The key: Follow your mechanical rules, manage your risk, and let probability work in your favour over time.
This is mechanical trading. This is the WavesOfSuccess methodology.
If you found this valuable:
👍 Hit the boost button
👤 Follow for more trade breakdowns and education

CADJPY 5Min Setup - Trade Invalidation ExampleThe Strategy:
We execute trades after key levels are tested and fail to hold.
When price breaks a high but buyers show no conviction (no follow-through), this signals weakness. A sell becomes valid.
When price breaks a low but sellers show no conviction, a buy becomes valid once the entry setup confirms.
Trade Invalidation - The Most Critical Rule:
Every mechanical strategy MUST have clear invalidation criteria.
As long as your setup remains valid, you hold your expectation. The moment it invalidates, you either close the trade or don't enter at all. No exceptions.
Today's Example:
The CADJPY 5-minute chart showed a potential setup that became INVALIDATED before entry could be taken. This is exactly how mechanical trading protects your capital—knowing when NOT to trade is just as important as knowing when to trade.
If you found this helpful, give us a thumbs up! 👍

The Formula to Make $10000 Daily👋 Hello traders!
If you’re looking for a real way to make $10000 every day from the markets, forget about the so-called magic strategies or secret expert tricks.
The truth is simple: there’s no overnight success formula. But there is a realistic path built on probability, discipline, and time — and that’s what I call The Formula to Make $10000 Daily .
⚙️ Step 1: Build a High-Probability Trading System
📊 This is your foundation.
A good trading system doesn’t have to be complex, but it must have clear rules and consistent logic .
You should always know:
✅ When to enter a trade
✅ When to stay out
✅ And most importantly — why you’re entering
Choose a strategy you can truly master and apply consistently — such as Break & Retest , Supply & Demand , or Market Structure Shift .
Every trade should have a Risk-to-Reward ratio (R:R) of at least 1:2 or higher.
💡 Example:
If you risk $2000 per trade and win just two out of three trades daily, you’ll make $4000.
Increase your lot size gradually and stay consistent — $10000 a day becomes a realistic outcome.
💼 Step 2: Capital Management – The Key to Survival
🧠 You can’t make $10000 daily if you lose $10000 in one bad trade.
Capital management isn’t just about protecting your balance — it’s about protecting your mindset and system.
Follow these golden rules:
💰 Risk only 1–2% per trade
🛑 Always use a stop loss
🎯 Set a clear take-profit target
With a $50,000 account, risking 1% equals $5000.
If your R:R ratio is 1:3, one winning trade a day earns $15000.
That’s not luck — that’s mathematics working in your favor .
🧘♂️ Step 3: Master the Trader’s Mindset
Once you have a solid system and money management plan, the final piece — and the most important — is your psychology .
Most traders don’t fail because their system is bad. They fail because they can’t control themselves .
Keep these principles close:
🚫 Don’t trade when emotions take control
🚫 Don’t revenge trade after losses
🚫 Don’t increase lot size out of greed
🚫 Don’t force yourself to take trades every day
A professional trader doesn’t aim to win every trade — they aim to lose less and lose smart .
🧩 The Real Formula
💎 (High-Probability System + Strict Risk Management + Strong Psychology) × Time = Sustainable Profit
There are no shortcuts.
No magic indicators.
Only you and your discipline .
📖 Real Story
One of my students, Ken, started with a $10,000 account.
He didn’t try to go big — instead, he aimed to earn 1% a day , or $1000.
After six months, by slowly increasing his trade size and staying disciplined, his average daily profit reached $10000 .
He told me:
“I didn’t need to change my system. I just needed to change myself.”
🎯 Final Thoughts
The formula to make $10000 daily doesn’t come from any special indicator, signal, or secret course.
It comes from understanding your system deeply, managing your capital wisely, and staying disciplined every single day .
💬 The market doesn’t reward the fastest traders. It rewards the most patient, consistent, and focused ones.
If you’re on your journey to becoming a professional trader, start today.
🔥 Build your own formula — and practice it every single day until it becomes second nature.

Trading Discipline – The Defining Edge of Professional TradersIn Forex and Gold trading, there is one truth every trader eventually learns: discipline matters more than strategy.
A simple system executed with discipline can deliver consistent results.
A brilliant system without discipline will collapse under pressure.
🧠 Stop-loss & Take-profit – Your Survival Tools
Stop-loss: Not surrender, but capital protection.
Take-profit: Not prediction, but securing gains before greed erodes them.
👉 Rule of pros: Set SL/TP before entering a trade – and never move them out of fear or hope.
📊 Case Study: Discipline vs Emotion
Undisciplined trader: Moves stop-loss further when price goes against him. Small loss turns into account damage.
Disciplined trader: Keeps stop-loss intact, loses 1%. Over 20 trades, system edge delivers net profits.
➡️ Lose small to win big.
🚀 Habits That Build Discipline
Have a trading plan: Entry rules – SL – TP – risk – time frame.
Use alerts: Reduce stress, stop staring at charts.
Walk away after entry: Don’t let emotions interfere.
Fixed risk: 1–2% per trade, no exceptions.
Keep a trading journal: Track not only results but emotions behind decisions.
🏆 Why Discipline Separates Pros from Amateurs
Amateurs let the market control them.
Professionals control themselves.
In the long run, success doesn’t come from one “perfect trade” but from hundreds of disciplined executions.
📈 Conclusion
The market is uncontrollable. But you can control yourself.
Discipline is the edge that:
Protects your capital.
Stabilizes your mindset.
Turns strategy into consistent results.
👉 Have you ever broken your stop-loss or take-profit rules? What did it teach you about discipline?

“XAUUSD – Strong Retracement From New All-Time High (ATH) 3650“XAUUSD – Strong Retracement From New All-Time High (ATH) 3650 📉”
Gold (XAUUSD) reached the all-time high resistance / PRZ zone (3645–3680) and immediately showed rejection signs, confirming this level as a high-probability reversal point.
📊 Technical Breakdown
PRZ Rejection: The move above 3650 failed to sustain, indicating a liquidity grab and false breakout structure.
Momentum Exhaustion: A parabolic advance from 3330 support into ATH left behind multiple imbalances (FVGs) that now attract price back down.
Liquidity Dynamics: The rejection suggests buy-side liquidity has been taken, and the market may now seek sell-side liquidity below recent swing lows.
Market Structure: Intraday structure shows early signs of a bearish shift, with lower highs forming under 3635–3625.
🎯 Downside Targets
3585–3578 → First corrective level (38.2% retracement).
3565 → Key midpoint of the rally.
3545–3516 → Liquidity + 61.8–78.6% retracement cluster.
3480–3460 → Previous consolidation base.
3330–3320 → Major high-timeframe support demand zone.
⚠️ Invalidation
If buyers reclaim 3660–3680 with strong daily closes, the bearish retracement scenario will be invalidated, opening the path toward new ATH extensions.
📌 Conclusion:
Gold’s rejection at 3650 ATH PRZ is a significant technical signal. Current order flow suggests a retracement phase toward 3580–3515, with potential extension to 3330–3320 key support if selling pressure persists.

GOLD – New All-Time High Gold has just reached a new all-time high, touching the level of 3598.10 for the first time in history. With this move, the market has created a new Higher High (HH), placing the price near a very significant resistance zone.
🔎 Key points to watch:
If price holds above this zone, continuation of the bullish momentum remains possible.
However, in case of rejection, we could expect a pullback towards the 3500 and potentially 3440 levels.
📊 This zone will be crucial for defining the next direction of Gold. Traders should pay close attention to how price action behaves in the coming sessions.

"Gold’s Critical Bounce Zone – Is $3,400 the Next Magnet Level?""Gold’s Critical Bounce Zone – Is $3,400 the Next Magnet Level?"
📊 XAUUSD is showing a textbook bullish structure setup after forming a Higher Low right above strong support at $3,339. Price is now trading inside the Entry Zone ($3,348 – $3,339), an area that aligns with:
✅ Order Block Support
✅ Previous Break of Structure (BOS)
✅ Smart Money Fair Value Gap (FVG) retest
🧐 Market Structure Insight
Recent BOS flipped bias to bullish after buyers pushed through prior resistance.
A bullish FVG from earlier in the trend still holds influence, attracting price back for a healthy retest.
The current Higher Low shows buyers stepping in early, maintaining upward momentum.
Strong resistance is located at $3,400 – $3,440, which also acts as a psychological magnet for traders.
🎯 Trade Plan (Educational Example)
Entry Zone: 3,348 – 3,339 📍
Stop Loss: below 3,339 🛑
Target 1: 3,380 🎯 (partial profits)
Target 2: 3,400 ⭐ (main target)
Extended Target: 3,420 – 3,440 💎
📈 Reward to Risk: ~1.6R to the main target, with potential 2.9R to extended resistance if momentum accelerates.

Gold’s Relentless Rally: Hard Lessons Every Trader Must Face💥This past week, Gold surged without a single technical pullback. The rally was so sharp and one–sided that many traders who were holding Sell positions had no chance to exit safely. The result? Blown accounts, heavy drawdowns, and a painful reminder of what happens when we ignore risk.
📉 When the Market Ignores Technicals
Technical Analysis (TA) works—until the market decides otherwise.
In periods of aggressive flows, patterns, indicators, and even trendlines can fail completely.
At such times, the only thing that separates survivors from blown accounts is risk management and discipline.
🔑 Trading Lessons You Can’t Afford to Ignore
1️⃣ Stop Loss is your life jacket – Without it, one wrong move can sink your entire capital.
2️⃣ Never hold onto losing trades hoping for a reversal – The market doesn’t care about your hopes.
3️⃣ Capital management is more important than perfect analysis – One bad trade should never define your future.
4️⃣ Accept losses to survive – The best traders aren’t always right, but they always live to fight another day.
💡 A Message to Every Trader
Last week’s move in Gold taught us one brutal truth:
👉 No discipline = No capital.
👉 No capital = No trading career.
If you’ve taken heavy losses, don’t let it break you. See it as a turning point to rebuild with stronger rules and discipline. Markets will always offer opportunities, but only for those who protect themselves first.
✅ Final Takeaway
This week, don’t just stare at charts—revisit your trading plan and strengthen your discipline.
Remember: discipline may not make you rich overnight, but it will keep you alive long enough to get there.
XAUUSD Professional OutlookXAUUSD Professional Outlook
Gold has been carving out a strong bullish structure, showing resilience after multiple liquidity sweeps and rejections from deeper zones. The chart indicates that buyers continue to dominate, with price currently pressing toward a critical resistance region.
🔹 Key Observations
Structure Alignment
The market has successfully defended every higher low, proving the strength of buyers.
Recent momentum confirms that demand zones are being respected while supply zones are gradually weakening.
Support & Demand Control
3320 – 3330 stands as a major structural support, where liquidity was swept and buyers re-entered aggressively.
Current buying zone around 3380 – 3400 is the short-term level where fresh orders may accumulate before continuation.
Resistance in Focus
The resistance block around 3415 – 3440 is the immediate test.
A rejection here could trigger a controlled pullback, but the probability favors a bullish breakout given the ongoing higher-low pattern.
Liquidity Dynamics
Smart money has already cleared liquidity below the July swing.
Market is now targeting liquidity pockets above, aligning with a push toward the 3440+ region.
🎯 Trading Scenarios
Bullish Case (Higher Probability)
Buy retracement toward 3380 – 3400, with upside targets at 3440 and extended 3480 – 3500 if breakout occurs.
Bearish Risk Case
Failure to hold above 3380 could push price back into 3320 demand, where the larger bullish thesis would be tested.
📝 Final Note
Gold is operating in a controlled bullish cycle with momentum favoring buyers. As long as 3320 holds firm, dips remain buying opportunities, and the path of least resistance is upward. The upcoming test at 3440 will be decisive for either a strong continuation or a temporary pullback

Gold Eyes Short-Term Pullback Before Key Support Test"Gold Eyes Short-Term Pullback Before Key Support Test 🏆📉"
Market Structure
The chart shows a clear range-bound price action between the strong support near 3,303 – 3,316 and the resistance zone around 3,420 – 3,440.
Multiple Higher Lows (HL) indicate that the market has been trying to build a bullish structure, but the recent level rejection from resistance suggests sellers are still defending that zone aggressively.
2. Key Zones
Resistance (3,420 – 3,440): Price tested this level and faced a sharp rejection, marking it as a strong supply zone.
Support (3,303 – 3,316): Historical buy reactions are seen here, making it a crucial demand zone.
Entry Zone: Around 3,351 – 3,360, which is being used for the current short setup.
3. Pattern & Price Action
BOS (Break of Structure) occurred earlier on the left side of the chart, breaking above previous highs and confirming bullish strength at that time.
BOL (Break of Low) later on indicates a shift in momentum, as price failed to maintain the bullish push and created a bearish swing.
The Bullish Fair Value Gap (FVG) earlier provided a springboard for upward movement, but recent momentum failed to sustain.
4. Current Trade Idea (Short Bias)
Entry: 3,351 – 3,360 (retracement to minor resistance after breakdown).
Stop Loss: Above 3,380, protecting against a false breakout.
Target: 3,316 (mid-term) with a possible extension to 3,303 if bearish pressure continues.
5. Sentiment & Risk Factors
Bears are currently favored due to the rejection from major resistance and the inability of bulls to reclaim 3,380+.
If the price reclaims and holds above 3,380, this short setup will be invalidated, and the market could retest 3,420 – 3,440.
📌 Summary:
XAUUSD is trading in a defined range, with the current structure leaning bearish after resistance rejection. A short position from the entry zone targets the strong support below, but traders should remain cautious as higher lows in the past indicate that bulls may still attempt to defend support aggressively.

The 50/50 Account Management Scam- How it WorksFrom Cold Calling to Telegram
I’ve been in the markets for so long I feel like a dinosaur, and I’ve probably seen every scam out there.
The truth is, none of them are really new — they’re just adapted to the new social paradigm.
What was done in the 2000s through cold calling is now done through Telegram, Instagram, X, and other social platforms.
I didn’t really want to write this article, in case it gave someone ideas.
But since anyone who wants to be a scammer already knows how it works, maybe this article can warn those who still have no idea how the so-called account management scam operates — especially its most common form: the coin flip scam (50/50 scam, Opposite trades scam, Split-direction scam, Two-group margin call trick, as is also known)
Step-by-Step: How the Coin Flip Scam Works
1. Gathering the victims
The scammer starts by fishing for victims through Telegram channels/groups, Instagram profiles, Facebook groups, or even X posts.
They present fabulous profits, post ads with guaranteed return offers, and flood the feed with so-called “proofs” — screenshots of winning trades, client testimonials, and account statements. Most of these are either fabricated or selectively chosen to show only the winning side.
Once someone shows interest, the scammer’s first move is to earn their trust.
They’ll tell you the broker doesn’t matter, that you can choose it, and that they have no access to your money — which is, technically, true.
Then comes the closer:
“You don’t have to pay me upfront. I only get paid if I make you money, so it’s in my best interest not to lose. You see? We’re on the same side.”
This combination of flashy results and “risk-free” terms makes you feel safe enough to hand them trading access.
________________________________________
2. Splitting into two groups
The accounts are divided into two equal batches:
• Group A → All-in BUY
• Group B → All-in SELL
With high leverage (e.g., 1:200), a 50-pip move means either doubling the account or wiping it out completely.
Note: I won’t go too deep into the details here, because the exact margin call level depends on the broker. But trust me, it’s easy for a scammer to plan the money split based on the different brokers’ rules. What we’re talking about here is just the general principle.
________________________________________
3. Guaranteed winners and losers
The market moves.
One group hits margin call and loses, while the other doubles or triples its capital (depending on broker's leverage, even more on 1:500).
The scammer now has perfect marketing material: “Look how I doubled my client’s account!”
________________________________________
4. Milking the winners
Clients who made a profit are celebrated and told something like:
“I only worked with low capital this time just to show you I can do it. I have big clients and serious strategies — now that you’ve seen the proof, deposit more so we can make real money.”
The scammer frames the initial gain as a “demo run” to gain the client’s confidence, pushing them to commit much larger sums next.
________________________________________
5. Recycling the losers
The wiped-out clients are told:
“It was an unusual market move. Deposit another $1,000 and we’ll recover it tomorrow.”
Some quit, but others fall for it again.
________________________________________
6. Repeat the process
The cycle continues. There’s always a “happy” group and real account statements to attract fresh victims, while the losers are quietly discarded or convinced to reinvest.
________________________________________
Why the scam works
• The proof are authentic – Screenshots and MT4/MT5 statements for the winners are real.
• Survivorship bias – Prospects only see the successes, never the failures.
• Hope psychology – Losers believe “next time” will be different (and it can be if they end up in the "winner group" next time
________________________________________
Final word
If someone promises to double your account quickly and safely — walk away.
Real trading is about risk management and long-term consistency, not betting your capital on a 50/50 gamble.
Don’t be the next screenshot in a scammer’s sales pitch. 🚀
P.S.
Stop believing they “made you money on purpose” at the beginning and then “lost it on purpose” after you deposited more.
If they truly had the skill to do that, they wouldn’t need to be scammers in the first place.
The reality is simple — once you put in more money, you just happened to land on the losing side of their scam.

XAUUSD Bearish SMC Analysis – Institutional RejectionXAUUSD Bearish SMC Analysis – Institutional Rejection from Supply Zone
Gold (XAUUSD) is showing a clear bearish structure after rejecting a major supply zone at premium pricing. This setup is aligned with Smart Money Concepts (SMC) and reflects how institutions manipulate liquidity and order flow before major price moves.
🔍 Market Structure Context:
The market had been trending upward with higher highs and higher lows, until it approached a key premium supply zone near $3,420.
At this level, price stalled, creating internal Equal Highs (liquidity) — a common trap used by institutions to grab orders before reversing.
🔄 Change of Character (CHoCH):
A clear CHoCH was printed when price broke below the most recent higher low, signaling a shift from bullish to bearish structure.
This change marked the first early signal that institutional order flow has flipped bearish, and distribution is underway.
📉 Break of Structure (BOS):
Following the CHoCH, the market confirmed intent with a clean BOS to the downside.
This structural break confirms bearish control and validates short bias.
🧲 Liquidity Engineering:
Equal Highs were swept at the top, indicating a liquidity grab before institutions drove price downward.
This move traps breakout buyers and provides large players with sell-side execution at premium pricing.
🧱 Fair Value Gap (FVG) & Supply Zone Mitigation:
After BOS, price retraced into a Bearish Fair Value Gap (FVG) and the origin of the supply zone, offering a high-probability entry.
The rejection from this zone showed imbalance was respected and no bullish continuation existed — further validating the short setup.
🔍 Confluences for the Bearish Bias:
Confluence Confirmation
CHoCH Structure flipped bearish
BOS Bearish continuation confirmed
Liquidity Sweep Equal highs taken
FVG Retest Smart Money re-entry signal
Supply Zone Mitigation Institutional reaction confirmed
📘 Educational Summary:
This setup exemplifies a complete Smart Money bearish reversal model:
Premium pricing ✅
Liquidity taken ✅
Structure flipped (CHoCH + BOS) ✅
Supply & FVG respected ✅
It reflects how institutions build positions quietly, using engineered liquidity to trap retail traders, and then drive price with high-volume imbalance moves.

XAUUSD Chart Analysis – Smart Money Concepts (SMC) Based🔍 XAUUSD Chart Analysis – Smart Money Concepts (SMC) Based
1. Market Structure Overview:
The chart clearly shows a bullish market structure forming after a sequence of Breaks of Structure (BOS) and Change of Character (CHoCH) events.
The market has consistently made Higher Lows, indicating strength from the bulls and institutional order flow to the upside.
2. Key Zones Identified:
✅ Strong Support Zone (Demand Area):
Around $3,260–$3,280, this level has been respected multiple times.
It is marked with BOS, CHoCH, and a Bullish Fair Value Gap (FVG) indicating institutional accumulation and unfilled orders.
The area also contains a Weak Low, which gives price a reason to stay above if bullish sentiment continues.
❌ Strong Resistance Zone (Supply Area):
Around $3,420–$3,460, this area shows signs of Level Rejection and is labeled with Buy-Side Liquidity.
This is where price previously reversed after grabbing liquidity—indicating distribution and possible shorting interest from smart money.
3. Liquidity Zones:
Buy-Side Liquidity: Above recent swing highs near $3,420–$3,440. Price tapped this level and sharply rejected.
Sell-Side Liquidity (Target Area): Currently aiming for the zone around $3,350, which aligns with a recent imbalance (FVG) and a clean liquidity pool below short-term higher lows.
4. Fair Value Gaps (FVGs):
A Bullish FVG is seen mid-chart, where price was rapidly driven up, leaving a gap—price later returned to this zone, respected it, and pushed higher again.
This is a strong sign of institutional entry and provides excellent long entries.
5. Trend Confirmation:
BOS + CHoCH + Higher Lows = Bullish Bias.
Each low is forming higher than the previous, with strong rejections from demand zones.
6. Entry & Target Insight:
Entry Point: After price reacted from support and printed another Higher Low.
Target: Currently price is targeting $3,350 (short-term retracement or pullback target).
This target is likely an internal liquidity sweep before potential continuation to retest the resistance zone again.
7. Educational Takeaways:
Market Structure is King: Observe BOS/CHoCH for directional bias.
Liquidity Matters: Understand where liquidity is resting—price seeks it.
FVG as Entry Tool: Fair Value Gaps provide high-probability trade setups when aligned with structure.
Patience at Key Zones: Wait for confirmations at resistance/support rather than impulsive trades.
✅ Summary:
Bias: Bullish, until structure breaks.
Short-Term Target: $3,350 (as per the chart).
Long-Term View: If price maintains higher lows, potential revisit to the resistance zone ($3,420–$3,460) is likely.
Invalidation Level: Break and close below strong support ($3,260) would shift bias.

"Gold on Fire! Smart Money Bulls Aiming for Final Target🟡 "Gold on Fire! Smart Money Bulls Aiming for Final Target
Overview:
The XAUUSD chart presents a clear smart money structure, showing a bullish recovery from a strong demand zone and a current move toward a significant supply (resistance) area.
🔍 Key Technical Highlights:
Strong Support Zone
The price reacted powerfully from the well-marked strong support zone (~3,260), aligned with a previous Bullish Fair Value Gap (FVG) and BOS (Break of Structure), confirming bullish intent.
Bullish Market Structure
A clean CHoCH (Change of Character) confirmed the end of the previous bearish leg.
Multiple BOS followed, solidifying the bullish shift in momentum.
Liquidity Grab & Price Expansion
Price swept equal lows (EQL) and mitigated bullish FVG, collecting sell-side liquidity before reversing.
The breakout pushed toward the current level of ~3,380, targeting the Buy-Side Liquidity zone and resistance.
Resistance & Fair Value Gap
The final target is aligned at 3,427.83, situated inside a high-probability bearish FVG and resistance zone.
This area previously rejected price (noted with the red circle), making it a critical supply zone.
Partial Target Hit
Price has already achieved half of the projected move, indicating bullish strength and proper SMC execution.
The current consolidation near the mid-level suggests accumulation or re-accumulation before a final push toward the target.
📈 Educational Notes:
Fair Value Gaps (FVG) highlight inefficiencies in price delivery. These zones often act as magnets for price and reversal points, as seen here.
Break of Structure (BOS) and Change of Character (CHoCH) are crucial for identifying trend shifts. This chart reflects a textbook bullish transition.
Liquidity concepts (EQL, Buy-Side) emphasize institutional behavior. Price often hunts liquidity before moving to new highs or lows.
✅ Conclusion:
XAUUSD is playing out a well-structured bullish smart money setup, with price currently in mid-path toward the final target. Traders should monitor reactions at the 3,427 resistance zone, which will be critical for potential reversal or continuation scenarios.

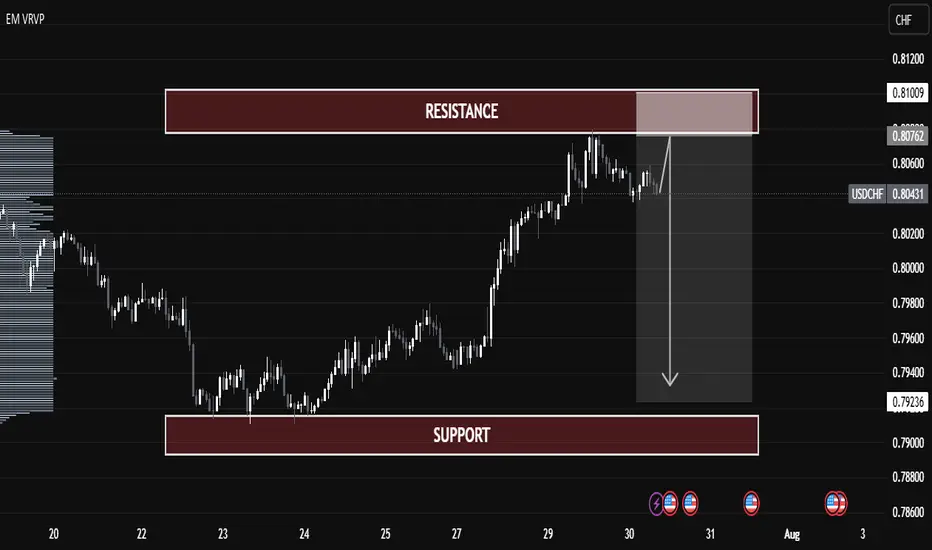
USDCHF Technical Analysis – Potential Rejection from Resistance USDCHF Technical Analysis – Potential Rejection from Resistance
🔍 Chart Overview:
Current Price: 0.80456
Resistance Zone: 0.80760 – 0.81009
Support Zone: 0.79000 – 0.79236
Price Action: The pair has rallied into a strong resistance zone but is showing signs of exhaustion.
📌 Key Observations:
Volume Profile Insight:
Price has entered a low-volume area near resistance, indicating potential weakness in demand above 0.80800.
Resistance Rejection:
Price tested the 0.80760–0.81009 resistance range and failed to break through decisively.
A potential fake breakout or bull trap could be forming.
Bearish Projection:
If price confirms rejection from resistance, we may see a drop toward the support zone (0.79000 – 0.79236).
This would complete a classic resistance-to-support rotation.
Bearish Confirmation:
A bearish candle formation or break below 0.80350 can trigger short entries.
Ideal risk-reward favors a short setup here.
📉 Trade Plan (Educational Purpose Only):
Entry Zone: 0.80750 – 0.80950
Stop Loss: Above 0.81100
Take Profit Target: 0.79250
Risk-Reward: Approx. 1:2.5
🔻 Summary:
USDCHF is trading near a major resistance zone with weak bullish momentum. If confirmed, a sharp reversal toward support is expected, making this a potentially strong short opportunity.
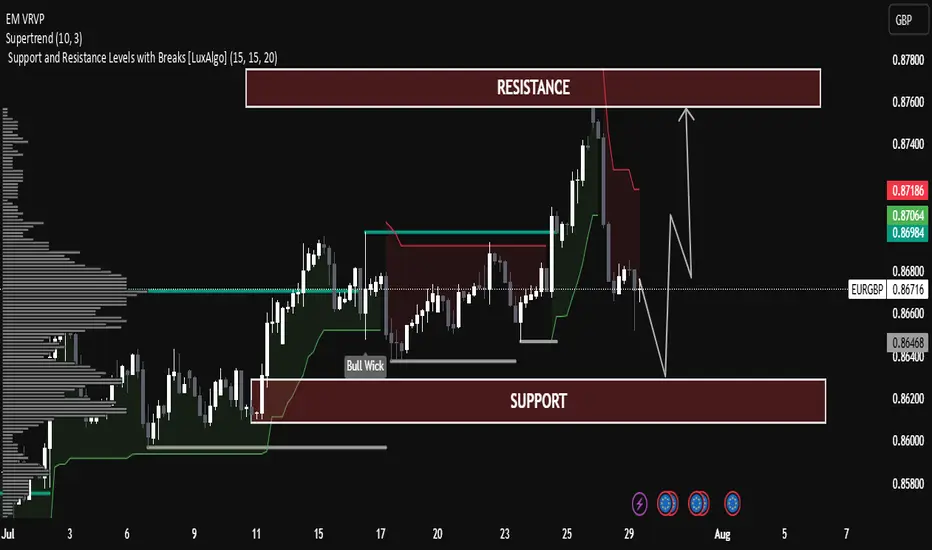
EUR/GBP Technical Analysis – Range-Bound Structure EUR/GBP Technical Analysis – Range-Bound Structure with Potential Rebound
The pair is currently trading within a well-defined horizontal channel between:
Support Zone: 0.86400 – 0.86200
Resistance Zone: 0.87800 – 0.87600
Price is currently near the mid-level (0.86756), showing consolidation after a rejection from resistance.
Supertrend Indicator:
The Supertrend (10,3) is currently bearish (red line above the price), indicating short-term downward pressure.
Price recently broke below the Supertrend line near the highs, suggesting a correction is underway.
Volume Profile (Left Side):
Significant volume has been transacted around the current market range (Point of Control).
This indicates strong interest and fair value, often leading to sideways movement before the next breakout.
Bull Wick Highlight (Mid-July):
Indicates buying pressure from lower levels, acting as historical demand near 0.86400.
🔄 Price Projection & Scenario Planning:
✅ Scenario A: Bullish Rejection from Support
If price retests the support zone (0.86400 – 0.86200) and forms a bullish rejection (e.g., pin bar or engulfing), a bounce is likely.
Target: Resistance zone 0.87600 – 0.87800
Confirmation: Bullish candle + break of 0.86900 resistance.
❌ Scenario B: Bearish Breakout Below Support
A break and close below 0.86200 may trigger a deeper correction.
Next possible downside target: 0.85800
Volume drop and strong red candles would support this.
🔧 Technical Summary:
Indicator Status
Structure Sideways / Range-bound
Supertrend Bearish (Short-term)
Support Zone 0.86200 – 0.86400
Resistance Zone 0.87600 – 0.87800
Bias Neutral-to-Bullish (above support)
🧠 Educational Note:
This chart is a great example of range trading—where traders look to buy near support and sell near resistance, especially when there is no strong trend. Patience and confirmation signals (like wick rejections or volume spikes) are key in such setups.
USD/JPY Chart Analysis (Educational Breakdown)📊USD/JPY Chart Analysis (Educational Breakdown)
🗓 Date: July 28, 2025
⏰ Timeframe: 2H (2-Hour Candles)
🧠 Concepts: Liquidity | Fair Value Gap | Order Block | Structure | Support/Resistance
⸻
1. Market Structure Overview
• The pair has been bullish, making higher highs and higher lows.
• Recently, price tapped into a resistance zone (~148.40–149.00) and sharply rejected, suggesting a potential short-term reversal.
• The price may now aim to sweep liquidity below support before a possible rebound.
⸻
2. Key Levels
🟥 Resistance Zone (148.50–149.00)
• Marked by a previous supply zone where sellers stepped in aggressively.
• Current Bearish Order Block sits just below this resistance, confirming institutional interest in selling this level.
🟫 Bearish Order Block
• Last bullish candle before sharp drop acts as a bearish order block (around 148.30–148.50).
• This is a high-probability sell-side reaction area — ideal for liquidity grabs and reversals.
🟦 Fair Value Gap (FVG)
• Between mid-17th–18th July, an imbalance was left after strong bullish momentum.
• Price returned to this zone, partially filled the gap, and then dropped again — confirming its importance.
🟥 Support Zone (145.80–146.30)
• Long-standing demand area where buyers previously stepped in.
• This area aligns closely with sell-side liquidity (SSL).
⸻
3. Liquidity Zones
🔵 Buy-Side Liquidity (BSL) – Above resistance (149.00+)
• Stop-loss clusters above previous swing highs.
• Liquidity for institutional sell positions.
🟣 Sell-Side Liquidity (SSL) – Below 146.00
• Positioned right under support.
• Ideal liquidity target for smart money to trigger stop hunts and fill positions before reversing.

EURUSD Analysis : Rejection at Demand – Institutional Buy Setup🔍 Technical Storyline – What the Chart Tells Us:
🔸 1. Previous Bearish Structure – Descending Channel:
Price has been moving within a well-respected bearish channel, signifying structured sell-side liquidity control.
This channel served as a trap zone, where retail sellers were induced while institutions accumulated buy-side positions below the range.
The controlled movement inside the channel ended with a breakout to the upside, signaling a disruption in bearish control.
🔸 2. QFL Zone Formation – Manipulation & Liquidity Grab:
QFL (Quasimodo Failure Level) is evident in two phases here:
The first QFL acts as a reaction point where the market dropped to test demand and rallied aggressively.
The second QFL near the highs shows price swept previous liquidity before dumping, hinting at institutional profit-taking and possible redistribution into discount areas.
🔸 3. Central Reversal Zone (CRZ):
Price reversed sharply from this CRZ, which acted as a major supply level. The CRZ marks the top of the manipulation range.
This was a liquidity sweep targeting trapped long positions that entered too late at the highs.
🔸 4. Demand Revisit + Positive Rejection Pattern (Current Phase):
Price has now reached the MMC-validated demand zone, which previously launched a strong bullish move.
The long lower wick in the latest candle shows buyer absorption, suggesting early signs of a Positive Reversal Pattern.
This area is marked with high probability for bullish continuation, as it aligns with both technical support and smart money logic.
💡 Trading Plan & Market Mindset:
🔸 📈 Bullish Scenario (High-Probability Play):
Wait for bullish confirmation, such as:
Bullish engulfing on 1H/4H
Break of minor intraday structure (e.g., break of internal LH)
Strong volume surge from the zone
Entry zone: Within the demand block – 1.15500 to 1.15750
Stop-loss: Just below the demand zone (1.15250)
Target 1 (TP1): 1.16500 – minor intraday resistance
Target 2 (TP2): 1.17500–1.18000 – retest of QFL high and Central Reversal Zone
🔸 ❌ Bearish Invalidator:
A 4H candle close below 1.15250 would break the demand zone structure.
Invalidation of MMC reversal – move toward deeper liquidity (1.14500–1.14800)
🧠 Trader’s Psychology & Institutional Mindset:
Institutions often induce price spikes to trap both buyers and sellers.
This entire structure reflects classic accumulation → manipulation → distribution → reaccumulation.
The retest of the original demand zone allows institutions to re-enter at discount before pushing price back toward the highs.
“In MMC, patterns are not just shapes – they are footprints of institutional intent.”
