Gold After Liquidity Grab – What’s Next?XAUUSD (Gold) shows a clear sell-side liquidity sweep, followed by stabilization and early signs of bullish market structure. The recent decline appears corrective, not a trend reversal, as price quickly recovered and started forming higher lows.
Gold is now approaching a key resistance zone, where a temporary pullback is expected. A retracement into the demand area around 4600–4650 could attract fresh buying interest and act as a launch point for the next bullish move.
If demand holds, price may expand toward buy-side liquidity above previous highs near 5260, completing a classic liquidity-driven continuation setup. This scenario aligns with smart money behavior, where price revisits demand before a strong impulse.
Outlook: Bullish continuation after pullback
Key Levels: Demand support below, liquidity target above
Risk Note: Wait for bullish confirmation before entering
Forexmarket

GBP/USD Bullish Scenario with Risk-Defined Parameters🇬🇧 👑 GBP/USD: "THE CABLE" – Bullish Liquidity Hunt & The Thief Strategy 👑 🇺🇸
Welcome, Ladies & Gentlemen (the Thief OG's). We are tracking the British Pound as it navigates the shark-infested waters of the 1.3500-1.3600 demand zone. While the "Police Force" (major resistance) is watching, we are looking to sneak in, grab the liquidity, and vanish before the sirens go off! 🚨💸
🕵️♂️ THE ENTRY BLUEPRINT: "THE THIEF LIMIT LAYERS"
Don't rush the gates! We use a staggered Limit Layer Entry to catch the best possible average price while the market makers try to shake us out.
Entry Layer 1: 1.36000 🎯
Entry Layer 2: 1.35800 🎯
Entry Layer 3: 1.35600 🎯
Entry Layer 4: 1.35400 🎯 (The Deep Snatch)
💰 THE GETAWAY PLAN (EXIT LEVELS)
The "Police Force" is setting up a trap at the top. We stay one step ahead. 🏃💨
TP1: 1.37200 — First Liquidity Grab Completed. (Secure 50% and move SL to BE). 🏦
TP2: 1.38400 — Final Liquidity Sweep — Exit Complete. (The heist is over, leave no trace). 🏁
🛑 THE PROTECTION: "THIEF STOP LOSS"
SL: 1.34800 — (The "Caught" Zone). 🚔
Note: This is my personal risk level. As a Thief OG, you choose your own exit. Your money, your risk, your reward. Don't let the market catch you sleeping!
📊 TECHNICAL VIBE & MARKET CORRELATION
To succeed, we watch the shadows. Watch these related pairs for confirmation:
FX:EURUSD (The Partner In Crime): If Fiber breaks its 1.1840 resistance, the Cable will fly. 🚀
TVC:DXY (The Enemy): If the Dollar Index drops below 103.50, our Bullish heist is "Green Light." 🟢
OANDA:XAUUSD (The Gold Reserve): Inverse correlation is key. If Gold pumps toward $5,000, the USD is weakening, fueling our GBP long. 🪙
🌐 FUNDAMENTALS & ECONOMIC HEAT MAP (FEB 2026)
The macro climate is shifting. Here is why the "Cable" is ready for a spring:
BoE Stance: The Bank of England recently held rates at 3.75%. While some see a "Dovish" tone, the cooling labor market actually makes the Pound a prime candidate for a "relief rally" as inflation stabilizes toward 2%. 📈
The Trump Factor: Recent tariff threats on European trade have caused volatility, but the market is pricing this in. We are looking for the "Buy the Rumor, Sell the News" reversal. 📰
US Data Watch: Keep your eyes on the upcoming US CPI and Jobless Claims. A cooling US economy means a weaker Dollar, giving us the perfect window to strike. 🦅
🧠 THIEF TRADER MOTIVATION
"A professional trader doesn't try to predict the wind; they just adjust the sails and steal the profits when the wind blows." 🌬️⛵
Stay Sharp: Discipline is the bridge between a heist and a paycheck.
Stay Humble: The market is the house; we are just here to take our share.
Stay Profitable: Get in, get paid, get out.
Happy Hunting, OGs! 🥂✨

XAUUSD (1H) – Short-Term Structure ReadPrice has shifted bullish after a clear market structure break (BOS) and strong impulsive move. The recent pullback is reacting around a refined demand zone, where price previously left the area with imbalance.
At the current level, price is holding above demand with no strong supply candle, suggesting sellers are not in control yet. Consolidation here may indicate absorption rather than distribution.
🔎 Key observations:
Higher highs and higher lows remain intact
Reaction from a previously respected demand area
Lack of bearish follow-through near the zone
📌 Expectation:
As long as price holds above this demand, continuation toward the upside remains a valid scenario. A clean break below the zone would invalidate this view and shift focus to lower liquidity areas.
⚠️ This analysis is for educational purposes only, based purely on price action and structure.

EUR/USD Calm Before the Next Big Move?The Euro’s setting up for what could be a textbook correction before the next drive up.
The question now: does 1.14 hold… or do we break deeper? 👇
Here’s the simple map:
🔻 Correction zone: Price is cooling off toward 1.14.
⚡ If 1.14 holds, we could see a clean bounce and a new leg higher.
⚠️ If it breaks, then eyes on 1.12, 1.10, and in a worst-case dip, 1.08–1.07.
So basically:
👉 Hold 1.14 = bounce potential
👉 Break 1.14 = deeper pullback ahead
Momentum is slowing; this is where smart traders are patient, not panicked.
If you’re watching EUR/USD and unsure where the best risk-to-reward setups might form, DM me; I’ll walk you through how I’m mapping my key levels and what I’m waiting for before jumping in.
Mindbloome Exchange

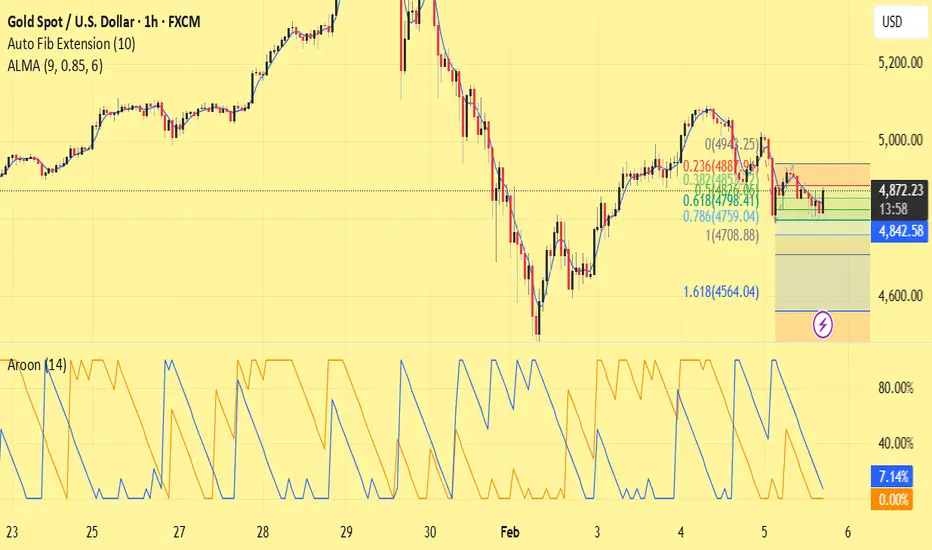
Fibonacci Resistance Caps the Recovery | Consolidation PhaseChart Analysis
Market Structure
After a sharp sell-off, Gold staged a technical rebound but is now trading in a sideways to corrective phase below a key Fibonacci resistance zone. The structure suggests a corrective pullback within a broader bearish swing, rather than the start of a new uptrend.
Technical Confluence
Fibonacci Retracement: The 0.236 – 0.382 zone is acting as resistance and limiting further upside.
ALMA (9): Price is hovering around the moving average, indicating weak momentum and indecision.
Auto Fib Extension: The 1.618 extension remains a potential downside target if selling pressure resumes.
Aroon (14): Weak Aroon Up and relatively stronger Aroon Down point to fading bullish strength.
Price Action
Repeated upper wicks and small-bodied candles near resistance signal supply pressure. Buyers have so far failed to achieve a clean breakout above the resistance area.
Trade Idea
Bias: Neutral to Bearish
Sell Zone: Rejection from the Fibonacci resistance zone
Targets:
First target: Recent swing low
Extended targets: 0.786 retracement / 1.618 extension
Invalidation: A clear and sustained close above the 0.382 Fibonacci level
Conclusion
As long as XAUUSD remains below the Fibonacci resistance and momentum stays weak, the current price action is best viewed as consolidation ahead of a potential downside continuation.
Always manage risk and wait for confirmation.
XAUUSD (Gold) – H1 Technical AnalysisGold is currently trading within a key intraday structure on the H1 timeframe. Price has recently shown a bullish reaction from the H1 Order Block (OB), indicating short-term demand, but overall structure still favors sell-side liquidity above.
Market Structure
Price previously formed a Break of Structure (BOS) to the downside.
Current bullish move looks corrective, not a full trend reversal.
Multiple Buy-Side Liquidity (BSL) levels remain resting above current price.
Key Zones
🔴 Premium Supply Zone (H1 FVG + BPR)
This zone aligns with previous imbalance and premium pricing.
Ideal area to watch for rejection and bearish confirmation.
🔵 H1 Order Block (Demand)
Price has already reacted from this zone, suggesting temporary support.
Expectation
Price may push higher to grab buy-side liquidity.
If bearish confirmation appears inside the premium supply zone, price could continue downward toward lower liquidity levels.
As long as price remains below the premium zone, sell-side bias remains valid.
Notes
Wait for confirmation (rejection, bearish candles, or structure shift) before taking any position.
This analysis is based purely on price action, liquidity, and market structure.
Disclaimer
This idea is for educational purposes only and does not constitute financial advice. Always manage risk and trade according to your own plan.

EURUSD | H4 – Technical PerspectiveEURUSD is currently trading within a broader bearish structure. The recent move into the highlighted zone appears to be a liquidity sweep, followed by a reaction from a higher-timeframe Fair Value Gap (H4 FVG).
Price remains below key resistance, and the latest upside movement looks corrective rather than impulsive. From a structural point of view, continuation toward lower liquidity remains a valid scenario unless price shows strong acceptance above recent highs.
This analysis is based purely on price action, market structure, and liquidity behavior and is shared for educational purposes only.

XAUUSD | H4 Market Structure ObservationPrice is currently trading between two significant H4 Fair Value Gap (FVG) zones.
The upper zone may act as a potential resistance area, while the lower zone aligns with a possible demand reaction area.
Market behavior near these zones will provide clarity on the next directional move.
This analysis is shared for educational and observational purposes only.

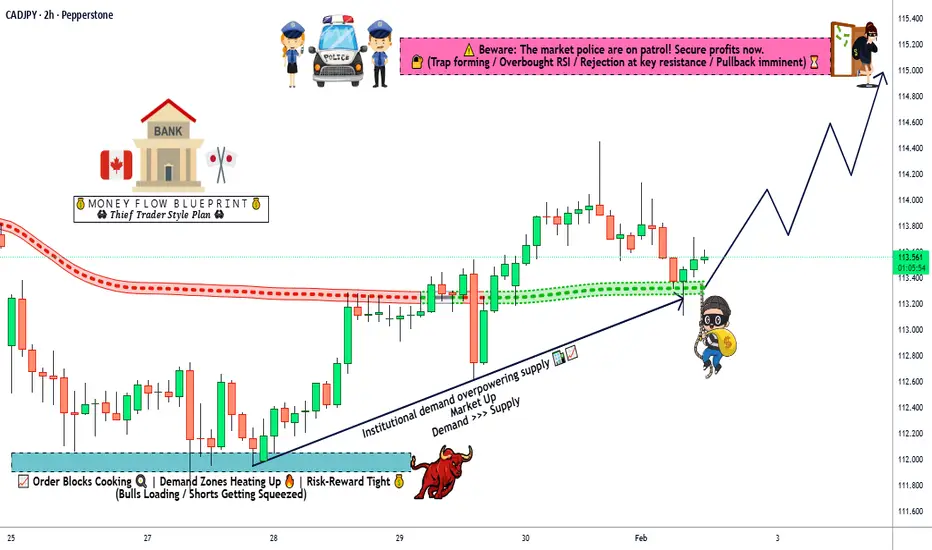
CAD/JPY Strength Emerges — Trend Traders Watch!🚀 CAD/JPY BULLISH SWING/DAY TRADE OPPORTUNITY 📈
Professional Technical Setup with Risk Management Guide
📊 ASSET: Canadian Dollar vs Japanese Yen (CAD/JPY)
Market: Forex | Category: Major Currency Pair | Liquidity: High
Current Price (Feb 02, 2026): 113.69 JPY per CAD | Volatility: Moderate
🎯 TRADE SETUP: BULLISH BREAKOUT CONFIRMATION
✅ Technical Analysis: Moving Average Breakout & Retest Strategy
This bullish setup is confirmed through:
Price Action: Clear bullish structure with higher highs and higher lows formation
Moving Average Breakout: Price has broken above key moving averages (20-EMA, 50-SMA confirmation)
Retest Zone: Current consolidation suggests healthy pullback before continuation
Volume Analysis: Breakout accompanied by volume expansion confirms institutional buying pressure
Momentum Indicators: RSI showing bullish divergence with potential energy for upside movement
💰 ENTRY STRATEGY: "THIEF LAYER" MULTIPLE LIMIT ORDERS
Professional Layering Entry Technique 🎲
Place limit buy orders at these zones (Adjust based on your risk tolerance):
🔹 Layer 1: 113.000 JPY (Initial 33% position)
🔹 Layer 2: 113.250 JPY (Mid-zone 33% accumulation)
🔹 Layer 3: 113.500 JPY (Confirmation 20% entry)
🔹 Layer 4: 113.750 JPY (Final dip 14% buying)
🔹 Layer 5: 114.000 JPY (Optional aggressive 0-10% entry)
Pro Tip: Use ANY price within these zones based on YOUR risk-reward preference. Scale smart, don't chase! ⚡
🎪 TARGET ZONES: RESISTANCE BREAKOUT LEVELS
Primary Target: 115.000 JPY ✨
Reasoning: This level represents strong resistance confluence with previous swing highs
Risk Factor: "Police Force" resistance zone detected—expect strong sellers at this level
Overbought Warning: RSI may enter overbought territory (70+) near this target
Trap Alert: ⚠️ Sharp rejection possible—be prepared to take partial profits and lock in gains before reaching exactly 115.000
Secondary Target Zones:
114.250 JPY (Minor resistance for trend confirmation)
114.500 JPY (Intermediate take-profit zone)
115.000+ JPY (Extended upside IF momentum sustains with volume)
🎯 PROFESSIONAL PROFIT-TAKING STRATEGY:
Close 30-40% at first minor resistance (114.250)
Move stop-loss to breakeven after initial profit
Trail remaining position with 20-pip stop using moving average
Lock remaining gains at 115.000 or when RSI signals overbought exhaustion
🛑 STOP LOSS: PROFESSIONAL RISK MANAGEMENT
Hard Stop Loss: 112.500 JPY
Distance: ~115 pips below entry (manageable risk)
Justification: This level represents clear support breakdown + technical invalidation
Risk-Reward Ratio: Excellent 1:2.5 to 1:3.5 depending on entry zone
Psychological Level: Below this = trend reversal signal
⚡ STRICT DISCLAIMER - RISK MANAGEMENT CRITICAL:
Dear Thief Trading OGs 🎩: This is YOUR trade, YOUR account, YOUR decision! We provide the technical framework, but final entry/stop loss placement depends entirely on YOUR risk tolerance and position size. NEVER risk more than 2-3% of your account on a single trade. Adjust SL and TP based on your broker's spreads, your account size, and market conditions. Take responsibility for your trades! 💯
📈 RELATED PAIRS TO WATCH (CORRELATION ANALYSIS)
Positively Correlated Pairs 🔗 (Move in same direction):
AUD/JPY - Similar commodity-linked currency vs JPY correlation (+0.82)
Watch: If AUD/JPY fails, CAD/JPY may struggle too
Key Level: 88.50-89.00 resistance zone
NZD/JPY - Risk sentiment indicator (+0.78)
Key Level: 79.50-80.00 for confirmation bias
USD/JPY - Broader dollar sentiment (+0.65)
Current Level: 158-160 zone resistance (from previous search)
If USD/JPY rallies, CAD/JPY may lag—watch this closely!
Inversely Correlated Pairs 🔄 (Diversification):
USD/CAD - Direct inverse relationship (-0.95)
If USD/CAD falls → CAD/JPY likely rises (bullish confirmation!)
Current Level: Watch for breakdown below 1.3800
JPY/USD (USD/JPY inverse) - Yen strength gauge (-0.90)
Weakness in this = strength in your pair
Key Monitoring Pairs - Risk Context:
EUR/JPY - Risk appetite barometer
GBP/JPY - Carry trade activity indicator
📅 REAL-TIME ECONOMIC CALENDAR & FUNDAMENTAL FACTORS
🇨🇦 CANADIAN ECONOMY - Current Status (Feb 2026)
Bank of Canada (BoC) Interest Rate Environment:
Current Policy Rate: 2.25% (Held as of Jan 28, 2026)
BoC Stance: ON HOLD throughout 2026 (97.9% probability = NO RATE CHANGE)
Expected GDP Growth: 1.1% (2026) vs 1.5% (2027) - MODEST EXPANSION
Inflation Target: Holding near 2% target (2.4% in December 2025 with base effects)
🔴 KEY RISK FOR CANADIAN DOLLAR:
⚠️ CUSMA Trade Agreement Review (Deadline: July 1, 2026) - THE DEFINING ISSUE OF 2026
Trump administration trade policy UNCERTAINTY = CAD weakness potential
U.S. protectionism = Economic headwinds for Canada
Market Impact: If trade negotiations worsen → CAD bearish pressure could materialize
Employment & Labor Market:
Unemployment Rate: 6.5% (DOWN from 7.1% in Sept) = Labor market improving
Wage Growth Forecast: Moderate growth expected—no runaway wage inflation
Job Market: Low-hire, low-fire dynamics = Stable but weak hiring
🟢 POSITIVE FACTORS FOR CAD:
✅ Consensus-beating employment reports (3 consecutive months)
✅ Q3 GDP data above expectations
✅ Rate hold signals policy stability—no more cuts expected
✅ Inflation moderating (helps currency stability)
Next BoC Decision: March 18, 2026 ⏰
🇯🇵 JAPANESE ECONOMY - Current Status (Feb 2026)
Bank of Japan (BoJ) Interest Rate Environment:
Current Policy Rate: 0.75% (Raised Dec 2025 - HIGHEST IN 30 YEARS)
BoJ Stance: HAWKISH - 8/9 vote to hold, 1 member wanted 1.0%
Rate Hike Outlook: Likely 1 MORE HIKE in 2026 (October base case, sooner if yen weakens)
Terminal Rate Target: Expected 1.25-1.75% by end of 2026/2027
Inflation Target: Monitoring 2% target closely
📊 INFLATION & WAGE GROWTH - THIEF TRADING GOLD!
Core CPI: 3.0% (sustained above 2% for 44+ consecutive months = structural change!)
Headline CPI: Expected to drop below 2% in H1 2026 (food subsidies + rice price easing)
Wage Growth: 5.25% in FY2025 → Expected to REMAIN STRONG into 2026
Shunto (Spring Wage Negotiations): Early 2026 = Critical event for BoJ's next move
Economic Growth Prospects:
FY2025 GDP Forecast: 0.9% (upgraded from 0.7%)
FY2026 GDP Forecast: 1.0% (upgraded from 0.7%) = Moderate growth confirmed
Business Sentiment: Tankan survey at 3-year highs for large manufacturers (15.0 score)
Private Consumption: RESILIENT despite price pressures
🟡 YEN WEAKNESS ISSUE - POLITICAL HEADACHE:
⚠️ Japanese officials increasingly concerned about yen depreciation
Weak JPY (near 158-160 vs USD) raises import costs → inflation pressure
Prime Minister Takaichi labeled excessive yen weakness as "major risk"
Potential Intervention Zone: BOJ prepared to defend 155-160 levels (sold $100bn in summer 2024)
Implication for CAD/JPY: BoJ's interest rate hikes SUPPORT yen recovery → could limit CAD/JPY upside
Government Support Measures:
✅ Record stimulus packages in place (electricity/gas subsidies, defense spending)
✅ Fiscal policy remains accommodative despite monetary tightening
✅ Corporate capital investment on moderate increasing trend
Next BoJ Decision: March 19, 2026 ⏰
🌍 CRITICAL UPCOMING EVENTS (February - April 2026)
🚨 THIEF TRADER'S CALENDAR - DO NOT MISS! 📢
🔴 Feb 8, 2026 → Japan Snap Election | Political uncertainty = JPY volatile
🟡 Feb-Mar 2026 → Spring Wage Negotiations (Shunto) | BoJ watching closely for inflation signals
🟢 March 18, 2026 → BoC Rate Decision | Expected HOLD - no surprises expected
🔴 March 19, 2026 → BoJ Rate Decision | CRITICAL - Watch for hawkish guidance (possible future hikes)
🟡 April 29, 2026 → BoC Monetary Policy Report | Inflation/growth assessments released
🔴 May-July 2026 → CUSMA Trade Negotiations Intensify | Trump tariff uncertainty = major CAD pressure
🚨 July 1, 2026 → CUSMA Trade Deal DEADLINE | Make or break for Canadian economy & CAD strength
⚡ TECHNICAL VOLATILITY INDICATORS
Thief Trader Technical Edge:
Average True Range (ATR): Moderate volatility = Ideal swing trade environment
Bollinger Band Width: Expanding = Trending market (bullish momentum sustainable)
MACD: Positive divergence = Momentum building upside
Ichimoku Cloud: Price above cloud = Bullish bias intact
Support & Resistance Confluence: Multiple technical barriers = Excellent risk management zones
💪 THIEF TRADER MOTIVATION & MINDSET QUOTES
"The market respects patience, not greed. Layer your entries, scale your targets, and control your destiny." 🎯
"A Thief doesn't rush the heist—perfect timing beats perfect prediction. Wait for YOUR setup, not any setup." ⏰
"Your stop loss is NOT a loss; it's the COST of being RIGHT on the next 10 trades. Respect risk management like you respect gravity." 🪨
"Trading CAD/JPY isn't about hunting 300 pips—it's about CONSISTENT 50-100 pip victories stacked together. That's wealth." 💰
"When the BoJ hikes and the BoC holds, the interest rate differential SHIFTS. Position accordingly, or get left behind." 🚀
"The P&L speaks louder than your ego. Take your profit at 114.50, celebrate your win, and wait for the next setup. That's professional trading." 👑
"In February 2026, uncertainty is the theme. Trade with SMALLER position sizes, NOT larger ones. Volatility ≠ Opportunity without discipline." ⚠️
📋 TRADE CHECKLIST BEFORE EXECUTION
Confirm price is at or near one of your layer entry zones
Check USD/JPY above 157 (yen weakness confirms CAD/JPY setup)
Verify no major economic news in next 2-4 hours
Position sizing: Maximum 2-3% of account risk
Stop loss set at 112.500 with hard exit discipline
Take profit targets clearly marked (30% at 114.25, 40% at 115.00, trail remainder)
Check BoC and BoJ rate decision calendar
Monitor CUSMA trade negotiations for macro risks
Confirm moving averages still pointing bullish (price above 20/50/200 SMAs)
Journal this trade - Record entry, exit, reason, and lessons learned
Chart Analysis Last Updated: February 2, 2026
Trading Style: Swing Trade / Day Trade (4H-Daily Timeframe Recommended)
Risk-Reward Profile: 1:2.5 to 1:3.5 (Excellent risk-adjusted setup)
🎩 Happy Trading, Thieves! Let's build wealth together through discipline and precision! 💎
XAUUSD H1 – Corrective Pullback Within Broader Bullish StructureGold (XAUUSD) on the 1-hour timeframe remains within a broader bullish structure, but price is currently undergoing a corrective phase. After reaching a major swing high, the market faced strong rejection from the descending red trendline, triggering a sharp pullback.
The recent decline respected the Fibonacci retracement zone, with price reacting strongly between the 0.618–0.786 levels, indicating active demand from buyers. This zone aligns with prior structure support, reinforcing its technical significance. The recovery from the lows shows higher lows, suggesting short-term bullish intent, though momentum is slowing near resistance.
Price is now trading below the descending trendline and near the upper Fibonacci retracement area, where sellers are showing interest. A clear break and hold above the trendline would open the door for a continuation toward the previous highs. Conversely, rejection from this area could lead to another retest of the mid or lower Fibonacci support levels.
The Aroon Oscillator is turning negative, signaling weakening bullish momentum and increasing risk of consolidation or a short-term pullback before the next directional move.
Key Levels to Watch:
Resistance: Descending trendline / recent swing high zone
Support: 0.618–0.786 Fibonacci retracement area
Bias: Neutral to cautiously bullish while above key support
This setup favors patience—waiting for either a confirmed breakout above resistance or a bullish reaction from support for higher-probability entries.

XAUUSD | M15 Technical ObservationFollowing a market structure shift, price is consolidating below a prior support zone that may now function as resistance.
An overhead imbalance area is also present, which could influence short-term price behavior.
This post is for chart study and educational discussion only.

Chart Analysis & Trading Idea (Gold / XAUUSD – 15 min)Price is in an overall bearish structure (lower highs & lower lows).
After a strong drop, price made a pullback into the marked upper demand / supply area (actually acting as resistance now).
The highlighted Demand Zone above has already been tested and rejected, showing selling pressure.
Current price action suggests weak bullish momentum and potential trend continuation to the downside.
Trading Idea:
Sell from the upper zone / resistance area if price shows rejection (bearish candle, wick, or structure break).
Targets:
First target: Lower demand zone
Extended target: Below the demand zone if momentum increases
Stop Loss:
Above the upper zone / recent high
Bias:
📉 Bearish – sell on pullback
If you want, I can also:

BTCUSD – Bearish Continuation After Range Breakdown (1H)Bitcoin was previously moving inside a clear consolidation range (highlighted in green). Price broke below the range support, triggering strong bearish momentum and confirming a bearish market structure shift.
Key Technical Levels
Range High / Supply Zone:
The upper red zone represents previous support that has now flipped into resistance.
Range Low / Demand Zone:
The lower red zone marks a key liquidity area where price may react.
Break & Retest:
Price retraced back into the broken support zone and faced strong rejection, validating the bearish bias.
Trade Idea
Bias: Bearish
Entry Area: Sell on pullback into resistance (around 81,500 – 82,500)
Target 1: Lower consolidation support (Target 1)
Target 2: Deeper downside continuation (Target 2)
Stop Loss: Below invalidation level (around 75,700)
Technical Confluence
Clear range breakdown
Strong impulsive bearish move
Lower highs forming on retracement
Support turned resistance confirmation
Outlook
As long as price stays below the broken range and supply zone, the bearish continuation scenario remains valid. Any retracement into resistance may offer high-probability short setups with favorable risk-to-reward.

XAUUSD (Gold) – Bearish Continuation After Channel BreakdownGold previously respected a well-defined ascending channel, showing a strong bullish trend. However, price broke decisively below the channel, signaling a trend shift from bullish to bearish. The breakdown was followed by strong bearish momentum, confirming seller dominance.
Key Technical Zones
Broken Support → Resistance:
The marked red zones are former support areas that have now turned into supply / resistance.
Rejection Confirmation:
Price retested these zones and faced strong bearish rejection, validating them as sell areas.
Trade Idea
Bias: Bearish
Entry Zone: Sell on pullback into resistance (around 4,980 – 5,100)
Target 1: Previous demand zone (Target 1)
Target 2: Lower support / continuation target (Target 2)
Stop Loss: Below the invalidation level (around 4,726)
Confluence Factors
Ascending channel breakdown
Lower highs and lower lows forming
Strong bearish impulse after retest
Clear risk-to-reward structure
Conclusion
As long as price remains below the broken channel and resistance zones, the bearish scenario remains valid. Any retracement into resistance may offer high-probability sell opportunities targeting lower liquidity zones.

EURUSD 1H – Demand Zone Rejection Setup EURUSD previously moved in a strong bullish channel, indicating healthy upward momentum. After reaching the channel high, price faced selling pressure and transitioned into a consolidation phase.
The marked demand zone is acting as a key resistance-turned-supply area. Price is currently reacting below this zone, forming a lower high structure, which suggests potential bearish continuation.
A rejection from the demand zone combined with the current structure opens the door for a pullback toward the lower support / target zone, highlighted on the chart.
Key Levels
Demand Zone: Upper red zone (sell pressure area)
Entry Area: Rejection below demand
Target: Lower red support zone
Trade Bias
Bias: Bearish below demand zone
Invalidation: Strong breakout and close above demand

XAUUSD Bullish Structure | Trendline + DemandGold is in a strong bullish trend (clean higher highs & higher lows).
Price respected the ascending trendline, showing buyers are in control.
The green zones mark demand / buy-on-dip areas where price previously reacted.
After a strong impulse up, price is doing a healthy pullback into demand.
The arrow up shows expectation of trend continuation toward the upper liquidity / target zone.
Trading Logic:
Bias: Bullish
Setup: Impulse → Pullback to demand + trendline → Continuation
Entry idea: Buy from the demand zone / trendline support
Invalidation: Clear break below the demand zone
Target: Previous highs and the upper green (premium) area

Neural Brain Diagnosis: EUR/USD Short (Forensic Analysis)The "Glass Box" Verdict: EUR/USD (1H)
Most indicators are black boxes. The Neural Brain tells you why it's taking the trade. Here is the forensic breakdown of the SELL signal on Euro.
📉 1. THE PHYSICS: Efficiency Score (0.34)
Status: Structured Grind
The Math: For every pip gained downside, the market travels ~3x the distance in chop ($0.002 Net / $0.007 Noise).
The Meaning: This isn't a crash; it's a "grind." Sellers are winning, but it is a fight. The structure is messy but valid.
🧠 2. THE MIND: Conviction (GAINING)
Status: Bearish Lock
Bias: BEARISH (Price < Cloud).
The Paradox: Despite the "Mixed" efficiency, the AI's conviction is GAINING. The math detects that this volatility is "persistent distribution," not indecision.
🎯 3. THE STRATEGY: TRACKING
Signal: SELL (100% Confidence)
Action: Press the Short. The AI determines the bearish momentum is statistically significant enough to override the noise.
Disclaimer: Educational analysis via CustomQuantLabs.

NZD/CAD Momentum Framework Signals Upside Risk🎯 NZD/CAD BREAKOUT SETUP | Moving Average Police Barricade Break! 💥
📊 Asset Overview
NZD/CAD - New Zealand Dollar vs Canadian Dollar
Forex Market | Day/Swing Trade Opportunity
🔥 THE THIEF'S MASTER PLAN
💎 Setup Type: Bullish Breakout Strategy
⏰ Timeframe: Day to Swing Trade
🎪 Current Price Zone: Pending order setup @ 0.82000
📈 ENTRY STRATEGY
🚀 Entry Point: ANY price level AFTER the Simple Moving Average (SMA) line breakout confirmation above 0.82000
Wait for the candle close above the barricade - patience pays, legends! 💪
🎯 PROFIT TARGET
💰 Target Price: 0.83000 (+100 pips potential)
⚠️ Why Exit Here? The Moving Average acts like a police barricade 🚧 - strong resistance zone + overbought conditions + potential bull trap + correction incoming = SMART EXIT STRATEGY
📢 Thief's Disclaimer: Dear Ladies & Gentleman (Thief OG's) 🎩 - I'm NOT recommending you set ONLY my TP. It's YOUR money, YOUR choice, YOUR rules! Make money, then TAKE money at your own risk! 💵✨
🛑 STOP LOSS
🔒 SL Level: 0.81000 (-100 pips risk)
⚡ Placement: ONLY after breakout confirmation - don't jump the gun!
📢 Thief's Disclaimer: Dear Ladies & Gentleman (Thief OG's) 🎩 - I'm NOT recommending you set ONLY my SL. Control your own destiny! Risk what you can afford, protect what you've earned! 🛡️
🌐 CORRELATED PAIRS TO WATCH
💵 NZD Pairs (Kiwi Power)
NZD/USD 🇳🇿🇺🇸 - Watch for USD strength/weakness impact
AUD/NZD 🇦🇺🇳🇿 - Trans-Tasman correlation (commodity currencies move together)
NZD/JPY 🇳🇿🇯🇵 - Risk-on/risk-off sentiment gauge
🍁 CAD Pairs (Loonie Watch)
USD/CAD 🇺🇸🇨🇦 - Inverse correlation to NZD/CAD
CAD/JPY 🇨🇦🇯🇵 - Commodity currency + oil price sensitivity
EUR/CAD 🇪🇺🇨🇦 - European economic impact on CAD
🔗 Correlation Key Points
✅ NZD & AUD = Commodity currency brothers (dairy, metals, agriculture)
✅ CAD = Oil-sensitive currency (crude oil prices = major driver)
✅ Risk Appetite = Both NZD & CAD rise when markets feel good, fall when fear strikes
✅ When USD/CAD falls → CAD strengthens → NZD/CAD may struggle
✅ When NZD/USD rises → Kiwi strengthens → NZD/CAD gets bullish fuel 🚀
📰 FUNDAMENTAL & ECONOMIC FACTORS
🌍 NEW ZEALAND FUNDAMENTALS (KIWI POWER 🥝)
💪 BULLISH FACTORS:
NZD has strengthened 2.77% over the past month and is up 5.32% over the last 12 months
Annual inflation rose to 3.1% in Q4 2024, above forecasts of 3% and exceeding the Reserve Bank's target band
Markets now price in an 80% chance of a rate hike by September, with roughly a 50% chance of a move in July
Manufacturing, services and tourism sectors look strong, pointing to economic recovery
RBNZ Hawkish Tilt: Easing phase appears over - potential rate hikes incoming! 🚀
GDP figures represent an upside surprise to the RBNZ's forecasts and imply less spare capacity in the economy than anticipated
📅 UPCOMING KEY DATA:
Building Permits: Already released (Nov data showed +2.8% MoM)
National Election: November 7, 2026 (political uncertainty watch 👀)
Next RBNZ Meeting: Monitor for hawkish signals on rate hikes
🥛 COMMODITY BOOST:
GlobalDairyTrade auction saw the overall index rise 6.3%, led by a 7.2% rise in whole milk powder prices
Dairy = New Zealand's #1 export → Price strength supports NZD 💎
🍁 CANADIAN FUNDAMENTALS (LOONIE WATCH 🇨🇦)
⚠️ BEARISH PRESSURES:
OIL PRICE WEAKNESS: Forecasts predict little change in world oil prices for 2026, with downward pressure due to global supply glut
VENEZUELAN COMPETITION: Western Canada Select traded at the widest discount compared to benchmark prices in 18 months following political upheaval in Venezuela
TARIFF THREATS: Trump threatened 100% tariffs on Canada (though later clarified by PM Carney)
Oil and gas drilling activity is falling in Western Canada and is expected to slide further in 2026
WTI Crude: Currently hovering around $60/barrel (down from $80+ in January 2025) 📉
⚡ BULLISH FACTORS:
Natural gas prices expected to strengthen to $3.30 per mmBTU this year from roughly $1.70 last year due to LNG Canada export terminal ramp-up
Strong employment data
Alberta & resource-rich provinces showing economic strength
🔑 KEY INSIGHT: CAD is HEAVILY oil-dependent. When oil struggles → CAD struggles → NZD/CAD RISES! 🚀
🎯 THE FUNDAMENTAL VERDICT
WHY THIS BULLISH SETUP MAKES SENSE:
✅ NZD = STRONG (Inflation rising, RBNZ turning hawkish, rate hike expectations, dairy prices surging)
✅ CAD = WEAK (Oil price struggles, Venezuelan competition, drilling activity falling)
✅ DIVERGENCE = OPPORTUNITY 💰
⚠️ RISK FACTORS TO MONITOR:
Trump tariff announcements (could strengthen USD and weaken both currencies)
Middle East tensions (could spike oil prices → help CAD)
China economic data (affects both commodity currencies)
RBNZ policy meeting surprises
🎨 THIEF TRADER STYLE WISHES & MOTIVATION 💎
"In the markets, patience isn't just a virtue - it's your edge. The best thieves don't rush through the vault, they wait for the perfect moment." 🏆
💪 REMEMBER OG's:
The market rewards discipline, not desperation
Your stop loss is your bodyguard - respect it! 🛡️
Profits are made in the waiting, not the wanting ⏳
Trade what you SEE, not what you THINK 👁️
🔥 THIEF TRADER COMMANDMENTS:
Plan your heist (trade) ✅
Execute with precision 🎯
Escape with your loot (profits) 💰
Live to steal another day 🏃♂️
✨ FINAL WISDOM:
"The market is an ATM for the disciplined, a casino for the desperate. Which one are you?" 🎰💸
📊 TRADE SAFE, THIEF STYLE! 💎🙌
Drop a 👍 if you're watching this setup!
Comment 💬 your targets below!
Follow for more Thief OG setups! 🔥

EUR/CAD | Bullish Breakout & Momentum Continuation Setup💶🍁 EUR/CAD "EURO vs CANADIAN DOLLAR" Premium Forex Trading Strategy 🔥
🎯 Day Trading & Swing Trading Opportunity Guide (Jan 2026 - Live Market Data)
📊 CURRENT LIVE MARKET DATA 📈
Current Price: 1.6134 USD/CAD (+0.29%) ⬆️
52-Week High: 1.6466 | 52-Week Low**: 1.4688
Weekly Range: 1.61464 - 1.62974 (As of Jan 26, 2026)
Volatility Rating: 0.23% (Lower volatility = Cleaner moves!) ✅
Market Sentiment: STRONG BUY (Technical Rating) 💪
🚀 BULLISH TRADING PLAN 🚀
📍 ENTRY POINT - Your Green Light to GO! 🟢
Entry Zone: After Resistance Breakout @ 1.63200 CAD
This level acts as a strong psychological barrier
Confirmation = Candle close above 1.6320
Wait for pullback + continuation pattern for safer entry
Risk/Reward Setup = OPTIMAL ✨
🎯 PRIMARY TARGET (Conservative) 🎯
Target Level 1: 1.63700 CAD
Why: Police barricade resistance + overbought conditions detected
Caution: Watch for profit-taking & potential correction trap ⚠️
Action: Consider taking 50% profit here, move SL to breakeven
Reward: +50 pips per lot (Clean & Quick)
🔥 EXTENDED TARGET (Aggressive) 🔥
Target Level 2: 1.64200 - 1.64500 CAD
Requires sustained bullish momentum
Technical resistance weakening
Only chase if daily candle structure confirms
Excellent for swing traders (2-3 day holds)
🛑 STOP LOSS - Protect Your Capital! 🛡️
SL Placement: 1.62700 CAD
Placed below support confirmation level
Provides 50-pips breathing room for volatility
Risk Management = PRIORITY #1
Max Risk: Keep to 1% of your trading capital per trade
📰 FUNDAMENTAL FACTORS TO WATCH 🔔 (Real Data - Jan 2026)
🏦 EUROPEAN CENTRAL BANK (ECB) STANCE 🇪🇺
Current Rate Status:
Main Refinancing Rate: 2.15% ✅ (Unchanged since July 2025)
Deposit Facility Rate: 2.00% ✅
ECB Holding Pattern: Data-Dependent Approach
Key ECB Fundamentals:
Inflation Projection 2026: 1.9% (Below 2% target) 📉
Economic Growth 2026: 1.2% (Slower than 2025's 1.4%)
Services Inflation: Sticky at 3.8-3.9% YoY ⚠️
Wage Growth: Expected to stabilize below 3% by end-2026
ECB Outlook: "Good place" = No hurry for rate changes (Dec 2025)
Impact on EUR:
EUR strength supported by stable rates
No rate cuts expected in 2026 = Euro floor protection 🏛️
Strong euro could dampen inflation further
Market odds of hike by end-2026 = Only ~30%
🍁 BANK OF CANADA (BoC) POSITION 🇨🇦
Current Rate Status:
Overnight Rate Target: 2.25% (Paused cutting cycle)
Rate Decision Upcoming: January 28, 2026 🗓️
Key BoC Fundamentals:
Rate Trajectory 2026: HOLD expected all year (75% economist consensus)
Economic Growth: 1.2-1.8% expected (Gradual pickup from 1.7% in 2025)
Inflation: Hovering at 2.0% target (Well-controlled) ✅
Labour Market: Mixed signals - Job gains in Dec but employment stalling
Unemployment Rate: 6.5% (Lower end, but caution warranted)
Major Risk Factor: USMCA Trade Review (July 2026) ⚡ = BIGGEST HEADWIND
Impact on CAD:
Weaker bias due to trade uncertainty 📍
Rate pause = CAD limited upside potential
Tariff uncertainty = CAD defensive positioning
Cut odds if economy falters = CAD depreciation signal
💰 CORRELATED PAIRS TO MONITOR 📊
Pair 1: OANDA:USDCAD 🔗
Inverse Relationship: When USD/CAD rises = EUR/CAD often falls
Current Level: ~1.38 (CAD weakness = EUR/CAD support)
Watch: If USD/CAD breaks 1.3900 = EUR/CAD bullish acceleration 🚀
Pair 2: FX:EURUSD 🔗
Direct Correlation: Strong positive = EUR/CAD strength linked
Current Level: ~1.1605
Watch: If EUR/USD rallies above 1.165 = EUR/CAD leg higher
Key Level: ECB vs Fed rate differential matters!
Pair 3: OANDA:GBPCAD 🔗
Alternative Long: Currently 1.8643 (+0.90%)
Stronger CAD Weakness Signal: If GBP/CAD rallies hard
Correlation Check: Use as confirmation for EUR/CAD direction
Pair 4: OANDA:CADJPY 🔗
Risk Sentiment Indicator: Japanese Yen strength = Risk-off
Trade Flows: Watch commodity-related USD/JPY moves
Alert Signal: If JPY strengthens = EM currencies weaken including CAD
📌 ECONOMIC CALENDAR - KEY DATES TO WATCH 🗓️
THIS WEEK - CRITICAL! 🔴
Jan 28, 2026 (TOMORROW!): Bank of Canada Rate Decision @ 2:45 PM ET
Expected: Hold at 2.25% ✅ (90% market odds)
Watch: Forward guidance on rate path
Volatility: HIGH - EUR/CAD could swing 30-50 pips
UPCOMING WEEK
Feb 5, 2026: ECB Governing Council (No rate change expected)
Fed Meeting: Monitor US economic data weekly
Canadian Employment Report: Watch hiring trends
MONTHLY RELEASES
Eurozone CPI Inflation: Watch services component (sticky!)
Canadian GDP Data: Q4 2025 results key for growth outlook
Both Central Banks: Wage pressure monitoring = inflation sticky risk
🎓 TRADING NOTES & RISK DISCLAIMERS ⚠️
❌ IMPORTANT RISKS
THIS IS NOT INVESTMENT ADVICE - Trade at your own risk!
Leverage Risk: Forex amplifies gains AND losses
Political Risk: USMCA renegotiation = Major CAD wild card
Central Bank Surprise: Never assume - market moves on unexpected data
Geopolitical: Energy market volatility (Venezuela situation) = Oil/CAD impact
Bank of Canada Jan 28: Rate decision could trigger 50+ pip moves
✅ PRO TRADER RULES
Position Sizing: Risk only 1% of account per trade (non-negotiable!)
Stop Loss: ALWAYS use SL - no exceptions for "Thief OGs"
Take Profits: Bank your gains at targets - Don't be greedy
Confirmation: Wait for candle close above 1.63200 before entry
Journal Everything: Track wins/losses for continuous improvement
🌟 FINAL CHECKLIST BEFORE TRADING ✅
Price above 1.6320? (Breakout confirmed)
Stop loss ready at 1.6270? (Risk defined)
Position size = 1% risk? (Capital protected)
BoC & ECB data checked? (Fundamentals aligned)
EUR/USD & USD/CAD correlated? (Multi-pair confirmation)
Chart pattern supports entry? (Technical + Fundamental match)
Trading plan written down? (Emotions controlled)
📊 SUMMARY SCORECARD
🔵 Technical Setup: 8/10 ✅ Bullish
🔵 Fundamental Support: 7/10 ✅ EUR Stable / CAD Weak
🔵 Risk/Reward Ratio: 9/10 ✅ Excellent (1:1.5)
🔵 Market Volatility: 6/10 ⚠️ Moderate
🔵 Trade Timing: 8/10 ✅ Early Setup Phase
🟢 OVERALL OPPORTUNITY: 8/10 🟢 BUY SETUP READY
🚀 THIS IS YOUR TRADE ZONE - STAY DISCIPLINED & STAY PROFITABLE! 🚀
Remember: Great traders aren't measured by their biggest win. They're measured by consistency, discipline, and how well they manage risk. Build your legacy one disciplined trade at a time.
Let's GET THIS MONEY! 💰💪
-Thief Trader (The Professional Forex Blueprint)

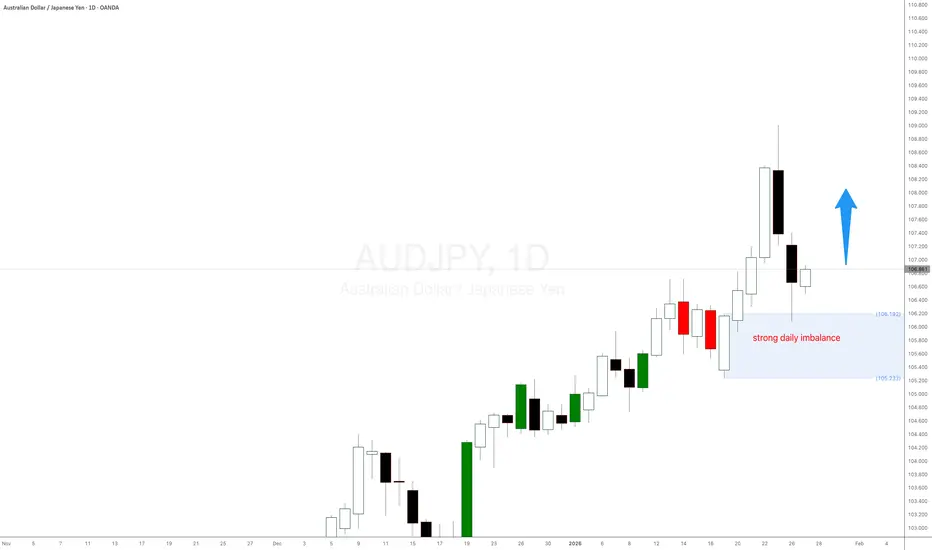
AUDJPY forex pair strong daily imbalanceAUDJPY forex pair strong daily imbalance took control and is trying to push the australiann dollar to higher grounds. The Japanese Yen is very weak accross the board. Let's see if this imbalance wants to play out.
CHF/JPY Downtrend Bias With Clear Risk Parameters🔻 CHF/JPY Bearish Breakdown | SMA Signal + Yen Strength Play 📉
Forex Market Trade Opportunity Guide (Day / Swing Trade)
📌 Asset
CHF/JPY – Swiss Franc vs Japanese Yen
🧠 Market Bias
🔴 Bearish Structure Confirmed
Price has broken and retested the Simple Moving Average (SMA) on the 4H timeframe, signaling momentum shift and trend continuation to the downside.
📊 Technical Breakdown
✅ SMA Breakout Confirmed @ 197.600 (4H TF)
📉 Market showing lower high pressure
⚠️ Short-term sellers active after rejection
🧲 Liquidity sweep + correction zone below
🎯 Entry Strategy
🟡 Flexible Entry Allowed
You may enter at ANY price level after confirmed SMA breakout
Best entries align with pullbacks toward dynamic resistance
Suitable for scaling or single-shot execution
🏁 Target Zone
🎯 195.500
Strong support zone
Oversold reaction area
Possible bear-trap / short covering
➡️ Book profits smartly — don’t wait for perfection
🛑 Stop Loss
🔐 199.000
Invalidation above structure
Protect capital if bullish reclaim occurs
⚠️ Risk Note
Dear Ladies & Gentlemen (Thief OG’s),
I do NOT recommend using only my TP or SL.
You control your risk. Take money when market pays.
Trade responsibly. 🧠💰
🌍 LIVE FUNDAMENTAL & MACRO WATCH (London Session Focus)
💴 Japanese Yen (JPY) Drivers
🏦 Bank of Japan (BoJ) policy expectations remain hawkish-leaning
📉 Yen strengthens during risk-off sentiment
📊 Watch:
Japan inflation trends
BoJ speeches & policy guidance
Global bond yield movements
🇨🇭 Swiss Franc (CHF) Drivers
🏦 SNB stance increasingly sensitive to deflation risks
CHF weakens when global risk appetite improves
📊 Watch:
Swiss CPI releases
SNB commentary
European economic spillover
⚡ Global Risk Factors
📉 Equity market weakness = JPY strength
🛢️ Commodity volatility affects CHF demand
🇺🇸 USD & Treasury yield moves influence both legs indirectly
🔗 RELATED PAIRS TO WATCH (Correlation Radar)
💹 USD/JPY → Strong inverse confirmation for JPY momentum
💹 EUR/JPY → Yen strength validation across majors
💹 CHF/USD → CHF weakness confirmation
💹 GBP/JPY → Risk sentiment thermometer
➡️ If JPY strengthens across the board, CHF/JPY downside gains confidence.
🧩 Final Thoughts
This setup blends:
✅ Clear technical confirmation
🌍 Strong macro alignment
🎯 Logical liquidity-based target
📌 Trade the plan, not emotions.
📈 Let structure guide you.
💬 Drop your bias & execution thoughts in comments!
If this helped — like 👍, follow 👣, and share with your trading circle.

Gold Breaks $5,000 | 2026 Outlook, Risk-Off Rally & Next Price ZOANDA:XAUUSD Gold Outlook 2026 Buy or Sell
📅 26 January 2026
🌍 MARKET OVERVIEW
Gold surged sharply on Friday, January 23, 2026, extending its historic rally as safe haven demand intensified amid geopolitical tensions, US policy uncertainty, and a weaker dollar outlook. COMEX gold futures hit record intraday highs near $4,990 to $4,995 and settled around $4,980 to $4,990, capping a massive weekly gain of over 8 percent.
Spot gold closely followed, pushing toward the key $5,000 psychological level after trading near $4,800 to $4,900 earlier in the week. The rally was driven by strong central bank buying, de dollarization trends, and escalating global risks, with silver also posting explosive gains.
🧠 KEY FUNDAMENTALS
🇺🇸 US Durable Goods Orders
Expected around 8:30 AM ET. Strong data may support the USD and pressure gold, while weak data could boost safe haven demand.
🏭 US Capital Goods Orders
Released alongside durable goods. Impacts growth outlook and USD direction, indirectly affecting gold.
🌍 Other Minor Data
Possible Eurozone or Canada GDP and early regional releases, but no major gold moving impact expected.
🌐 GEO POLITICS
🟡 Gold breaks $5,000
Spot gold surged to new record highs between $5,092 and $5,108 intraday on Monday, January 26, driven by intense safe haven demand.
🇺🇸 US tariff and policy uncertainty
Renewed fears around broad US tariffs involving Europe, trade partners, and Greenland rhetoric revived Trump era volatility, triggering capital flight into gold.
🔥 Rising global geopolitical risks
Ongoing Middle East tensions including Iran concerns, Russia Ukraine dynamics, and shifting US foreign policy are fueling global risk aversion.
🏦 De dollarization and central bank buying
Persistent central bank accumulation and investor hedging continue to underpin gold’s upside momentum.
⚖️ RISK ON RISK OFF ANALYSIS
📉 US 10 Year Treasury Yield
Current level 4.208 percent
Change 0.032 percent lower versus previous close around 4.24 percent
Daily range 4.208 percent to 4.223 percent
52 week range 3.860 percent to 4.660 percent
Trend Yields drifting lower confirming a risk off bias
🧠 WHAT DO ANALYST EXPECT
Gold surged to new all time highs above $5,100, extending its historic breakout into January 26.
The $5,000 level was breached for the first time late on January 25, triggering accelerated upside momentum.
Escalating US tariff threats including potential 100 percent tariffs linked to China and Canada heightened global trade war fears.
Policy uncertainty and confrontational rhetoric increased risk off sentiment, driving safe haven flows into gold.
Gold’s rally is increasingly viewed as a signal of declining confidence in fiat currencies and global policy stability, reinforcing strong bullish momentum.
🟢 CONCLUSION
Gold’s move above $5,000 confirms a strong risk off shift driven by geopolitical stress, tariff fears, and declining confidence in policy stability. Falling yields and a weaker dollar are reinforcing safe haven demand. Central bank buying and de dollarization trends continue to support the rally. The move is structural rather than data driven. Upside momentum remains firmly intact.

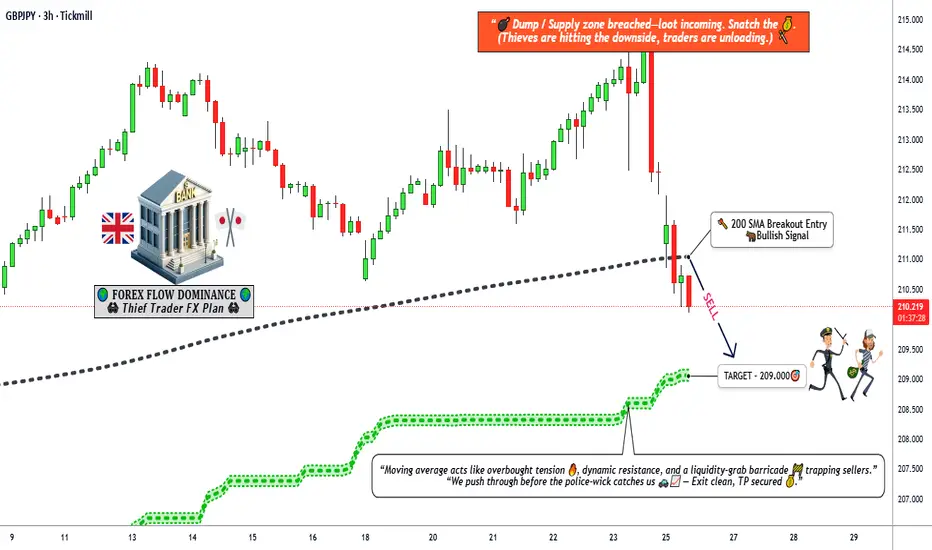
Has GBP/JPY Topped After Moving Average Rejection?🎯 GBP/JPY "THE GUPPY" BEARISH SWING/DAY TRADE SETUP | Multi-Layer Entry Strategy 🔥
📊 MARKET OVERVIEW
Asset: GBP/JPY (The Guppy) - Forex Major Cross
Trade Type: Swing/Day Trade
Direction: 🐻 BEARISH BIAS CONFIRMED
Strategy: Thief Layering Method (Multiple Limit Orders)
🎯 TRADE PLAN BREAKDOWN
📉 BEARISH SETUP CONFIRMED:
✅ Simple Moving Average (SMA) Breakout Detected
✅ Price Rejection at Key Resistance Zone
✅ Overbought Conditions on Multiple Timeframes
✅ Moving Average Acting as "Police Force" Resistance
🚨 ENTRY STRATEGY: THIEF LAYERING METHOD
⚠️ IMPORTANT: This strategy uses MULTIPLE SELL LIMIT ORDERS (Layering Technique)
🎯 Suggested Sell Limit Layers:
Layer 1: 211.500 🔴
Layer 2: 211.000 🔴
Layer 3: 210.500 🔴
💡 PRO TIP: You can add more layers or adjust based on your risk tolerance and account size. This "ladder entry" approach helps average your entry price and reduces timing risk.
Alternative: Market execution at current price levels is also viable if price shows immediate bearish momentum.
🎯 TAKE PROFIT TARGET
Primary TP: 209.000 💰
⚠️ THIEF OG's DISCLAIMER:
This is a suggested target zone. You are your own boss! Take profits when YOU feel comfortable. Scale out partially at psychological levels (210.00, 209.50) if you prefer to lock in gains progressively. Your money, your rules, your risk!
🛑 STOP LOSS
Thief SL: 212.000 ⛔
⚠️ RISK MANAGEMENT NOTICE:
This is a recommended invalidation level. Adjust based on your personal risk tolerance and position sizing. Never risk more than 1-2% of your account per trade. Ladies & Gentlemen, protect your capital first—profits come second!
📈 CORRELATED PAIRS TO WATCH
Direct Correlation Analysis:
GBP/USD (Cable) 🇬🇧💵
Watch for: GBP weakness will amplify bearish move on GBP/JPY
Key Level: Monitor 1.2400 support zone
EUR/JPY 🇪🇺🇯🇵
Correlation: High positive correlation (~0.85)
Use Case: Confirms JPY strength across the board
USD/JPY 🇺🇸🇯🇵
Watch for: JPY strength against USD = stronger confirmation
Key Level: Breaking below 155.00 = JPY bullish momentum
GBP/CHF 🇬🇧🇨🇭
Correlation: Measures pure GBP strength
Use Case: Weakness here confirms GBP leg of our bearish thesis
XAU/USD (Gold) 🥇💵
Risk-Off Indicator: Rising gold = JPY strength (safe haven flow)
Current Zone: Watch $2,750-2,800 resistance
🌍 FUNDAMENTAL & ECONOMIC FACTORS
🇬🇧 GBP FUNDAMENTALS (Bearish Pressure):
Bank of England (BoE): Dovish stance expected; potential rate pause/cut cycle ahead
UK GDP Growth: Slowing economic momentum concerns
Inflation Data: Cooling CPI reduces hawkish BoE expectations
Political Uncertainty: Fiscal policy concerns weighing on Sterling
🇯🇵 JPY FUNDAMENTALS (Bullish Support):
Bank of Japan (BoJ): Shifting away from ultra-loose policy; normalization talks
Yen Strength Drivers: Safe-haven demand amid global uncertainty
Wage Growth: Rising wages supporting domestic inflation = hawkish BoJ pivot potential
Intervention Risk: Japanese authorities monitoring excessive Yen weakness
📅 UPCOMING NEWS CATALYSTS TO WATCH
⚠️ HIGH-IMPACT EVENTS THIS WEEK:
🇬🇧 UK Economic Data:
Manufacturing & Services PMI
Retail Sales Data
BoE Speakers/Minutes
🇯🇵 Japan Economic Data:
Tokyo CPI (leading inflation indicator)
BoJ Policy Meeting Minutes
Trade Balance Data
🌐 Global Risk Sentiment:
US Federal Reserve Statements
Global Equity Market Performance (Risk-On/Risk-Off flows)
Geopolitical Tensions (affects safe-haven demand)
💡 TRADING NOTE: Avoid holding through major BoE or BoJ announcements if day trading. For swing traders, widen stops during high-volatility events.
🔥 TECHNICAL CONFLUENCE CHECKLIST
✅ SMA Breakout (Bearish)
✅ Resistance Rejection at 211.50+ zone
✅ Overbought RSI/Stochastic on H4/Daily
✅ Price Trapped Above Key Support-Turned-Resistance
✅ Momentum Divergence Signals
✅ Volume Confirmation on Reversal Candles
💎 THIEF TRADING PSYCHOLOGY REMINDERS
🧠 Stay Disciplined: Stick to your plan, not your emotions
💰 Manage Risk First: Profits are a byproduct of good risk management
📊 Follow Price Action: Let the market tell you when you're right or wrong
🎯 No FOMO: Missing a trade is better than forcing a bad one
🚀 Scale Your Winners: Let profitable positions breathe with trailing stops
🏆 FINAL VERDICT
The GBP/JPY "Guppy" is showing HIGH-PROBABILITY bearish setup with technical, fundamental, and correlation alignment. The Thief Layering strategy allows flexible entry management while the 209.000 target offers solid risk:reward potential.
Risk:Reward Ratio: Approximately 1:2.5 (based on layer average entry)
👍 If this analysis helps you, smash that LIKE button and FOLLOW for more Thief Strategy setups!
💬 Drop your thoughts below—are you team BEAR or waiting for confirmation?
#GBPJPY #ForexTrading #ThiefStrategy #TechnicalAnalysis #SwingTrading #DayTrading #ForexSignals #PriceAction #RiskManagement #TradingView #ForexCommunity #TheGuppy 🎯📊💰