Is USD/JPY Ready for the Next Leg Higher?🔥 USD/JPY "THE NINJA" - LAYERED BULLISH SWING SETUP 🔥
Hey Traders! 👋 The King of Forex is showing strength, and I'm plotting a strategic bullish swing trade on USD/JPY "THE NINJA". This isn't a chase; it's a patient, layered entry plan for the next leg up! 📈
🎯 TRADE PLAN: "THE THIEF" LAYERED STRATEGY
This method uses multiple limit orders to "steal" good prices on dips, averaging into a position without FOMO.
Direction: Bullish 🐂
Style: Swing Trade
⚡ ENTRY ZONE (LAYERED LIMITS):
I am setting buy limit orders at these key support layers:
1st Layer: 153.600 🟢
2nd Layer: 154.000 🟢
3rd Layer: 154.400 🟢
Pro Tip: You can increase or adjust these layers based on your capital and risk appetite. The goal is to scale in!
🚨 STOP LOSS (MANAGE YOUR RISK!):
My hard stop is placed below a key support level at 153.300.
⚠️ IMPORTANT NOTE: This is MY stop loss. You MUST adjust your position size and SL based on YOUR own risk tolerance and strategy. Protect your capital! 🛡️
🎯 PROFIT TARGET:
Primary Target: 156.000 ✅
Why Here? This zone converges with a strong moving average resistance, potential overbought conditions, and could be a "trap" for late buyers. Let's escape with profits before the crowd! 💰
⚠️ IMPORTANT NOTE: This is MY target. You are free to take partial profits earlier or trail your stop. "Make money, then take money" at your own discretion!
🔍 MARKET CONTEXT & KEY DRIVERS
Trend: The broader trend remains bullish, driven by interest rate differentials between the hawkish Fed and the dovish BoJ.
Key Level: We are respecting the psychological 155.00 level. A break and close above could accelerate the move.
Caution: The market is watching for any potential FX intervention from Japanese authorities, which can cause violent, short-term reversals.
🌐 RELATED PAIRS TO WATCH
Diversify your view! Don't trade USD/JPY in a vacuum.
TVC:DXY (US Dollar Index): 📊
Correlation: Positive. A strong DXY typically means a strong USD/JPY. If the dollar is rallying broadly, this trade has a stronger tailwind.
EUR/USD ( FX:EURUSD ): 🇪🇺🇺🇸
Correlation: Negative (Inverse). Often, if USD/JPY is going up, EUR/USD is going down. Watch this for overall USD strength/weakness.
GBP/JPY ( OANDA:GBPJPY ): 🇬🇧🇯🇵
Correlation: Positive. This is a "risk-on" JPY pair. If both USD/JPY and GBP/JPY are rising, it confirms a broad-based sell-off in the Japanese Yen.
USD/CHF ( OANDA:USDCHF ): 🇺🇸🇨🇭
Correlation: Positive. Both are often traded as "USD-strength" pairs, though CHF can have its own safe-haven flows.
✅ SUMMARY
Asset: USD/JPY (The Ninja)
Bias: Bullish Swing
Strategy: Layered "Thief" Entries
Target: 156.000
Stop Loss: 153.300
Let me know your thoughts in the comments! 👇
What's your target? Did you layer your entries?
Like & Follow if you found this guide useful! 🚀 Good luck, and trade safe!
#Forex #Trading #USDJPY #NINJA #SwingTrading #Bullish #TradingStrategy #DXY #EURUSD #GBPJPY
Forexsetup

USDCAD Long Setup — Retest Zone Could Fuel the Next Push HigherToday, I want to share a long trading opportunity on the USDCAD ( FX:USDCAD ) pair. Stay tuned!
USDCAD is currently breaking through the resistance zone(1.394 CAD-1.389 CAD) with good momentum, and this zone is now acting as support. It’s also near the Potential Reversal Zone (PRZ) and the support lines, which can provide a solid foundation for the continuation of the bullish trend.
From an Elliott Wave perspective, it seems that USDCAD has completed main wave 3, and we should now expect the corrective wave 4 before the pair resumes its upward movement.
Additionally, recent U.S. unemployment claims data, which was favorable for the DXY index( TVC:DXY ), supports the continuation of the USDCAD bullish trend.
I expect that as USDCAD enters the Potential Reversal Zone (PRZ) , it will begin to climb and target the resistance zone(1.394 CAD-1.389 CAD) once again.
First Target: 1.389 CAD
Second Target: 1.393 CAD
Stop Loss(SL): 1.378 CAD(Worst)
💡 Please respect each other's opinions and express agreement or disagreement politely.
📌U.S. Dollar/Canadian Dollar Analysis (USDCAD), 4-hour time frame.
🛑 Always set a Stop Loss(SL) for every position you open.
✅ This is just my idea; I’d love to see your thoughts too!
🔥 If you find it helpful, please BOOST this post and share it with your friends.

EURAUD, Huge Formation, WEDGE to Setup BEARISH BREAKOUT!Hello There!
Welcome to my new analysis of EURAUD from the 4-hour timeframe perspective. In recent times the EXY, European Currency Index has shown up with crucial bearish inclinations which are pointing to a bearish market sentiment especially with massive inflation spreading like wildfire seemingly not reacting to exponential rate hikes pulled out by the ECB. Such developments could point to a major bearish setup emerging for the EURAUD also. Besides that, there are important formational structures that need to be considered here. In this case, it is necessary to determine the final completions and changes within the market before rushing to anything else.
Formational Developments, Resistance, Bearish Momentum, and Setup:
When looking at my chart now EURAUD continued to form this preceding huge bearish descending channel trend in which it already pulled back several times bearishly off the upper boundary increasing the high possibility likelihood of such pullbacks to holding on and printing the next bearish waves with continued lower lows to be determined. Especially as EURAUD already pulled back several times from the 65-EMA in red as well as the 35-EMA in grey these EMAs are substantial resistances from where continued pullbacks are more likely than anything else. Currently, EURAUD is approaching the EMAs together with the upper boundary resistance of the channel once again which is pointing to the next bearish wave to set up from here on.
Upcoming Determinations, Bearish Breakout, Target Activation, and Underlying Drivers:
Furthermore, what is the most important formation in my whole chart is this crucial descending wedge formation. Such a formation is pointing to an increased continuation toward the bearish direction in almost all of the cases. This formation will be completed with a final breakout below the lower boundary as it is marked within my chart and as EURAUD already completed the wave-count within the formation this final breakout is likely to emerge within the near future. Once the breakout has shown up as it is marked this is going to be the origin of the wave C extension and bearish momentum acceleration as it is marked. Once this wave C acceleration and bearish wave has shown up it is going to activate the final target zone as marked.
Once this final target zone has been reached further assumptions need to be made. The pair is on my watchlist to determine important changes once they have shown up here, especially with the target projections and bearish developments to be expected. Especially, a massive inflation increase together with failed monetary policies are going to fuel a bearish momentum inclination here therefore these underlying factors also need to be considered then.
In this manner, thank you everybody for watching my analysis of CHFAUD. Support from your side is greatly appreciated.
VP

USDJPY Breaks Falling Wedge Pattern, Ready to pump!USDJPY ( FX:USDJPY ) has started to climb from its Support lines and Support zone(155.100 JPY-154.120 JPY), showing good momentum in its upward movement.
From a classical technical analysis perspective, it seems that USDJPY has successfully broken the upper lines of the falling wedge pattern on the 1-hour timeframe, which is a positive sign for the continuation of the bullish trend.
From an Elliott Wave perspective, it appears that USDJPY has completed main wave 4 using a Double Three Correction(WXY) within the Support zone(155.100 JPY-154.120 JPY).
Looking ahead, I expect USDJPY to resume its upward movement following a pullback to its Fibonacci levels, potentially rising at least to the 155.94 JPY.
First Target: 155.94 JPY.
Second Target: 156.27 JPY.
Stop Loss(SL): 154.82 JPY.
Please respect each other's ideas and express them politely if you agree or disagree.
📌 U.S. Dollar/Japanese Yen Analyze (USDJPY), 1-hour time frame.
🛑 Always set a Stop Loss(SL) for every position you open.
✅ This is just my idea; I’d love to see your thoughts too!
🔥 If you find it helpful, please BOOST this post and share it with your friends.

Crude Oil and OPEC+ Impactful DecisionsShaping the Global Energy Market
Crude oil remains one of the most strategically important commodities in the world, influencing inflation, economic growth, currency movements, and geopolitical relations. At the center of this complex ecosystem stands OPEC+, a powerful alliance comprising the Organization of the Petroleum Exporting Countries (OPEC) and a group of major non-OPEC oil producers led by Russia. Since its formal establishment in 2016, OPEC+ has become the most influential force in determining the direction of global crude oil markets. Its decisions on production levels, supply management, and market intervention have repeatedly demonstrated their ability to impact oil prices, investor sentiment, and the broader global economy.
Understanding OPEC+ and Its Role
OPEC+ was created in response to prolonged oil price weakness and rising competition from non-OPEC producers, particularly U.S. shale oil. By expanding coordination beyond traditional OPEC members, the alliance sought to stabilize markets through collective action. The core objective of OPEC+ is to balance supply and demand, ensuring price stability that benefits both producers and consumers while safeguarding long-term investment in the energy sector.
The alliance collectively controls more than 40% of global oil production and over 80% of proven oil reserves, giving it immense leverage. As a result, even small changes in production targets can lead to significant price fluctuations. Markets closely track every OPEC+ meeting, statement, and informal comment from key leaders such as Saudi Arabia and Russia.
Production Cuts and Price Stabilization
One of the most impactful tools used by OPEC+ is coordinated production cuts. When global demand weakens due to economic slowdowns, financial crises, or unexpected shocks, OPEC+ often reduces output to prevent price collapses. These decisions are especially powerful because they signal unity and discipline among major producers.
For example, during periods of oversupply, OPEC+ production cuts have historically led to sharp rebounds in crude oil prices. Traders interpret these cuts as a commitment to defending price levels, encouraging speculative buying and reducing bearish sentiment. Such actions not only support oil-exporting economies but also stabilize energy sector investments worldwide.
However, production cuts are not without challenges. Compliance among member nations can vary, and some countries may exceed quotas to maximize revenue. Despite this, the leadership role of Saudi Arabia has often ensured overall adherence, reinforcing OPEC+ credibility.
Voluntary Cuts and Strategic Signaling
In recent years, OPEC+ has increasingly relied on voluntary production cuts by key members. These unilateral actions serve as strong market signals, demonstrating proactive leadership when consensus among all members is difficult to achieve. Voluntary cuts often create immediate price reactions, as markets view them as decisive and flexible interventions.
Such moves highlight OPEC+’s evolving strategy—from rigid collective decisions to more adaptive frameworks. This flexibility allows the group to respond swiftly to changing market conditions, such as slowing demand from major economies or rising supply from non-OPEC producers.
Managing Demand Shocks and Global Crises
OPEC+ decisions become especially impactful during global crises. Events such as financial downturns, pandemics, or geopolitical conflicts can abruptly alter oil demand patterns. During these periods, OPEC+ acts as a market stabilizer, adjusting supply to prevent extreme volatility.
For instance, during periods of sharp demand destruction, aggressive production cuts have helped prevent oil prices from remaining at unsustainably low levels. Conversely, during periods of strong economic recovery, gradual supply increases help avoid overheating markets and excessive price spikes that could harm global growth.
These balancing acts underscore OPEC+’s role not just as a cartel, but as a de facto regulator of the oil market.
Geopolitical Influence and Strategic Power
OPEC+ decisions are deeply intertwined with geopolitics. Oil-producing nations use production policy as a strategic tool to protect national interests, influence global diplomacy, and manage fiscal stability. Countries heavily dependent on oil revenues require stable prices to fund public spending and economic development.
Tensions between major producers and consuming nations often intensify following OPEC+ decisions that push prices higher. Import-dependent economies may accuse the alliance of artificially restricting supply, while producers argue they are ensuring market stability and long-term sustainability.
The inclusion of Russia in OPEC+ has further amplified its geopolitical weight, aligning energy policy with broader international power dynamics. This cooperation has redefined energy diplomacy and challenged traditional Western influence over global energy markets.
Impact on Inflation and Monetary Policy
OPEC+ decisions have a direct and measurable impact on global inflation. Higher crude oil prices increase transportation, manufacturing, and energy costs, which eventually pass through to consumers. Central banks closely monitor oil prices when setting interest rates, making OPEC+ actions relevant far beyond the energy sector.
When OPEC+ tightens supply and prices rise sharply, central banks may adopt tighter monetary policies to control inflation. Conversely, falling oil prices can ease inflationary pressures, allowing more accommodative policies. In this way, OPEC+ decisions indirectly influence financial markets, currencies, and global liquidity conditions.
Interaction with Non-OPEC Supply
Another critical aspect of OPEC+ strategy is managing competition from non-OPEC producers, especially U.S. shale oil. Higher prices encourage shale producers to increase output, potentially undermining OPEC+ efforts to tighten supply. As a result, OPEC+ must carefully calibrate its decisions to avoid stimulating excessive rival production.
This strategic balancing act has led OPEC+ to prioritize price stability over price maximization, aiming for levels that sustain revenues without triggering disruptive supply responses from competitors.
Long-Term Market Outlook and Energy Transition
As the world gradually transitions toward renewable energy, OPEC+ decisions are also shaped by long-term considerations. The alliance recognizes that oil demand growth may slow over time due to electrification, climate policies, and technological advancements. This reality has influenced a more cautious approach to capacity expansion and investment.
By managing supply responsibly, OPEC+ aims to maximize the value of existing reserves while ensuring orderly market conditions during the energy transition. Its decisions today will play a crucial role in determining how smoothly the global economy navigates this structural shift.
Conclusion
OPEC+ has firmly established itself as the most influential force in the global crude oil market. Through coordinated production cuts, voluntary actions, and strategic signaling, the alliance shapes price trends, manages volatility, and influences economic and geopolitical outcomes worldwide. Its decisions ripple across financial markets, affect inflation and monetary policy, and impact both producing and consuming nations.
In an era marked by economic uncertainty, geopolitical tension, and energy transition, OPEC+ remains a central pillar of global energy stability. Understanding its impactful decisions is essential for traders, investors, policymakers, and anyone seeking insight into the future direction of crude oil markets.

#NZDUSD: Three Targets, Swing Buy, Ready For Next Big MoveDear Traders
NZDUSD Chart Analysis SMC+ICT💭📊
🔺The price was rejected at 0.5580, a ‘discounted zone’ price, which was reversed without consolidation or accumulation. The price then moved in an impulse pattern and encountered strong resistance at 0.58320.
🔺A rejection at 0.58320 presents a favourable opportunity for traders to optimise the next significant price impulse. This analysis suggests a potential reversal from 0.5710.
Entry, Take Profit And Stop Loss👨💻📈
🔺 The entry between the blue and red horizontal lines indicates a significant volume zone and can be considered a discounted buying opportunity.
🔺A stop loss can be placed at the red horizontal line or increased based on your own analysis.
🔺We recommend targeting take profit first at the outset. As the price crosses our take profit level, you can consider adjusting the take profit area.
Like And Comment❤️
Team Setupsfx_🏆

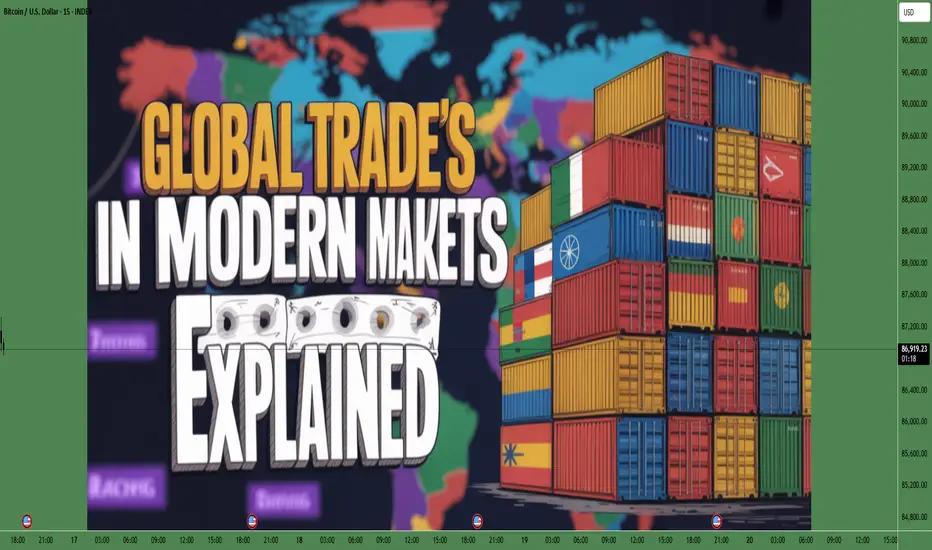
Global Trade in the Modern MarketStructure, Dynamics, and Strategic Importance
Global trade in the modern market represents one of the most powerful engines of economic growth, innovation, and international interdependence. Unlike earlier eras—when trade was limited by geography, slow transportation, and fragmented information—today’s global trade ecosystem operates at high speed, across digital platforms, and through deeply integrated supply chains. Goods, services, capital, data, and technology now move across borders with unprecedented scale and complexity, reshaping how nations compete and collaborate.
1. Evolution of Global Trade
Modern global trade has evolved from simple bilateral exchange into a sophisticated, multi-layered network. Containerization revolutionized logistics, reducing costs and transit times. The rise of multinational corporations (MNCs) fragmented production into global value chains (GVCs), where design, manufacturing, assembly, and marketing occur in different countries. Digitalization further transformed trade by enabling real-time coordination, e-commerce, and cross-border services that require no physical shipment at all.
2. Key Drivers of Modern Global Trade
Several forces define today’s trading environment:
Technology and Digital Platforms: Cloud computing, AI, and data analytics optimize inventory, pricing, and demand forecasting. Digital marketplaces allow even small firms to access global customers.
Trade Liberalization: Free trade agreements (FTAs) and regional blocs reduce tariffs, harmonize standards, and encourage cross-border investment.
Capital Mobility: Global finance supports trade through credit, hedging instruments, and risk management tools such as futures, options, and insurance.
Consumer Demand: Rising incomes in emerging markets fuel demand for diverse products, while developed markets seek cost efficiency and innovation.
3. Structure of Global Trade Flows
Modern trade flows extend beyond physical goods:
Merchandise Trade: Includes commodities (energy, metals, agriculture) and manufactured goods (electronics, automobiles, machinery).
Services Trade: Finance, IT services, logistics, consulting, tourism, and digital services are growing faster than goods trade.
Intellectual Property and Data: Licensing, software, patents, and data flows are now critical trade assets.
Capital and Investment: Foreign direct investment (FDI) supports production hubs and market access.
4. Role of Global Value Chains (GVCs)
Global value chains are the backbone of modern trade. A single product—such as a smartphone—may involve raw materials from Africa, components from East Asia, design from the US or Europe, and assembly in Southeast Asia. This specialization increases efficiency but also creates vulnerability. Disruptions like pandemics, geopolitical tensions, or natural disasters can ripple across the entire chain, forcing firms to rethink resilience and diversification.
5. Emerging Markets and Trade Power Shifts
The modern trade landscape reflects a gradual shift from a unipolar system to a multipolar one. Emerging economies—particularly in Asia, Latin America, and parts of Africa—are no longer just low-cost manufacturers. They are becoming:
Major consumer markets
Innovation hubs
Strategic suppliers of critical resources
Countries like China, India, Vietnam, and Mexico play increasingly central roles in global production and trade negotiations, influencing pricing, standards, and supply-chain strategies.
6. Geopolitics and Trade Policy
Trade today is inseparable from geopolitics. Tariffs, sanctions, export controls, and industrial policies are used as strategic tools. Governments prioritize:
Economic security (semiconductors, energy, food)
Supply-chain sovereignty
Strategic alliances and friend-shoring
This has led to partial de-globalization or “re-globalization,” where trade is restructured around trusted partners rather than purely cost-based efficiency.
7. Financial Markets and Trade Integration
Modern trade is closely linked with global financial markets:
Foreign Exchange (FX): Currency movements directly impact trade competitiveness and profitability.
Derivatives: Futures and options help exporters and importers hedge price and currency risks.
Trade Finance: Letters of credit, guarantees, and supply-chain finance enable liquidity and trust across borders.
This integration allows trade to scale rapidly but also exposes it to financial volatility and capital flow reversals.
8. Sustainability and ESG in Global Trade
Environmental, Social, and Governance (ESG) considerations are reshaping trade decisions. Companies and governments now factor in:
Carbon footprints and green logistics
Ethical sourcing and labor standards
Circular economy principles
Carbon border taxes, sustainability-linked financing, and green trade corridors are emerging as defining features of modern global commerce.
9. Digital Trade and the Future of Commerce
Digital trade is one of the fastest-growing segments:
Cross-border e-commerce platforms connect sellers and buyers directly.
Digital payments and blockchain improve transparency and settlement.
Services like cloud computing, online education, and remote work are traded globally without physical borders.
Regulation of data flows, cybersecurity, and digital taxation will heavily influence the next phase of global trade.
10. Risks and Challenges in the Modern Trade System
Despite its scale and efficiency, modern global trade faces key challenges:
Supply-chain disruptions
Trade wars and protectionism
Currency volatility
Regulatory fragmentation
Climate-related risks
Managing these risks requires diversification, strategic inventory management, and advanced risk-hedging tools.
11. Strategic Importance of Global Trade
Global trade is more than economic exchange—it is a strategic asset. It shapes:
National growth and employment
Corporate profitability and competitiveness
Innovation diffusion
Global political influence
Countries that master trade logistics, financial integration, and technological adoption gain long-term strategic advantages.
Conclusion
Global trade in the modern market is a complex, fast-moving, and deeply interconnected system. It blends physical goods, digital services, finance, and geopolitics into a single global framework. While efficiency and scale have reached historic highs, resilience, sustainability, and strategic alignment are now equally important. The future of global trade will not be defined solely by how cheaply goods move across borders, but by how intelligently, securely, and sustainably global markets are connected.
Is the Cable Entering a New Bullish Expansion Phase?🔥 GBP/USD "THE CABLE" BULLISH BREAKOUT SETUP | SWING/DAY TRADE 📈💷
📊 CURRENT MARKET DATA (Real-Time Verified)
Current Price: 1.3372 ✅
Today's Range: 1.3341 - 1.3401
52-Week Range: 1.2098 - 1.3789
Technical Rating: Strong Buy 🟢
🎯 TRADE SETUP OVERVIEW
Asset: GBP/USD (British Pound / US Dollar)
Nickname: "The Cable" 🌊
Trade Type: Swing Trade / Day Trade
Direction: BULLISH 📈
💡 TECHNICAL ANALYSIS & PLAN
Bullish Confirmation: ✅
Simple Moving Average Pullback Confirmed
Breakout Pattern Identified
Retest Completed Successfully
Currently Trading Near Support Zone
Strategy: SMA Pullback + Breakout + Retest Entry
🎲 "THIEF" LAYERING ENTRY STRATEGY
Entry Method: Multiple Limit Orders (Layering Style)
Suggested Entry Layers:
🟢 Layer 1: 1.33200
🟢 Layer 2: 1.33400
🟢 Layer 3: 1.33600
Note: You can add additional layers based on your own strategy and risk tolerance. This layering approach allows for averaging into the position as price pulls back.
🛡️ RISK MANAGEMENT
Thief Strategy Stop Loss: 1.33000 ⛔
⚠️ IMPORTANT DISCLAIMER:
Dear Ladies & Gentlemen (Thief OG's) - Adjust your stop loss based on YOUR OWN strategy and risk management rules. This is not a recommendation, but rather one approach to consider. Your capital, your rules! 💪
🎯 TARGET & EXIT PLAN
Target Price: 1.34900 🎯
Exit Strategy Considerations:
Strong resistance zone ahead
Potential overbought conditions
Trap zones identified near target
⚠️ PROFIT-TAKING DISCLAIMER:
Dear Ladies & Gentlemen (Thief OG's) - This is NOT a recommendation to hold until this specific target. Take profits at YOUR own discretion based on YOUR risk appetite. Your money, your rules. Exit when YOU feel comfortable! 💰
🌍 RELATED PAIRS TO WATCH
Monitor these correlated USD pairs for confluence:
💵 USD Index ( TVC:DXY )
Why Watch: Direct inverse correlation with GBP/USD
Key Point: USD weakness = GBP/USD strength
Current Status: Showing bearish pressure per COT report
💶 FX:EURUSD
Current Price: ~1.1744
Correlation: Strong positive correlation with GBP/USD
Key Point: Both pairs move together against USD
Watch For: EUR/USD breakouts often lead GBP/USD
💴 OANDA:GBPJPY
Current Price: ~208.29
Correlation: Shows GBP strength independent of USD
Key Point: Confirms overall Pound momentum
Watch For: Yen weakness adds fuel to GBP strength
🦘 OANDA:AUDUSD
Current Price: ~0.6646
Correlation: Risk-on/risk-off indicator
Key Point: Risk appetite affects both pairs
Watch For: Commodity currency strength = risk-on environment
🍁 OANDA:GBPCAD
Correlation: Direct GBP strength measurement vs commodity currency
Key Point: Isolated GBP performance indicator
Watch For: Divergence signals unique GBP catalysts
📌 KEY CORRELATION INSIGHTS
🔴 When USD Weakens:
GBP/USD rises ↗️
EUR/USD rises ↗️
AUD/USD rises ↗️
DXY falls ↘️
🟢 When GBP Strengthens:
GBP/USD rises ↗️
GBP/JPY rises ↗️
EUR/GBP may fall ↘️
GBP/CAD rises ↗️
💡 Trading Tip: If you see ALL USD pairs rising together (EUR/USD, AUD/USD, GBP/USD), this confirms broad USD weakness. If only GBP/USD rises while EUR/USD stalls, this signals specific GBP strength.
⚡ FUNDAMENTAL CATALYSTS
🇺🇸 USD Factors:
Federal Reserve expected to cut rates (90% probability of 25bps cut)
Softer US economic data weighing on Dollar
"Hawkish cut" expected with cautious guidance
🇬🇧 GBP Factors:
Bank of England meeting scheduled December 18
Mixed UK economic data (inflation cooling, labor market softening)
88% probability of BoE rate cut priced in
📱 TRADE MANAGEMENT CHECKLIST
✅ Monitor DXY for USD strength/weakness
✅ Watch EUR/USD for confirmation
✅ Check GBP/JPY for isolated GBP strength
✅ Set alerts at entry layers
✅ Adjust position size to your risk tolerance
✅ Use proper stop loss discipline
✅ Take partial profits at psychological levels
✅ Trail stop loss as position moves in your favor
⚠️ FINAL RISK DISCLAIMER
This is an educational trade idea, NOT financial advice.
Trade at your own risk
Past performance ≠ future results
Only risk capital you can afford to lose
Adjust ALL levels to your own strategy
Markets can remain irrational longer than you can remain solvent
Always use proper risk management
🏆 TRADE WITH DISCIPLINE | PROFIT WITH PATIENCE
Good luck, Thief OG's! May the pips be ever in your favor! 🎯💰📈
Like 👍 | Follow 🔔 | Comment 💬

NZDUSD testing high resistance moving averagesNZDUSD has rallied to a series of moving averages that have the potential to create a great short opportunity. Similar to the usual BorrowedClothes plays, the pair has already rejected the Monthly 10EMA, and is now testing the weekly 20SMA and 50SMA below. With the 4H RSI overbought and a generally hawkish tone from Powell after Wednesday's fed rate decision, there's a chance this rally will correct which could lead to good profit. Of course I could be wrong. The markets do what they want to do.

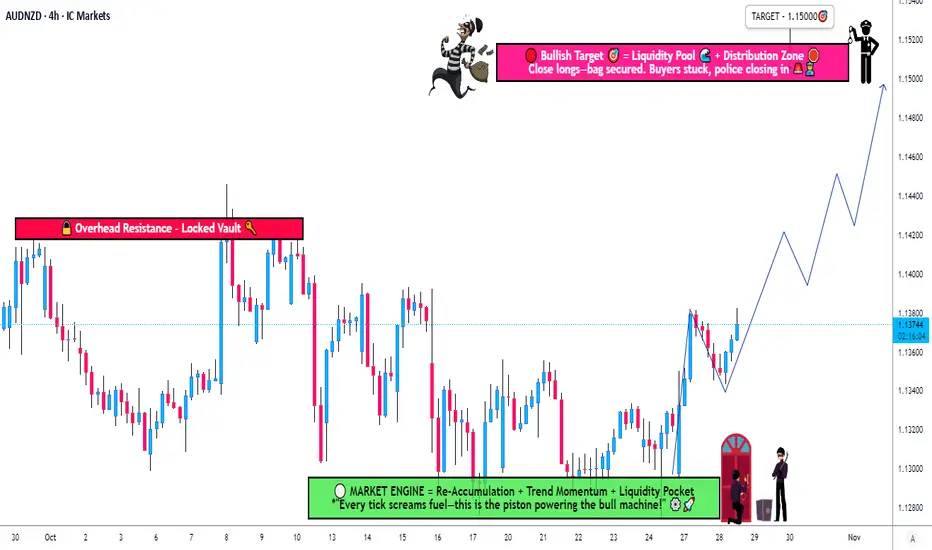
AUD/NZD Rising Structure — Layered Entry Setup Confirmed!🎯 AUD/NZD: The Trans-Tasman Layering Heist 🦘🥝
Market: FOREX | Pair: AUD/NZD (Aussie vs Kiwi Dollar)
Strategy Type: Swing/Day Trade | Bias: BULLISH 🐂
Risk Profile: Medium | Trade Style: Thief Layering Method 🎭
📊 THE SETUP
The Trans-Tasman neighbors are setting up for an interesting bullish move. The Aussie is showing relative strength against the Kiwi, and we're positioning for a tactical upside play using a layered entry approach.
🎯 TRADE PLAN: THE LAYERING HEIST
Entry Strategy: Multi-Layer Limit Orders 🪜
This isn't your standard one-click entry—we're spreading risk across multiple price levels:
Layer 1: 1.13000
Layer 2: 1.13200
Layer 3: 1.13400
Layer 4: 1.13600
You can add more layers based on your account size and risk appetite. The beauty of layering? You average in as price moves, reducing timing risk.
Stop Loss: 1.12800 🛑
⚠️ Risk Disclaimer: This SL is MY level based on MY analysis. YOU control your own risk management. Adjust according to your strategy and account size.
Take Profit Target: 1.15000 🎯
This zone has confluence: strong historical resistance + potential overbought conditions + liquidity trap territory. Take your profits before the crowd does!
⚠️ Profit Disclaimer: This TP is MY target. YOU decide when to bank profits. Scale out, trail stops, or take it all at once—your money, your rules.
🔍 TECHNICAL ANALYSIS
Why This Setup Works:
AUD showing relative strength vs NZD on macro fundamentals
Key support holding at lower levels
Room to run before hitting major resistance cluster at 1.15000
Multi-layer entry reduces timing risk and improves average entry price
Risk-Reward Profile:
With layered entries averaging around 1.13150, we're looking at roughly 1:4 R/R to target, making this an asymmetric opportunity worth watching.
🌏 CORRELATED PAIRS TO WATCH
Keep these pairs on your radar for confluence and confirmation:
Direct Correlations:
OANDA:AUDUSD 💵 - If Aussie is strong globally, it confirms our bias
OANDA:NZDUSD 💵 - Kiwi weakness here supports our long AUD/NZD position
OANDA:AUDCAD 🍁 - Another commodity currency pair showing Aussie strength
Inverse Correlations:
FX:USDJPY 🇯🇵 - Risk-on sentiment helps commodity currencies
Gold ( OANDA:XAUUSD ) 🥇 - Aussie correlates with gold; watch for confirmation
Why These Matter: When AUD/USD rises and NZD/USD lags, AUD/NZD naturally climbs. Cross-check these pairs before executing.
⚡ KEY POINTS TO REMEMBER
1️⃣ Layering = Patience: Don't FOMO into one entry. Let the layers fill as price moves.
2️⃣ Position Sizing: Each layer should be sized so your TOTAL position aligns with your risk model.
3️⃣ This Isn't Set-and-Forget: Monitor correlation pairs and news from RBA and RBNZ.
4️⃣ Know When to Fold: If structure breaks below 1.12800, we were wrong. Exit cleanly.
5️⃣ Scale Out Strategy: Consider taking partial profits at psychological levels like 1.14000.
🎭 ABOUT THE "THIEF STYLE"
The layering method is about being strategic and patient—like a calculated heist, not a smash-and-grab. We're not market makers, but we can think like them by spreading our orders across zones instead of chasing candles.
This approach:
Reduces emotional trading
Improves average entry price
Manages risk across multiple levels
Allows for partial fills in volatile markets
🚀 TRADE MANAGEMENT CHECKLIST
✅ Set all limit orders
✅ Configure stop loss
✅ Set alerts at key levels
✅ Monitor correlated pairs
✅ Review daily before London/NY sessions
✅ Have an exit plan beyond just TP/SL
✨ If you find value in my analysis, a 👍 and 🚀 boost is much appreciated — it helps me share more setups with the community!
#AUDNZD #ForexTrading #SwingTrading #DayTrading #LayeringStrategy #ThiefStyle #AussieVsKiwi #ForexAnalysis #TradingSetup #RiskManagement #PriceAction #ForexSignals #TradingIdeas #CurrencyTrading #ForexStrategy
GBP/JPY Traders, Don’t Miss This 200 SMA Bullish Setup!🎯 GBP/JPY "Guppy" Bullish Momentum Play | SMA-200 Pullback Setup 🚀
📊 Market Overview
Asset: GBP/JPY (Cable vs Yen Cross)
Nickname: "The Guppy" 🐟
Trade Type: Swing/Day Trade Hybrid
Bias: BULLISH 📈
🧠 Technical Analysis
The Setup 🎯
We're eyeing a textbook pullback to the 200 SMA — the institutional magnet that's been holding the bullish structure intact. Price is showing respect at this dynamic support level, and we're positioning for the next leg up.
Key Technical Confirmations:
✅ 200 Simple Moving Average acting as dynamic support
✅ Bullish market structure intact on higher timeframes
✅ Momentum favoring upside continuation
✅ Risk-to-reward setup looking juicy
💰 The "Thief Strategy" Entry Method 🎭
Entry Philosophy: Multiple limit orders (layering style) to scale into position like a pro. Think of it as "catching the falling knife" but with style and risk management!
🎯 Entry Zones (Pick Your Poison):
Layer 1: 201.000
Layer 2: 201.500
Layer 3: 202.000
Layer 4: 202.500
You can add more layers based on your risk appetite and account size. The goal? Average in as price tests support!
🛡️ Stop Loss:
Thief's SL: 200.500
⚠️ Risk Disclaimer: This is MY stop level based on my strategy. You're the captain of your ship — set your own stops based on YOUR risk tolerance. Don't blindly follow; adapt to your own trading plan!
🎯 Take Profit Target:
TP Zone: 206.500
Why this level?
Strong resistance confluence ⛔
Potential overbought conditions 📊
Bull trap zone identified
💡 Smart Exit Strategy: Lock in profits progressively! Consider taking partials along the way. Remember, "you can make money, then TAKE money" — don't get greedy!
🔗 Correlated Pairs to Watch
Keep an eye on these for confirmation:
Direct Correlations:
OANDA:EURJPY 💶💴 — Sister pair, similar yen exposure
OANDA:AUDJPY 🦘💴 — Risk-on sentiment gauge
FX:GBPUSD 💷💵 — Cable strength indicator
Inverse Correlations:
FX:USDJPY 💵💴 — Yen strength/weakness
TVC:DXY (US Dollar Index) 💵 — Overall dollar sentiment
Pro Tip: If EUR/JPY and AUD/JPY are also bouncing from support, it confirms broad yen weakness = stronger Guppy setup! 🐟📈
🎓 Key Points to Remember
SMA-200 Respect: This ain't just any moving average — institutions watch this level religiously
Layering = Risk Management: Don't YOLO your entire position at one price
Yen Pairs Move Together: Watch the JPY crosses for confirmation
Patience Pays: Let price come to YOUR levels, don't chase
Profit Taking is a Skill: Nobody went broke taking profits! 💰
⚖️ Risk Management Reminder
Position size according to your account (1-2% risk max recommended)
Each layer should be smaller portions of your total planned position
Adjust stops to breakeven after Layer 1 fills and price moves in your favor
Trail your stop as price approaches target
🎬 Final Thoughts
The Guppy is setting up nicely for a bounce play off the SMA-200. This is a patience game — let the market come to you, execute the plan, and manage risk like a professional thief (the good kind 😉).
Remember: This is swing/day trade hybrid, so don't expect instant gratification. Give the setup room to breathe!
✨ If you find value in my analysis, a 👍 and 🚀 boost is much appreciated — it helps me share more setups with the community!
#GBPJPY #Guppy #ForexTrading #SwingTrading #DayTrading #TechnicalAnalysis #SMA200 #PullbackStrategy #ThiefStyle #ForexSignals #TradingSetup #PriceAction #RiskManagement #ForexCommunity #TradingIdeas #JPYCross #BullishSetup #ForexStrategy #TradingView #ChartAnalysis

EUR/USD – Price Action Triggers Bearish Opportunity🚀 EUR/USD “FIBRE” Metals Market Profit Playbook 🪓 (Day-Trade Setup)
🧠 Market Overview
Rob the Market here — diving into EUR/USD (“FIBRE”) with a bearish day-trade plan.
The 200 SMA is rejecting bull riders, and a SMA 786 breakout just slashed through dynamic support — giving us the green light for a downside play.
This setup runs on my signature “Thief Layered Strategy” — a professional-style, multi-entry approach that adds precision, reduces exposure, and keeps emotions cool.
💣 Trade Plan
Bias: Bearish ✅
Technical Confirmation:
• 200 SMA acting as key resistance — bulls got denied hard.
• SMA 786 breakout confirms bearish pressure.
• Dynamic support line flipped to resistance — trend favoring shorts.
🎯 Thief Layered Entry Strategy 💼
Instead of dumping one big order, this method spreads multiple sell-limit entries to scale in smartly as price develops.
💡 Why Layered Entries?
• Avoids premature entries in volatile moves.
• Smooths your average entry price for better R:R.
• Lets you add positions only when the market confirms your bias.
• Keeps the mind calm and the account safe — stealth moves only 😎
🔥 Example Layer Levels (Sell Limits):
First layer ➤ 1.16400 — initial resistance test zone.
Second layer ➤ 1.16200 — confirms rejection from 200 SMA.
Third layer ➤ 1.16000 — mid-zone entry, balanced risk.
Fourth layer ➤ 1.15800 — deep retrace trap entry, sniper fill zone.
🧠 Pro Tip: Adjust or add more layers depending on volatility and position size comfort. The Thief never rushes — he scales with patience.
🛡️ Stop Loss (Thief SL)
🔒 1.16800
Dear Ladies & Gentlemen (Thief OG’s): This is my thief-style stop, not a fixed rule.
Trade at your own risk — protect your loot before you rob the market! 🏦💨
💰 Target Zone (Thief TP)
🎯 1.14500 — major support zone + oversold levels + liquidity trap potential.
Perfect spot to escape with profits before the crowd catches on.
Again — this TP is flexible. The Thief exits quietly when the bag is full. 🤑
🔗 Related Pairs & Correlations to Watch
Keep your thief’s radar open for USD movement across majors:
• OANDA:USDCHF – Usually mirrors EUR/USD in reverse.
• FX:GBPUSD – Helps confirm overall USD strength or weakness.
• OANDA:EURGBP – Reveals EUR’s independent strength.
• TVC:DXY (US Dollar Index) – Strong DXY usually drags EUR/USD lower.
🔍 Key Points to Monitor
• Will the 200 SMA hold as resistance?
• Does the SMA 786 breakout retest fail or bounce?
• Volume + momentum alignment near entry layers.
• Any macroeconomic event shaking USD or EUR sentiment.
✨ “If you find value in my analysis, a 👍 and 🚀 boost is much appreciated — it helps me share more setups with the community!”
#EURUSD #Forex #DayTrade #ThiefStrategy #BearishSetup #LayeredEntries #SmartMoney #ForexCommunity #TradingViewIdeas #MetalsMarket #PriceAction

Is NZD/JPY Setting Up for a Perfect Swing Trade Setup?🥝💴 KIWI vs YEN: The Ultimate Profit Heist Plan! (Swing/Day Trade Setup)
📊 Asset Overview
NZD/JPY | New Zealand Dollar vs Japanese Yen
Current Market Context: Price recently trading around 86.50, with recent volatility showing moves between 86.49 and 88.50
🎯 Trade Setup: BULLISH Bias
🚀 Entry Zones (Pick Your Poison)
1st Entry: @ 87.500 and above
For the aggressive OGs who love catching momentum
2nd Entry: Pullback & Retest @ 85.500+ (ATR Zone)
For the patient masterminds waiting for the clean retest
💡 Flexibility Note: You've got freedom anywhere above these levels — trade what you see, not what you feel!
🛡️ Stop Loss Zones (Guard Your Gold)
1st Entry SL: @ 86.500
Tight stop for momentum entries
2nd Entry SL: @ 85.000 (ATR Pullback Protection)
Wider net for retest entries
⚠️ Risk Disclosure: These are reference levels only! Adjust your stop loss based on YOUR risk tolerance and account size. This is your capital, your rules — manage it wisely!
💰 Target Zone (Escape with the Loot)
Primary Target: @ 89.500
🎪 What's Waiting There?
Strong resistance confluence
Overbought conditions likely
Potential liquidity trap zone
🏃💨 Exit Strategy: Don't get greedy! When you see profits, TAKE THEM. The market gives, but it also takes back. Scale out, lock gains, and live to trade another day.
📌 TP Flexibility: This target is guidance, not gospel. If you're in profit and want to secure gains earlier, DO IT! Your profit, your choice.
🔗 Related Pairs to Watch (Correlation Game)
Keep an eye on these correlated moves:
OANDA:AUDJPY | Sister Oceanic pair — moves together with NZD/JPY about 85% of the time
OANDA:NZDUSD | Kiwi strength indicator — if NZD/USD is bullish, it supports NZD/JPY upside
FX:USDJPY | The Yen boss — if USD/JPY rallies, JPY weakness helps NZD/JPY climb
OANDA:EURJPY | Risk sentiment gauge — risk-on = JPY weakness = NZD/JPY support
💵 Why These Matter:
All JPY crosses move on risk sentiment. When global markets are risk-on (stocks up, optimism high), JPY weakens and pairs like NZD/JPY, AUD/JPY, EUR/JPY rise. When fear hits (risk-off), JPY strengthens and these pairs drop. Watch the broader Yen picture!
Key Correlation Points:
✅ Strong correlation with commodity currencies (AUD, CAD)
✅ Inverse correlation with safe-haven flows (Gold, Bonds)
✅ Positive correlation with equity markets (S&P 500, Nikkei)
🧠 Technical Context
Bias: Bullish structure intact
Key Support: 85.000-85.500 (ATR zone)
Key Resistance: 89.500+ (profit-taking zone)
Strategy: Buy dips, sell rips, manage risk!
⚡ The Thief OG Mindset
This isn't financial advice — it's a treasure map. You decide if you want to dig. The market doesn't care about your feelings, your bills, or your dreams. It rewards patience, discipline, and ruthless risk management. Trade smart, not hard!
✨ If you find value in my analysis, a 👍 and 🚀 boost is much appreciated — it helps me share more setups with the community!
📜 Disclaimer
This is a "Thief Style" trading strategy shared purely for educational and entertainment purposes. This is NOT financial advice, investment guidance, or a recommendation to buy/sell any asset. Trading forex involves substantial risk of loss and is not suitable for all investors. Past performance does not guarantee future results. Always trade with money you can afford to lose, use proper risk management, and consult with a licensed financial advisor before making any trading decisions. By viewing this analysis, you acknowledge that all trading decisions are your own responsibility. Trade at your own risk! 🎲
#NZDJPY #ForexTrading #SwingTrading #DayTrading #KiwiYen #ForexSignals #TechnicalAnalysis #PriceAction #RiskManagement #ForexStrategy #CurrencyTrading #JPYPairs #ForexIdeas #TradingSetup #ForexCommunity #MarketAnalysis #ForexEducation #ThiefStyle #SmartMoney #ForexLife

Derivatives and Hedging1. What Are Derivatives?
A derivative is a financial contract whose value is “derived” from an underlying asset.
The underlying can be:
Stocks
Indices (Nifty, Sensex, Dow Jones)
Currencies (USD/INR)
Commodities (gold, oil, silver)
Interest rates
Bonds
Cryptocurrencies
A derivative’s price depends on the price movement of these underlying assets.
Example:
If you buy a derivative contract on crude oil, the value of the contract changes with crude oil prices.
Derivatives are used for:
Hedging (reducing risk)
Speculation (betting on price movement)
Arbitrage (risk-free profit between markets)
Leverage (control large positions with small capital)
2. Why Derivatives Exist
Every market has uncertainty. Prices rise and fall due to:
Supply and demand
Economic conditions
Inflation
Geopolitical tensions
Monetary policies
Weather conditions (important in agriculture)
Derivatives allow traders and businesses to lock in costs and revenues, giving certainty and stability.
Example:
An airline uses derivatives to lock oil prices because fuel cost is a major expense.
A jeweller uses gold futures to secure gold price months in advance.
Thus, derivatives reduce uncertainty and protect profitability.
3. Major Types of Derivatives
There are four major types of derivatives:
3.1 Futures
A future is a legally binding contract to buy or sell an asset at a fixed price on a future date.
Features:
Traded on exchanges (NSE, BSE, CME)
Standardized contracts
Requires margin (not full payment)
Daily mark-to-market adjustments
Example:
Buying Nifty Futures at 24,000 means you commit to buy it on expiry at that price.
If Nifty rises to 24,500, you gain.
If falls to 23,500, you lose.
3.2 Options
An option gives you the right but not the obligation* to buy or sell an asset at a pre-decided price (strike price).
Two types:
Call Option – Right to buy
Put Option – Right to sell
Options buyers pay a premium, while sellers (writers) receive premium.
This is the most popular derivative instrument for hedging and speculation.
Example:
Buying a put option protects your stocks if the market falls.
This acts like an insurance policy.
3.3 Forwards
A forward contract is like a futures contract but traded privately (OTC – over the counter).
Features:
Custom agreements
Not exchange traded
Higher counter-party risk
Flexible terms
Used widely in:
Export/import business
Banks
Corporates managing currency and interest rate risk
3.4 Swaps
A swap is an agreement to exchange cash flows.
Most common types:
Interest Rate Swaps
Currency Swaps
Commodity Swaps
Example:
A company with a floating interest loan can swap it with a fixed rate to reduce risk.
4. What Is Hedging?
Hedging = Reducing or managing financial risk.
It involves taking a position in the derivative market opposite to your existing exposure.
The purpose is not to make profit, but to protect against loss.
Example:
If a farmer expects wheat prices to fall, he sells wheat futures to lock a price.
If a stock investor fears market correction, he buys put options for insurance.
Hedging is like:
Wearing a helmet while riding
Buying fire insurance for a factory
Airbags in a car
You hope not to use it, but you are protected when something goes wrong.
5. How Hedging Works (With Examples)
5.1 Stock Market Hedging
Suppose you have a portfolio worth ₹10 lakh and fear a short-term correction.
You buy a Nifty Put Option.
If the market falls:
Your portfolio loses value
But your put option gains
Losses get balanced
Your overall impact becomes minimal
This is called portfolio insurance.
5.2 Commodity Hedging
A gold exporter wants to lock selling price.
He sells gold futures at ₹62,000 per 10g.
If gold falls to ₹60,000:
He loses in physical market
Gains in future market
Net impact = protected revenue
5.3 Currency Hedging
An importer has to pay USD 1 million after 3 months.
He fears USD may rise and increase his cost.
He buys a USD/INR futures contract.
If USD rises:
He pays more in real world
Gains from USD futures
Total cost remains stable
5.4 Interest Rate Hedging
A company with floating-rate loans fears interest rates will rise.
Solution: Interest Rate Swap
They swap floating rate with fixed rate.
If rates rise, their cost stays fixed.
6. Why Hedging Is Important
Hedging ensures:
Stability of business profits
Predictable cash flows
Protection from catastrophic losses
Avoiding market shocks
Better planning and forecasting
In global markets, companies face:
Exchange rate volatility
Commodity price swings
Inflation
Interest rate fluctuations
Hedging becomes essential for survival.
7. Hedging vs Speculation
Aspect Hedging Speculation
Purpose Reduce risk Make profit
Risk Low High
Approach Opposite market position Same direction market bet
Used by Corporates, exporters, investors Traders
Profit Expectation Limited or none Unlimited potential
Hedgers use derivatives to protect themselves.
Speculators use derivatives to make gains.
Both together create market liquidity.
8. Advantages of Derivatives
Risk management
Price discovery
High liquidity
Low cost trading
Leverage enables big trades with small capital
Opportunity to short market easily
Global market linkage
Derivatives make markets more efficient and enable smoother functioning of financial systems.
9. Risks of Derivatives
While powerful, derivatives carry risks:
Leverage amplifies losses
High volatility
Complex structures
Counter-party risk in forwards
Regulatory risk
Potential for misuse
Over-speculation causing market stress
This is why exchanges enforce:
Margin systems
Position limits
Daily settlement
Strict surveillance
10. Role of Derivatives in Global Markets
Derivatives are vital for:
Managing global trade risks
Stabilizing prices for commodities like oil, gold, wheat
Supporting financial institutions
Allowing global investors to hedge international exposure
Facilitating cross-border capital flow
Every major economy relies on derivatives to maintain financial stability.
Conclusion
Derivatives and hedging are core pillars of modern finance.
Derivatives derive value from underlying assets and are used for hedging, speculation, and arbitrage.
Hedging protects against adverse price movements, offering stability to investors and businesses.
Though derivatives involve risks, proper use creates balance, efficient markets, and reduced uncertainty.
Whether you are an investor, trader, or business, understanding derivatives and hedging is essential for navigating today’s dynamic financial environment.

Hedge Fund Secrets in the World Trade Market 1. Information Advantage: The Core Hedge Fund Secret
The biggest hedge fund edge is not insider information (illegal), but information asymmetry—getting better data faster.
A. Alternative Data
Top funds purchase high-quality alternative datasets that retail traders don’t have access to:
Satellite imagery (counting cars in parking lots to estimate retail sales)
Shipping and cargo movement data
Social media sentiment analysis using AI
Credit card transaction data
Web-scraping of e-commerce prices
Weather and climate analytics (commodity trading)
These datasets reveal market trends weeks before they appear in official reports.
B. Faster News Pipelines
Whether through Bloomberg terminals, machine-reading of news, or proprietary data feeds, hedge funds receive market-moving information seconds or minutes before the public, increasing their edge in fast-moving markets.
2. Quantitative Models: The Math Behind Market Domination
Hedge funds rely heavily on quantitative trading, using statistical models to predict price movements across global markets.
A. Statistical Arbitrage
This method identifies price imbalances between related assets:
Pair trading (e.g., Coke vs Pepsi)
Mean reversion strategies
Baskets of correlated stocks
When prices deviate from historical relationships, quant funds place trades based on probability, not emotion.
B. Machine Learning Models
ML models recognize patterns invisible to human eyes:
Trend prediction using neural networks
Volatility forecasting
Natural language processing to analyze corporate statements
Large funds like Renaissance Technologies, Two Sigma, and DE Shaw have entire teams dedicated to maximizing machine intelligence.
C. High-Frequency Trading (HFT)
Some hedge funds use HFT to execute trades in microseconds using:
Colocated servers (physically placed next to stock exchange servers)
Ultra-low latency networks
Algorithmic order-routing
This allows them to profit from tiny price discrepancies millions of times per day.
3. Global Macro Strategy: Understanding Forces That Move the World
Global macro hedge funds study worldwide events to position trades across currencies, commodities, bonds, and equities.
A. Interest Rate Differentials
Funds constantly monitor central bank actions (Fed, ECB, BOJ, RBI).
For example:
If the US Federal Reserve is expected to cut rates → hedge funds buy risk assets.
If Japan keeps rates ultra-low → funds borrow yen and invest in higher-yielding currencies (carry trades).
B. Geopolitical Intelligence
Hedge funds track:
Elections
Wars and conflicts
Trade agreements
Economic sanctions
Oil supply disruptions
A sophisticated geopolitical model helps them anticipate market shocks before they fully unfold.
C. Commodity Cycles
Macro funds monitor:
OPEC decisions (oil)
Global demand–supply balance (metals)
Weather-based agricultural forecasts
They position trades in futures and options accordingly.
4. Liquidity Hunting: How Hedge Funds Trap Retail Traders
A key secret: hedge funds focus not on price, but on liquidity pools—areas in the chart where clusters of stop-losses and pending orders accumulate.
A. Stop-Loss Hunting
Retail traders place predictable:
Stop losses below support
Stop losses above resistance
Hedge funds accumulate positions by pushing price temporarily beyond these levels to capture liquidity before reversing the trend.
B. Fake Breakouts (Bull & Bear Traps)
Institutions intentionally create:
False breakouts above resistance
False breakdowns below support
This triggers retail entries, then the price sharply reverses.
C. Volume Absorption
When price stays flat but volume is high, hedge funds often absorb supply quietly before initiating a strong directional move.
5. Short Selling: Turning Market Fear into Profit
Hedge funds master the art of short selling—not just betting against stocks, but strategic short positioning.
A. Identifying Weakness
They analyze:
High debt companies
Fraud-suspected firms
Overvalued growth stocks
Firms with deteriorating fundamentals
B. Activist Short Selling
Some funds publish detailed reports exposing:
Accounting manipulation
Governance issues
Unsustainable debt structures
This causes panic selling and boosts their short-side profits.
C. Hedging Long Positions
Short positions often act as insurance against market crashes.
6. Multi-Asset Diversification: Trading Across the Entire World
The world market is not just stocks. Hedge funds trade:
Equities
Bonds
FX
Commodities
Crypto
Real estate derivatives
Volatility indices (VIX)
Carbon credits
Diversification allows them to profit in multiple sectors simultaneously, regardless of market direction.
7. Risk Management: The Most Important Hedge Fund Secret
Retail traders lose money because of emotional decisions. Hedge funds dominate because they follow rigorous risk frameworks.
A. Position Sizing Based on Volatility
Hedge funds adjust trade size based on:
Implied volatility
Historical volatility
Correlation risk
B. Stop-Loss Structures
They use algorithmically calculated stop levels, not emotional ones.
C. Scenario Analysis
Risk teams run simulations:
What if interest rates spike?
What if oil collapses?
What if a war breaks out?
Positions are adjusted long before crises occur.
D. Portfolio Hedging
They hedge portfolios using:
Options strategies
Futures contracts
Cross-asset hedges (e.g., long gold when equities look risky)
8. Leverage and Derivatives: Multiplying Profits
Hedge funds frequently use leverage in a controlled manner.
A. Using Derivatives for Exposure
Instead of buying stocks outright, they use:
Futures
Options
Swaps (especially total return swaps)
These instruments offer:
Higher leverage
Lower capital requirement
Tax advantages
B. Liquidity Leverage
Banks extend credit to hedge funds at low interest rates, allowing them to scale positions.
9. Behavioral Finance: Exploiting Human Emotions
Hedge funds track psychological patterns in retail traders:
Fear of missing out (FOMO)
Panic selling
Herd mentality
Overconfidence after a winning streak
Algorithms quantify these emotional patterns and trade against them.
10. Speed of Execution and Adaptive Strategy
The final hedge fund secret is adaptability. Retail traders stick to fixed systems, but hedge funds continuously:
Update models
Add new datasets
Monitor global correlations
Adjust stop losses based on volatility
Shift strategies when patterns stop working
Their flexibility allows them to thrive in constantly changing global conditions.
Conclusion
Hedge funds dominate the world trade market through a combination of:
Information advantage
Quantitative models
High-frequency trading
Global macro analysis
Liquidity manipulation
Derivatives mastery
Sophisticated risk management
Psychological understanding of retail traders
These are not illegal secrets—they are strategic, highly advanced methods enabled by money, technology, and expertise. By understanding these concepts, everyday traders can become smarter, avoid traps, and align their strategies with institutional thinking.

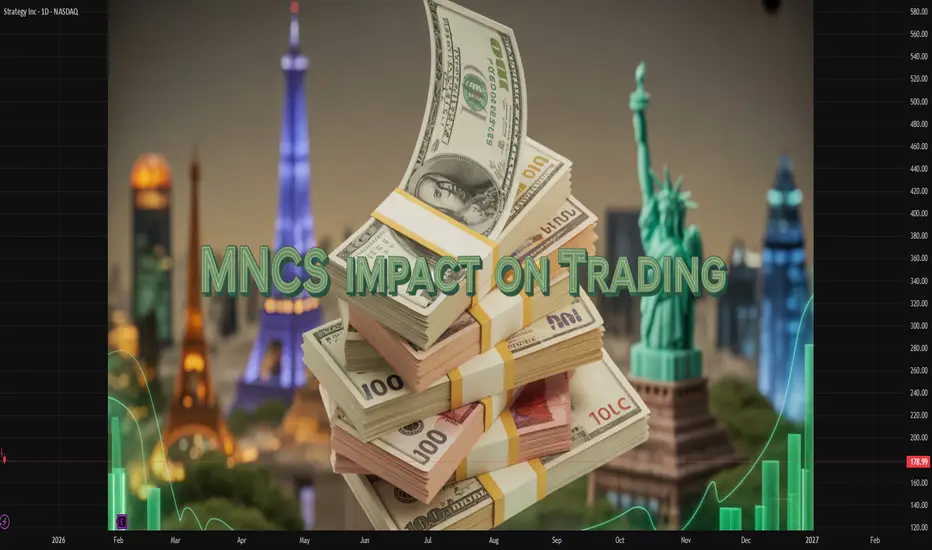
The Impact of Corporations on Global Trade1. Corporations as Engines of Trade Expansion
Corporations, especially MNCs, are central to the expansion of global trade. These organizations operate in multiple countries, producing and selling goods and services on a scale that often surpasses the capacity of national economies. By establishing subsidiaries and joint ventures in foreign markets, corporations increase trade flows both in imports and exports. For instance, a technology company headquartered in the United States may source components from Japan, manufacture products in China, and sell them across Europe, effectively linking multiple economies through a single corporate network. This activity not only boosts trade volumes but also diversifies market opportunities for smaller businesses that supply inputs to these corporations.
2. Supply Chain Integration and Global Value Chains
A critical way in which corporations impact global trade is through the development of global supply chains and value chains. Modern production processes are fragmented across nations, allowing corporations to optimize costs, access specialized skills, and leverage comparative advantages. For example, automotive companies often design vehicles in Europe, manufacture engines in Germany, assemble components in Mexico, and distribute finished products worldwide. These intricate supply chains have led to the emergence of Global Value Chains (GVCs), where value is added in different stages across multiple countries. This fragmentation increases cross-border trade in intermediate goods and services, significantly expanding global trade volumes.
3. Technology Transfer and Knowledge Dissemination
Corporations are key conduits of technology and knowledge transfer across borders. When a corporation invests in a foreign country, it often brings advanced production techniques, management practices, and innovation capabilities. This transfer of technology boosts the productivity and competitiveness of the host country, indirectly influencing trade by enhancing export potential. For example, foreign direct investment (FDI) by high-tech corporations in developing economies can enable local firms to adopt modern technologies, facilitating the production of export-quality goods and services. Consequently, corporations not only trade goods but also foster skill development and technological upgrading globally.
4. Market Creation and Consumer Demand Expansion
Corporations also shape global trade by creating new markets and stimulating consumer demand. Through strategic marketing, product localization, and brand recognition, corporations expand the reach of their products to international markets. This expansion often encourages other domestic and international suppliers to enter these markets, increasing trade activity. For instance, the entry of multinational consumer goods companies into emerging economies often introduces a range of new products and stimulates imports of raw materials, packaging, and equipment. This effect extends beyond mere consumption—it establishes long-term trade relationships between suppliers and corporate buyers worldwide.
5. Influence on Trade Policy and International Regulations
Large corporations often influence global trade policies and regulations. Through lobbying, strategic partnerships, and participation in international organizations, corporations can affect trade agreements, tariffs, and standards. For example, tech giants may lobby for reduced tariffs on electronic goods or for harmonized digital standards, thereby facilitating smoother cross-border trade. Their influence can also shape regulatory frameworks regarding intellectual property, environmental standards, and labor practices, which in turn affect how trade flows are structured globally. While this can accelerate trade liberalization, it may also create challenges for smaller firms that cannot navigate complex regulatory environments.
6. Economic Impact and Market Competition
Corporations’ impact on global trade extends to economic growth and market competition. By expanding into new markets, corporations generate employment, contribute to tax revenues, and foster industrial development. Increased competition from multinational entrants can encourage local firms to innovate and improve efficiency, raising the overall competitiveness of industries in different countries. However, this dominance can also concentrate market power, leading to monopolistic practices that may distort trade and limit benefits for smaller players. The balance between stimulating trade and maintaining fair competition is a critical aspect of corporate influence on the global economy.
7. Challenges and Criticisms
Despite their positive contributions, corporations’ role in global trade is not without criticism. Critics argue that MNCs can exacerbate economic inequality by extracting resources from developing nations without sufficient local reinvestment. They may exploit labor and environmental regulations to minimize costs, leading to social and ecological consequences. Additionally, the dominance of a few large corporations in key sectors, such as technology or pharmaceuticals, can limit market access for smaller firms and distort trade dynamics. Trade imbalances may also arise if corporations disproportionately favor production in low-cost countries while concentrating profits in high-income regions. Addressing these challenges requires international cooperation, responsible corporate governance, and equitable trade policies.
8. Future Trends and Evolving Corporate Roles
The role of corporations in global trade is evolving in response to technological innovation, geopolitical shifts, and sustainability concerns. The rise of digital platforms and e-commerce enables even small and medium-sized enterprises (SMEs) to engage in cross-border trade, challenging the traditional dominance of large corporations. Sustainability initiatives are pushing corporations to consider environmental and social factors in supply chains, potentially reshaping trade patterns toward greener practices. Moreover, geopolitical tensions, trade wars, and regional trade agreements are influencing corporate decisions on production locations and supply chain management, reflecting a more complex and strategic approach to global trade.
Conclusion
Corporations, particularly multinational ones, are fundamental drivers of global trade. They expand markets, integrate supply chains, transfer technology, and shape consumer demand, all of which amplify international trade flows. At the same time, they wield significant influence over trade policies and economic structures, generating both opportunities and challenges for global markets. While their operations contribute to economic growth and innovation, they also raise concerns regarding inequality, environmental impact, and market concentration. Understanding the multifaceted impact of corporations on global trade is essential for policymakers, businesses, and international organizations seeking to foster equitable, sustainable, and efficient trade systems. As global commerce continues to evolve, the role of corporations will remain central, shaping not only the movement of goods and services but also the broader economic landscape of the 21st century.

The Impact of Multinational Corporations (MNCs) on Trading1. Driving International Trade Growth
MNCs are major engines of global trade. By establishing operations in multiple countries, they create a demand for goods, services, and capital across borders. Their activities often lead to the creation of intricate global supply chains where raw materials, intermediate goods, and finished products move seamlessly between countries. For example, an automobile company headquartered in Germany may source parts from Japan, assemble vehicles in Mexico, and sell them in the United States. This not only increases the volume of trade but also diversifies trade patterns, creating new economic linkages between nations.
MNCs often promote exports from developing countries by investing in local manufacturing plants. This stimulates local economies, generates employment, and enables these countries to integrate into global markets. Countries like China, Vietnam, and India have benefited significantly from MNC-led trade, seeing their export sectors expand dramatically due to foreign direct investment (FDI) from multinationals.
2. Influence on Market Structure and Competition
MNCs can reshape trading markets by altering competitive dynamics. Their size, access to advanced technology, and global networks give them a competitive advantage over domestic firms. This can create efficiencies in production, logistics, and distribution, often resulting in lower costs for consumers. For instance, multinational retail corporations like Walmart or Amazon leverage economies of scale to offer goods at prices that domestic competitors may struggle to match.
However, MNC dominance can also lead to market concentration, where a few large players control significant shares of certain markets. This has implications for trade policies, as governments may feel pressured to create favorable conditions for MNCs to attract investment, sometimes at the expense of local businesses. Thus, while MNCs enhance efficiency and expand trade, they can also introduce competitive challenges for smaller domestic firms.
3. Shaping Global Supply Chains
The operations of MNCs often dictate global supply chain structures, which have a direct impact on trading patterns. Companies like Apple, Samsung, and Toyota rely on a network of suppliers and manufacturers spread across continents. These supply chains facilitate the cross-border movement of intermediate goods, raw materials, and components, which in turn drives international trade.
Moreover, MNCs play a critical role in setting global standards for quality, production, and logistics. By enforcing uniform standards across their global operations, they encourage trading partners to adopt similar practices, thereby enhancing trade efficiency and reliability. However, dependence on MNC-driven supply chains can also create vulnerabilities. For example, disruptions in one region—like a natural disaster or geopolitical tension—can impact global trade flows significantly, as seen during the COVID-19 pandemic when supply chains were severely affected.
4. Technological Transfer and Innovation in Trade
MNCs are often at the forefront of technological innovation. Through their international operations, they transfer knowledge, skills, and technologies to host countries, impacting trading patterns. For instance, a multinational in the electronics sector may establish a research and development (R&D) center in a developing country, equipping local talent with advanced technological know-how. This technology transfer often enhances local production capabilities, enabling these countries to produce goods for export that meet international standards.
Additionally, MNCs introduce advanced management practices, logistics solutions, and production techniques, which improve efficiency and productivity in trade operations. Over time, these innovations contribute to the growth of trade volumes and the development of competitive export sectors in host countries.
5. Impact on Foreign Exchange and Financial Markets
MNCs’ global operations have a significant influence on currency markets and international finance. Their cross-border transactions in goods, services, and capital flows impact foreign exchange demand and supply. For instance, a U.S.-based multinational importing raw materials from India would need to convert dollars into Indian rupees, thereby affecting currency exchange rates. Large-scale operations of MNCs can thus introduce volatility into foreign exchange markets, influencing trade competitiveness and pricing.
Furthermore, MNCs often participate in international capital markets through foreign direct investment (FDI), portfolio investment, or borrowing in foreign currencies. These activities facilitate global financial integration and enhance liquidity in international trade financing. Their investments can also affect trade balances by increasing exports from host countries or boosting imports to supply their global production networks.
6. Influence on Trade Policies and Agreements
Governments often design trade policies to attract or regulate MNC activity. Many countries offer tax incentives, reduced tariffs, and favorable regulatory environments to encourage MNC investments. Consequently, MNCs influence trade policies and international trade agreements. For example, the presence of MNCs in a country may motivate it to negotiate bilateral or multilateral trade agreements that facilitate smoother export and import flows.
Additionally, MNC lobbying can impact international trade rules, including labor standards, environmental regulations, and intellectual property protections. By shaping the regulatory environment, MNCs indirectly affect the flow of goods and services across borders, promoting trade liberalization in some cases while creating barriers in others.
7. Risks and Challenges Introduced by MNCs
While MNCs boost global trade, they also introduce challenges. Overreliance on multinational corporations can make countries vulnerable to global economic shocks, such as sudden shifts in investment flows or supply chain disruptions. The dominance of MNCs in certain sectors can stifle domestic entrepreneurship, reducing the diversity of trade sources. Additionally, ethical concerns related to labor practices, environmental sustainability, and profit repatriation can complicate trade relations.
Global trade is also affected by political tensions involving MNCs. For instance, disputes between home and host countries over taxation, tariffs, or sanctions can disrupt trade flows, highlighting the complex interplay between multinational operations and international commerce.
8. MNCs and the Future of Global Trade
Looking ahead, MNCs will continue to be central to trading patterns. Emerging technologies like artificial intelligence, blockchain, and automation will enable more efficient global logistics and trade tracking. MNCs will likely invest in sustainable and green supply chains, aligning with international environmental standards, which will influence the type of goods traded and the countries involved.
Moreover, geopolitical shifts, trade wars, and regional economic blocs will affect how MNCs structure their operations, creating new trade corridors while potentially reducing reliance on certain markets. Their strategic decisions will continue to have far-reaching implications for global trade, economic growth, and international financial stability.
Conclusion
Multinational corporations have fundamentally transformed international trade. By driving global supply chains, influencing market structures, transferring technology, and shaping trade policies, MNCs create opportunities and challenges for countries around the world. Their operations stimulate economic growth, expand trade volumes, and integrate emerging markets into global commerce. At the same time, their dominance introduces risks such as market concentration, supply chain vulnerabilities, and ethical concerns. Understanding the nuanced impact of MNCs is critical for policymakers, investors, and businesses seeking to navigate the complexities of global trade.
In essence, MNCs act as both facilitators and influencers of trade. Their strategies and decisions resonate across borders, shaping not only the flow of goods and services but also the broader economic and political environment in which international commerce occurs. As globalization evolves, the role of MNCs in trading will remain a defining factor in the architecture of the global economy.
Global Recession Impact on the Stock Market1. Decline in Corporate Earnings and Profit Margins
A recession directly reduces business activity. Companies face:
Lower consumer spending
Weak industrial output
Supply-chain disruptions
Reduced global trade
All these factors hurt corporate profits. Since stock prices are fundamentally based on future earnings, declining earnings expectations lead to falling stock valuations. Sectors dependent on discretionary spending—such as automobiles, luxury goods, travel, entertainment, and retail—tend to see the largest drops.
Industries like utilities, consumer staples, and healthcare experience comparatively less damage because demand remains steady even in downturns.
2. Sharp Stock Market Sell-Offs and Panic Reactions
Recessions amplify fear and uncertainty, triggering:
Panic selling
Liquidity crunches
Forced margin call selling
Flight to safety (bonds, gold, cash)
Investors prefer safe assets over risky equities. This results in broad market declines, often leading to bear markets—defined as a 20% or more drop in stock indices.
Historical patterns show:
2008 Global Financial Crisis: Markets fell 50–60%
2000 Dot-com Crash: Tech-heavy indices declined massively
2020 COVID Crash: Markets dropped 30% in weeks due to recession fears
Psychology plays a huge role. When investors anticipate economic pain, they exit the market rapidly, causing steep downward moves.
3. Rising Volatility and Unpredictable Market Behaviour
During a recession, stock markets experience extreme volatility. Indices can swing 3–8% in a single day as investors react to:
Policy announcements
Interest rate changes
Earnings warnings
Employment reports
Global news and geopolitical events
The VIX index, known as the “fear index”, typically shoots upward in recession periods, reflecting a sharp rise in market uncertainty.
4. Credit Tightening and High Borrowing Costs
Recessions often lead banks and financial institutions to become risk-averse. This causes:
Reduced lending activity
Higher interest rates for risky borrowers
Difficulty for companies to raise capital
Delayed expansion or investment projects
As finance becomes difficult to access, companies struggle to maintain operations, leading to declining stock prices. Financial sector stocks are heavily affected because loan defaults and credit stress increase during recessions.
5. Job Losses and Lower Consumer Spending Hit Market Sentiment
When unemployment rises, consumers reduce spending. This creates a chain reaction:
Lower sales → lower profits → lower stock prices
Businesses cut costs → more layoffs → weaker economy
Investor sentiment drops further
The stock market is extremely sensitive to consumer confidence. When the global population reduces spending, markets price in weaker future demand, causing indices to fall.
6. Currency Fluctuations and Emerging Market Instability
During global recessions:
Investors move money to safe-haven currencies like USD or CHF
Emerging market currencies weaken
Foreign investors withdraw capital
This capital outflow leads to:
Stock market declines in developing countries
Higher import costs
Interest rate hikes to stabilize currency
These factors further intensify stock market stress in regions dependent on foreign investment.
7. Commodity Price Crashes Hit Commodity-Based Markets
Demand for commodities—oil, metals, energy—drops sharply during recessions. This leads to:
Falling commodity prices
Significant declines in commodity-driven equity markets
Lower revenues for countries and companies dependent on raw materials
Energy and mining stocks especially suffer during global downturns.
8. The Role of Central Banks and Government Interventions
While recessions hurt markets, governments and central banks attempt to stabilize conditions using:
Interest rate cuts
Quantitative easing
Fiscal stimulus packages
Bank bailouts or liquidity injections
Such actions can provide temporary relief and may cause short-term market rallies, even during recessions. However, long-term recovery depends on the real economy improving.
Markets often respond positively to stimulus, but if the recession is deep, the rallies may be short-lived.
9. Shift from Growth Stocks to Value and Defensive Stocks
During recessions, investor preferences shift:
Growth Stocks (Tech, Startups, High-Risk Sectors)
Decline more sharply due to high valuations
Struggle with funding shortages
Reduced investor appetite for risk
Value and Defensive Stocks (FMCG, Utilities, Healthcare)
Hold value better
Provide dividends
Offer stability
Portfolio rotation becomes a major trend during recessions, influencing market behavior across sectors.
10. Long-Term Opportunities for Investors
While recessions cause fear and losses, they also create the best long-term investment opportunities. Historically:
Markets recover and hit new all-time highs after recessions
Quality stocks become undervalued
Long-term investors gain the most during recovery phases
Key benefits for disciplined investors include:
Lower entry prices
Higher future returns
Stronger long-term compounding
However, identifying fundamentally sound companies is crucial.
11. Slow and Uneven Recovery Across Sectors
Even after recession ends:
Some sectors recover quickly (technology, IT services, pharma)
Others take years (travel, real estate, heavy industries)
The recovery of stock markets does not always align with economic recovery. Markets often recover before the economy because they are forward-looking.
Conclusion
A global recession deeply affects stock markets through falling corporate earnings, reduced spending, rising job losses, tightening credit, and panic selling. Market volatility increases dramatically, and global liquidity dries up. Sectors linked to discretionary spending and commodities face the sharpest declines, while defensive sectors remain comparatively stable.
Although recessions cause fear and uncertainty, they also offer long-term buying opportunities. Markets eventually recover and grow beyond previous highs, rewarding patient, disciplined investors with strong returns.
Understanding these dynamics helps traders and investors navigate turbulent times with clarity, strategy, and confidence.

Role of International Trade1. Driving Economic Growth and Development
One of the primary roles of international trade is to accelerate economic growth. When countries engage in cross-border trade:
GDP increases due to higher production and export activities.
Foreign exchange earnings expand, allowing countries to import advanced goods and technologies.
Investment flows rise, as global investors look for new markets and opportunities.
Developing nations particularly benefit from increased exports of agricultural products, textiles, minerals, or manufactured goods. When these countries participate in global markets, they experience:
Higher income levels
Improved infrastructure
Better economic stability
Integration with global supply chains
Historically, trade-led growth has transformed economies like China, South Korea, and Singapore, demonstrating that global integration is a powerful engine for development.
2. Promoting Specialization and Comparative Advantage
International trade allows countries to specialize, producing goods and services they can create most efficiently. This concept is rooted in the theory of comparative advantage, proposed by economist David Ricardo.
For example:
India specializes in IT services, pharmaceuticals, and textiles.
Germany excels in automobile manufacturing and engineering.
Japan specializes in electronics and robotics.
Brazil is strong in agriculture and raw materials.
Specialization increases:
Productivity
Efficiency
Quality of goods
Global competitiveness
By focusing on strengths, nations produce more with fewer resources and trade for goods they cannot efficiently manufacture.
3. Expanding Markets for Businesses
Without international trade, companies are constrained by the size of their domestic markets. Trade opens access to billions of consumers worldwide, allowing firms to scale production, reduce costs, and increase profits.
Key benefits include:
Access to larger customer bases
Opportunity to diversify products
Increased brand recognition
Ability to compete globally
Export-oriented industries often grow faster than domestic-focused ones because they face greater demand and tougher competition, which boosts innovation and efficiency.
4. Generating Employment Opportunities
International trade creates millions of direct and indirect jobs across sectors such as:
Manufacturing
Agriculture
IT and services
Logistics and shipping
Banking and finance
Export industries usually require skilled and unskilled labor, increasing employment opportunities. Additionally, growth in trade-related sectors—port operations, customs, warehousing, and transportation—creates supply chain jobs.
In many developing countries, trade-driven manufacturing has pulled millions out of poverty by providing stable income and opportunities for skill development.
5. Encouraging Innovation and Technology Transfer
A key role of international trade is accelerating global technological advancement. When countries import technology-rich products such as machinery, robotics, medical devices, and software, they indirectly gain access to new knowledge and innovation.
Trade fosters:
Technology transfer, from advanced economies to developing nations
Improved industrial processes through imported machinery
Research and Development (R&D) investments driven by global competition
Multinational companies bring modern production systems, managerial skills, and digital tools to the countries where they operate. This accelerates industrialization and enhances productivity.
6. Enhancing Consumer Choice and Quality of Life
International trade dramatically increases the variety of products available to consumers. Without global trade:
Fruits like apples, kiwis, and oranges would be unavailable in many regions.
Electronics, automobiles, and smartphones would be far costlier.
Medicines and medical equipment would be limited.
Trade ensures:
Lower prices
Better product quality
Wider product variety
Continuous innovation
Competition from foreign producers forces domestic companies to improve their products and cut costs, benefiting consumers directly.
7. Strengthening Geopolitical and Diplomatic Relations
Trade is not just an economic tool but also a strategic instrument in international diplomacy. When countries engage in trade partnerships, they build political trust and cooperation.
Benefits include:
Stronger international alliances
Reduced chances of conflict due to mutual economic dependence
Increased cultural exchange
Collaborative agreements in defense, research, and environment
Institutions like the World Trade Organization (WTO), regional trade blocs (EU, ASEAN, NAFTA/USMCA), and bilateral agreements help maintain global economic stability.
8. Supporting Industrial and Infrastructural Development
International trade encourages governments to invest in:
Ports
Highways
Railways
Digital networks
Special Economic Zones (SEZs)
Warehousing and logistics facilities
These improvements not only boost export capacity but also strengthen domestic economic development. In many developing countries, international trade has driven major upgrades in transportation and communication infrastructure.
9. Reducing Production Costs through Global Supply Chains
Trade enables companies to source raw materials, components, and labor from countries where they are most cost-effective.
Examples:
Electronics manufacturers source chips from Taiwan, assembly from China, and components from Malaysia.
Automobile companies import spare parts from multiple countries.
Fashion brands source textiles from India and Bangladesh.
This interconnected global supply chain reduces production costs and enhances efficiency. It also allows companies to diversify supply sources, reducing dependence on any single country.
10. Promoting Economic Resilience and Diversification
Countries that rely heavily on a single industry or resource are vulnerable to economic shocks. International trade helps diversify economic activities.
For example:
Gulf countries are investing in tourism and manufacturing to reduce oil dependency.
African countries are moving from raw material exports to processed goods.
Asian economies balance IT services, manufacturing, and agriculture.
Diversification through trade strengthens economic resilience and reduces vulnerability to global price fluctuations.
Conclusion
International trade plays a foundational role in shaping the modern global economy. It drives economic growth, promotes specialization, increases innovation, and expands opportunities for businesses and workers alike. It enriches consumer choice, strengthens diplomatic ties, and promotes global economic stability.
For developing nations, international trade is a powerful engine for lifting populations out of poverty, modernizing industries, and integrating into global value chains. For advanced economies, it supports innovation, competitiveness, and continued prosperity.
In a rapidly globalizing world, the role of international trade is more significant than ever—linking nations, building economies, and shaping a more interconnected and prosperous global future.

GBP/CAD Upside Opportunity After Triangular MA Breakout⚡📈 GBP/CAD Bullish Structure Breakout – Multi-Layer Entry Blueprint for Smart Money Traders 🚀💹
📊 ASSET OVERVIEW
Asset: GBP/CAD “POUND VS CANADIAN DOLLAR”
Market: Forex Market 🌍
Style: Trade Opportunity Guide (Swing / Day Trade) ⏳📈
🚀 TRADE PLAN
Plan: Bullish plan confirmed with Triangular Moving average breakout 🔺📈 — strong continuation potential as long as structure holds.
Entry: Any price level.
PLEASE MENTION IN THE PLAN THIEF USING LAYER (OR) YOU CAN ANY PRICE LEVEL ENTRY ⚙️
Thief strategy is a using multiple limit orders (layering strategy style method of entries).
📌 Multiple Buy Limit Layers:
🟢 1.85300
🟢 1.85500
🟢 1.85700
🟢 1.86000
(You can increase limit layer based on your own)
🛡️ RISK MANAGEMENT
Stop loss: This is thief SL @ 1.85000 🚨
Dear Ladies & Gentleman (Thief OG's) Adjust your SL based on your strategy & own risk ⚠️💼
Note: Dear Ladies & Gentleman (Thief OG's) iam not recommended to set only my SL. its your own choice you can make money then take money at your own risk. 📝🤝
🎯 TARGET ZONE
Strong resistance + overbought + trap is there so kindly escape with profits.
🎯 Our Target: 1.88000 🏆💰
Note: Dear Ladies & Gentleman (Thief OG's) iam not recommended to set only my TP. its your own choice you can make money then take money at your own risk. 📌🔍
📌 RELATED PAIRS TO WATCH (Correlation & Key Insights)
1️⃣ GBP/USD ( FX:GBPUSD ) 🇬🇧💵
Tracks broad GBP strength.
If GBPUSD rallies, it supports bullish sentiment in GBPCAD.
USD weakness = extra lift for GBP pairs.
2️⃣ USD/CAD ( OANDA:USDCAD ) 💵🇨🇦
Direct CAD sentiment indicator.
If USDCAD climbs, CAD weakens → GBPCAD gets bullish fuel 🔥
Watch US news & oil prices.
3️⃣ GBP/JPY ( OANDA:GBPJPY ) 🇬🇧💴
Measures GBP momentum across the market.
Strong GBPJPY = strong GBP = GBPCAD upside confirmation.
4️⃣ CAD/JPY ( OANDA:CADJPY ) 🇨🇦💴
Shows CAD strength or weakness alone.
Bearish CADJPY usually means CAD is weak → bullish confidence for GBPCAD.
5️⃣ EUR/CAD ( OANDA:EURCAD ) 🇪🇺🇨🇦
Confirms broad CAD tone.
If EURCAD & GBPCAD both rise → CAD weakness across the board 💹.
📚 SUMMARY
This setup blends a structural breakout with multi-layer entries for precision and control. Layering = smoother drawdown, better position building, and improved overall consistency. Watching correlated pairs helps confirm CAD strength/weakness and supports clearer trade conviction 🔍📈.

Investing in the World Trade Market1. Understanding the World Trade Market
The world trade market is not a single unified marketplace. Instead, it consists of several interconnected segments:
Goods and Services
Countries trade products such as automobiles, electronics, oil, agricultural goods, and software services. Investors can participate through stocks, ETFs, or multinational companies involved in global trade.
Foreign Exchange (Forex)
Global currency trading supports international business. Investors participate to profit from exchange rate fluctuations driven by economic data, interest rates, and geopolitical events.
Commodities
Oil, natural gas, gold, silver, wheat, and other commodities are exchanged globally. Commodity markets are crucial because they influence trade balances, inflation, and corporate profitability.
Global Financial Markets
International stock markets, bonds, derivatives, and cross-border investment instruments allow investors to trade foreign assets.
Together, these components form the backbone of global commerce, offering multiple investment avenues.
2. Why Invest in the World Trade Market?
a. Diversification Beyond Domestic Borders
Investing globally spreads risk across countries and industries. When one nation faces recession, another may experience growth. Diversification helps protect capital from country-specific political or economic downturns.
b. Access to High-Growth Economies
Many emerging markets—India, China, Vietnam, Brazil, and African economies—offer rapid growth rates higher than developed countries. Investing early in these regions can yield substantial long-term returns.
c. Exposure to Global Brands
Companies like Apple, Toyota, Samsung, Nestlé, and LVMH operate across continents. Investors benefit from their global revenues and stability.
d. Currency Appreciation
Global investing exposes investors to foreign currencies. Gaining from strong currencies can multiply returns when converted back into the home currency.
e. Hedge Against Domestic Market Instability
If the domestic market faces inflation, political instability, or economic slowdown, global assets may provide stability.
3. Ways to Invest in the World Trade Market
Investors can participate globally in several ways depending on risk tolerance, knowledge, and financial goals.
a. International Stocks
Investors can buy shares of foreign companies through:
Direct foreign exchanges
Indian brokers offering global investment accounts
American Depositary Receipts (ADRs)
Global Depositary Receipts (GDRs)
This provides direct exposure to overseas corporations.
b. Exchange-Traded Funds (ETFs)
Global ETFs track:
Foreign stock indices (e.g., S&P 500, Nikkei, FTSE)
Global bonds
Emerging markets
Commodities
Multi-asset portfolios
They offer simplicity, diversification, and lower cost.
c. Forex Trading
Investors trade currency pairs like:
USD/INR
EUR/USD
GBP/JPY
Forex gives quick profit potential but carries high volatility and requires knowledge.
d. Commodity Investments
Investors can trade:
Gold and silver
Oil and natural gas
Agriculture (wheat, cotton, coffee)
Commodities are influenced by supply–demand dynamics, weather, geopolitical tensions, and global economic cycles.
e. Global Mutual Funds
Mutual fund companies offer international and global schemes, allowing investors exposure without direct trading in foreign markets.
f. Investing in Multinational Corporations (MNCs)
Buying shares of companies heavily engaged in global trade gives indirect access to world markets. These companies spread risk across continents and benefit from diverse revenue streams.
g. Digital Assets (Crypto)
Crypto markets operate globally and provide decentralized trading opportunities. However, they carry higher risk and require regulatory awareness.
4. Factors Driving Success in World Trade Investments
To succeed in the world trade market, investors must understand key global drivers.
a. Geopolitical Stability
Conflicts, trade wars, sanctions, or diplomatic tensions affect global markets. For example:
War can raise oil and gold prices.
Trade sanctions can reduce corporate profits.
Political instability disrupts supply chains.
b. Economic Indicators
Investors track:
GDP growth
Inflation
Interest rates
Employment data
Consumer spending
Countries with strong indicators attract foreign capital and generate higher returns.
c. Global Supply Chain Trends
Events like pandemics, port shutdowns, or semiconductor shortages create volatility. Understanding these trends helps investors position themselves better.
d. Currency Strength
A strong foreign currency boosts returns when converted back into the home currency. Conversely, currency depreciation can reduce profits.
e. Technological Advancements
Technology facilitates global trade through:
E-commerce
Digital payments
Blockchain logistics
AI-driven global analytics
Industries adopting modern innovations often grow faster.
5. Risks of Investing in the World Trade Market
While opportunities are high, global investing carries distinct risks.
a. Currency Risk
A profitable foreign investment could still result in loss if the target country’s currency weakens relative to the investor’s home currency.
b. Geopolitical Risk
Wars, coups, border disputes, and political changes can disrupt markets.
c. Regulatory Differences
Each country has unique taxation rules, trading restrictions, and compliance standards.
d. Economic Instability
Recessions, inflation, or corporate bankruptcy in foreign nations can negatively affect investments.
e. Liquidity Risk
Some international markets lack trading volume, making it hard to buy or sell assets quickly.
f. Information Gap
Investors may not fully understand foreign markets due to language, cultural, or informational barriers.
Understanding and mitigating these risks is crucial for long-term success.
6. Strategies for Smart Global Investing
a. Research Countries Before Investing
Consider:
Economic strength
Growth potential
Political stability
Currency trends
Market regulations
b. Diversify Across Regions
Spread investments across:
Developed markets (USA, Europe, Japan)
Emerging markets (India, Brazil, Indonesia)
Frontier markets (Africa, Vietnam)
c. Use Global ETFs for Beginners
They provide:
Automated diversification
Low cost
Easy access
Reduced risk
d. Hedge Currency Exposure
Some global funds offer currency-hedged versions to minimize exchange-rate risk.
e. Keep a Long-Term Perspective
Global markets move slower than domestic ones but yield stable, compounding returns over time.
f. Stay Updated with Global News
Monitor:
Trade agreements
Economic releases
Interest-rate decisions
Commodity price movements
Being informed helps anticipate trends earlier.
7. The Future of the World Trade Market
The next decade will transform global investing due to:
Rise of digital currencies
Expansion of India and Southeast Asia
Major shifts in manufacturing hubs
AI-driven global forecasting
Green energy and carbon-credit trading
Growth of cross-border fintech platforms
Global trade is becoming faster, more digital, and more interconnected, opening significantly larger opportunities for investors worldwide.
Conclusion
Investing in the world trade market allows investors to participate in the global economy, benefit from international growth, and diversify their portfolios beyond domestic boundaries. Although it comes with risks such as currency fluctuations, political uncertainty, and regulatory complexities, strategic planning, informed research, and diversification can help investors achieve strong long-term returns. As the world continues to integrate economically, global markets will increasingly influence investment outcomes, making world trade investing not only an opportunity but a necessity for modern investors.

AUD/JPY Market Outlook: Bullish Structure Still Intact AUD/JPY 🦘🇦🇺 vs 🇯🇵💴 | Bullish Kijun Pullback + LAYERED ENTRY Strategy (Swing/Day Trade)
🚀 TRADE OPPORTUNITY: BULLISH CONFIRMED
AUD/JPY is showing a strong bullish structure, with the price respecting the HULL moving average as dynamic support. We are looking for a pullback to layered demand zones for high-probability entries.
📈 TRADE PLAN: "THIEF" LAYERED LIMIT ORDER STRATEGY
This plan uses a multi-limit order ("layer") approach to average into the trend.
Entry Zones (Buy Limit Orders):
Layer 1: 101.500
Layer 2: 101.800
Layer 3: 102.000
Layer 4: 102.300 (You can add more layers based on your capital & risk)
👉 Entry Logic: Any price action confirmation (bullish engulfing, pin bar) at these levels adds confluence.
⛔ RISK MANAGEMENT (KEY TO SURVIVAL)
Stop Loss (Consolidated): Below swing low @ 101.000.
⚠️ IMPORTANT NOTE: This is MY strategic SL. YOU MUST adjust your stop loss based on your personal risk tolerance, account size, and strategy. Protect your capital first!
🎯 PROFIT TARGETS
Primary Target: 103.800 (Major resistance zone, prior structure, and potential overbought trap area).
💡 Smart Tip: Consider scaling out profits on the way up (e.g., at 102.800, 103.300) to secure risk-free trades.
⚠️ REMINDER: Take profits based on YOUR plan. Price may reverse early or extend further. Manage your trade actively.
🔍 RELATED PAIRS & MARKET CORRELATION (CRUCIAL FOR CONTEXT)
Watching these pairs helps confirm the broader trend and risk sentiment:
OANDA:AUDUSD & OANDA:NZDUSD (Risk Gauges):
Key Point: Strong AUD/USD supports a bullish AUD/JPY view. Weakness here may limit AUD/JPY upside.
FX:USDJPY & NASDAQ:JPY Index (JPY Strength):
Key Point: JPY is the funding currency. Broad JPY weakness (USDJPY ↑) is BULLISH for AUD/JPY. Watch for BoJ intervention rumors.
FOREXCOM:SPX500 or FX:US30 (Global Risk Sentiment):
Key Point: AUD/JPY is a RISK-ON pair. Rising stock markets typically fuel AUD/JPY rallies. A market sell-off could trigger safe-haven JPY buying, hurting this trade.
NASDAQ:IRON & CAPITALCOM:COPPER (AUD Commodity Driver):
Key Point: Strong commodity prices (Iron Ore/Copper) are fundamentally bullish for the Australian Dollar (AUD).
📊 TECHNICAL CONFLUENCE (Why This Works):
Trend: Higher Highs & Higher Lows on Daily/4H.
Support: HULL MA + Previous Swing Lows.
Strategy: Layered entries improve average price and reduce emotional trading.
👍 LIKE & FOLLOW if you find this detailed guide helpful!
🔔 Turn on notifications for my next "Thief Layer Strategy" update.
💬 Comment below with your entry level or questions!
#AUDJPY #Forex #TradingView #TradingIdea #SwingTrading #DayTrading #Ichomoku #Kijun #RiskManagement #LayerStrategy #ThiefStrategy #FX #AUD #JPY #TechnicalAnalysis

ETFs and Index Trading1. What Are ETFs?
An Exchange-Traded Fund (ETF) is an investment fund that trades on stock exchanges just like individual shares. It pools money from multiple investors and invests in a basket of assets such as:
Stocks
Bonds
Commodities
Currencies
A combination of multiple asset classes
An ETF aims to track the performance of a specific index, sector, commodity, or theme. For example:
Nifty 50 ETF tracks the Nifty 50 index
S&P 500 ETF tracks the S&P 500
Gold ETF tracks gold prices
Bank ETF tracks banking sector stocks
Because ETFs trade like stocks, you can buy and sell them throughout market hours at real-time prices.
2. Key Features of ETFs
A. Diversification
Instead of buying many stocks individually, investors get instant diversification through one ETF.
For example, a Nifty ETF gives exposure to 50 major Indian companies at once.
B. Liquidity
ETFs can be bought and sold anytime during market hours. Their liquidity depends on the trading volume and the liquidity of underlying assets.
C. Low Cost
ETFs usually have lower expense ratios than mutual funds, mainly because most are passively managed.
D. Transparency
ETFs disclose their portfolios daily, so investors know exactly what they own.
E. Flexibility
Investors can use ETFs for:
Long-term investment
Short-term trading
Hedging
Sector rotation
Commodity exposure
3. Types of ETFs
A. Equity ETFs
Track stock indices such as:
Nifty 50
Sensex
S&P 500
Nasdaq 100
B. Bond ETFs
Invest in government or corporate bonds. These offer lower volatility and predictable income.
C. Commodity ETFs
Track commodities such as gold, silver, crude oil, and natural gas.
D. Sector and Thematic ETFs
Focused on specific sectors like:
Banking
Pharma
IT
Or themes like:
EV (Electric Vehicles)
Renewable energy
Digital technology
E. International ETFs
Provide exposure to global markets without currency complications.
F. Leveraged and Inverse ETFs
Used mainly by advanced traders:
Leveraged ETFs amplify index returns (2x or 3x)
Inverse ETFs move opposite to index direction
4. How ETFs Work
An ETF is created through a process involving:
Asset Management Company (AMC)
Authorized Participants (APs)
Market Makers
The AMC creates ETF units by assembling a portfolio of securities that replicate an index. APs ensure that ETF price stays close to the NAV by arbitrage.
5. What Is Index Trading?
Index trading involves buying and selling financial instruments that track major stock indices like:
Nifty 50
Bank Nifty
Sensex
S&P 500
Dow Jones
Nasdaq 100
Instead of trading individual stocks, traders speculate on overall market direction using:
Index Futures
Index Options
ETFs
Index Contracts for Difference (CFDs) in global markets
Index trading allows exposure to the broad market with a single trade.
6. Why Index Trading Is Popular
A. Reduced Stock-Specific Risk
Indices represent a basket of stocks; poor performance of one stock doesn't drastically affect the entire index.
B. High Liquidity
Major indices have extremely high trading volumes, ensuring smooth entry and exit.
C. Stable Price Movements
Indices are generally less volatile than individual stocks (though instruments like Bank Nifty can still be volatile).
D. Easy to Analyze
Indices react more to macro factors like:
GDP data
Inflation
Interest rates
Global market trends
This makes them easier to study compared to hundreds of stocks.
E. Ideal for Derivatives Trading
Most option traders prefer index options such as:
Nifty options
Bank Nifty options
FINNIFTY options
These contracts have:
Better liquidity
Lower manipulation
More reliable directional moves
7. ETFs vs Index Funds vs Index Trading
ETFs
Trade on exchanges
Real-time price changes
Good for traders and long-term investors
Index Funds
Work like mutual funds
Bought and sold at NAV
No intraday trading
Index Trading
Uses futures and options
More suited for active traders
High leverage
Higher risk
8. Strategies Using ETFs and Index Trading
A. Long-Term Wealth Building Using ETFs
Investors use:
Nifty 50 ETF
S&P 500 ETF
Nasdaq 100 ETF
for 10–20 year wealth creation.
Benefits include:
High return potential
Low cost
Passive investment
B. Short-Term Trading
Traders buy or sell ETFs based on:
Breakouts
Moving averages
RSI or MACD signals
Example:
Buy Nifty ETF when it breaks above 200-day moving average.
C. Hedging
If traders hold a portfolio of Indian stocks, they hedge by shorting:
Nifty futures
Bank Nifty futures
Inverse ETFs (outside India)
This protects against market crashes.
D. Sector Rotation
Traders switch between sector ETFs based on economic conditions:
Banking ETF during interest rate cuts
IT ETF when currency weakens
Pharma ETF during global uncertainty
E. Options Trading Strategies
Index options allow strategies like:
Straddle
Strangle
Iron Condor
Bull Call Spread
Bear Put Spread
These strategies help traders manage volatility and risk.
9. Risks in ETFs and Index Trading
A. Market Risk
ETFs reflect the broader market; if markets fall, ETF values fall.
B. Tracking Error
Sometimes ETFs do not perfectly replicate index movements due to:
Costs
Liquidity issues
Management inefficiencies
C. Liquidity Risk
Some thematic ETFs have low trading volumes.
D. Leverage Risk
Leveraged ETFs and index futures can magnify losses.
E. Volatility Risk
Index options traders face sudden moves due to global events.
10. Who Should Use ETFs and Index Trading?
ETFs Are Ideal For:
Long-term investors
Beginners
Those seeking diversification
Passive investors
Index Trading Is Ideal For:
Active traders
Options and futures traders
Short-term speculators
Hedge fund strategies
Conclusion
ETFs and index trading combine simplicity, diversification, liquidity, and flexibility—making them essential tools in modern financial markets. ETFs allow low-cost, long-term investment with broad exposure, while index trading offers high-efficiency strategies for short-term traders and professionals. Whether someone wants to invest passively for decades or actively trade market movements, understanding ETFs and index trading provides a strong foundation for smarter financial decisions.
