Forexsignal

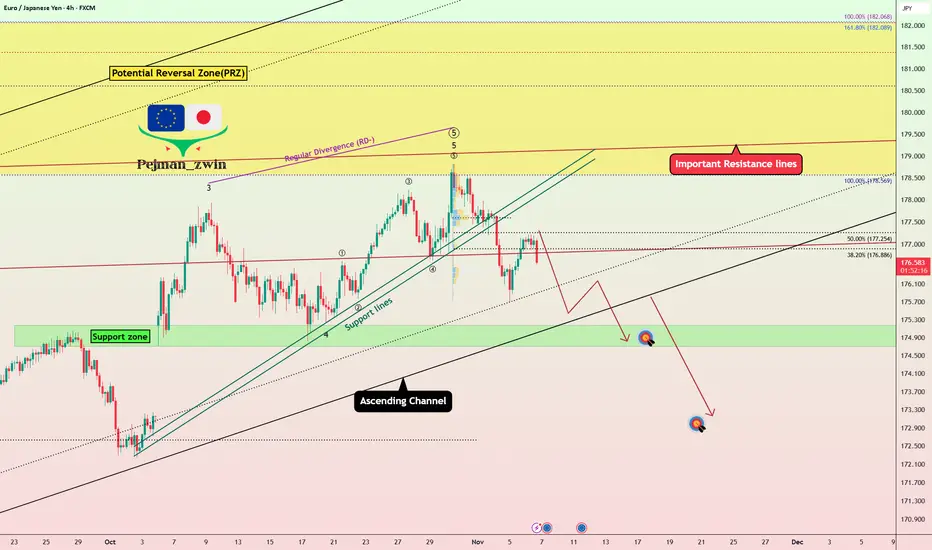
EURJPY Weakening Fast – Correction Phase Beginning!EURJPY ( OANDA:EURJPY ) started to fall nicely from the Potential Reversal Zone(PRZ) and important resistacne lines and managed to break the Support lines .
In the above timeframe, EURJPY is moving in an Ascending Channel .
In terms of Elliott wave theory , it seems that EURJPY has managed to complete the main wave 5 and with the break of the ascending channel , we can confirm the end of the main wave 5 . I see the beginning of the imminent corrective waves .
I expect EURJPY to decline at least to the Support zone(175.18 JPY-174.71 JPY) and lower lines of the ascending channel in the coming hours, and if the ascending channel breaks, the second target could be around 173.144 JPY .
Stop Loss(SL): 178.32 JPY
Please respect each other's ideas and express them politely if you agree or disagree.
Euro/Japanese Yen Analyze ( EURJPY ), 4-hour time frame.
Be sure to follow the updated ideas.
Do not forget to put a Stop loss for your positions (For every position you want to open).
Please follow your strategy and updates; this is just my Idea, and I will gladly see your ideas in this post.
Please do not forget the ✅' like '✅ button 🙏😊 & Share it with your friends; thanks, and Trade safe.
EUR/USD: Bearish Setup Confirmed After Head and Shoulders BreaksHi guys!
The chart shows a Three Drives pattern followed by a Head and Shoulders formation, both signaling potential bearish continuation.
The Three Drives Pattern:
The price completed three consecutive bullish drives, each showing signs of exhaustion. This structure often indicates a weakening uptrend and prepares the ground for a larger reversal.
The Head and Shoulders Pattern:
After the third drive, the market formed a clear head and shoulders structure, confirming distribution at the top. The neckline has already been broken, suggesting a shift from bullish to bearish sentiment.
Current Structure and Expectation:
Price is now retesting the neckline area after the breakdown. A rejection from this level would likely trigger a deeper decline toward the highlighted target zone, which aligns with previous demand and the flip area.
Target:
The projected target of the head and shoulders pattern falls near 1.12500, matching the lower pink zone on the chart.
In summary, unless the market decisively reclaims the neckline and trendline support, EUR/USD remains biased to the downside, with the 1.1250 area as the next key level to watch.
Disclaimer: As part of ThinkMarkets’ Influencer Program, I am sponsored to share and publish their charts in my analysis.

Gold bullI'm still bills on gold despite unexpected drop down respecting demand area highlighted in green ✅ but nerve-wracking though

ANFIBO | GBPUSD - I'm waiting for good entries BUY [11.6.2025]Hi guys, Anfibo’s here!
GBPUSD Analysis – W1 Trading Plan
Overall Picture:
GBPUSD continues to show a bearish-leaning structure on the higher timeframes as price compresses toward the end of a tightening wedge. Momentum remains weak, and the market has been respecting lower-high formations. The major resistance sits at 1.36–1.37, while downside supports align at 1.29 (50% Fibo), 1.27 (61.8% Fibo), and the key final support at 1.21. A weekly breakdown below 1.20–1.21 may trigger a much deeper sell-off. Until price reclaims major resistance, bearish setups remain favorable.
Trading Plan for Today:
>>> BUY ZONE:
(1) ENTRY:
Entry: 1.27 – 1.295
SL: 1.265
TP: 1.35 – 1.37
(2) ENTRY:
Entry: 1.2 -1.22
SL: 1.19
TP: (I will update late...)
Risk Management:
Risk only 1–2% per trade. Always keep a clear stop-loss and avoid adjusting it emotionally. Stay aware of high-impact UK and US economic events (BoE policy, CPI, employment data). Reduce leverage during volatile sessions and scale positions responsibly instead of going all-in.
Conclusion:
GBPUSD is still showing bearish pressure as it drifts closer to key supports, and sellers remain in control unless the market can break above the 1.36–1.37 resistance zone. Today’s plan favors short setups from premium values with clearly defined stops and targets. Maintain discipline and let the market come to your levels.
HAVE A NICE DAY, GUYS!

EURUSD Technical Setup – Bullish Move Incoming?EURUSD ( FX:EURUSD ) is currently positioned near the lower line of a potential descending channel and is hovering around a Support zone($1.1542-$1.1514) . There's also a smaller descending channel that formed last week, which is something we should consider in our EURUSD analysis .
There's a Regular Divergence (RD+) between the two recent lows that EURUSD has made, which is a good sign of a possible reversal.
In terms of Elliott Wave theory , it appears that EURUSD has completed the main wave 5, with the main wave 3 being an Extended wave . A break of the upper line of the descending channel(small) could confirm the end of the main wave 5.
I expect that EURUSD could at least move up toward the next Resistance zone($1.1586-$1.1575) .
Second Target: $1.1597
Stop Loss(SL)= $1.14857
Please respect each other's ideas and express them politely if you agree or disagree.
Euro/U.S. Dollar Analyze (EURUSD), 1-hour time frame.
Be sure to follow the updated ideas.
Do not forget to put a Stop loss for your positions (For every position you want to open).
Please follow your strategy and updates; this is just my Idea, and I will gladly see your ideas in this post.
Please do not forget the ✅' like '✅ button 🙏😊 & Share it with your friends; thanks, and Trade safe.

Gold & Silver Outlook | Central Bank Buying & Correction (5 Nov)🟡 GOLD & SILVER MARKET ANALYSIS - November 05, 2025
Central Bank Buying:
Global central banks remain in accumulation mode after adding 1,000+ tonnes in 2024.
* China: 2,298t | India: 879t | Russia: 2,335t
* Emerging markets’ gold purchases +30% YoY, driven by de-dollarization and inflation hedging as USD reserves fall below 58%.
Silver Demand & Deficit:
* Industrial use hits 680M oz (+11% YoY) — a record.
* Solar PV: 232M oz | EVs: 90M oz
* Deficit: 215M oz — extending into 2025 as mine output stays flat.
📈 Outlook: Range $47–$55/oz, with potential breakout as green tech ramps.
ETF & Market Sentiment :
* Gold ETFs (GLD): +$3.6B inflows in Oct, but -$2.1B outflows in Nov on profit-taking.
* Silver ETFs: Mixed flows, cautious sentiment.
* Gold RSI: ~68 → short-term pullback risk.
* Forecast: Inflows could rebound in Q1 if Fed resumes easing.
Futures & Positioning :
* CME Gold OI: 528,789 contracts (+WoW)
* Implied Vol (Dec): 21.1% | Call/Put Bias: 60/40 (bullish skew)
* Silver Vol: ~25% — traders shifting to policy-driven long bets.
Macro Drivers :
* Fed: 25bps cut + hawkish tone (CPI 2.6%)
* U.S.–China Truce: Reduces tariffs, softens safe-haven demand.
* BRICS: Advancing gold-backed settlement systems.
* Dollar Share: Falls to 58% of global reserves.
Performance & Forecast :
* Gold: $3,941/oz | -1.5% today | +50% YTD
* Silver: $48/oz | -1.0% today | +66% YTD
📊 Projection: Gold eyes $4,400 | Silver targets $57 by mid-2026.
🕐 Astro Window (UK Time): 1:00 PM–4:30 PM bullish spike expected.
Bias : Short-term correction likely → overall bearish bias until supports retest.
Check chart for buying/selling levels.

XAUUSD 1H: Order Block and Liquidity Targets for Potential LongKey Observations:
Break of Structure (BOS): Price has recently broken below a previous low, labeled BOS (Break of Structure). This indicates a shift to a bearish market structure in the short term, often leading traders to look for a retracement before a continuation of the downtrend.
Order Block (OB): A crucial area is highlighted and labeled OB (Order Block). This is a zone where significant institutional selling or buying pressure is believed to have entered the market previously. In this context, the OB is a potential resistance/supply zone that the price may retest.
Liquidity ($$$): Two levels above the current price are marked with $$$. These represent liquidity pools, which are areas where stop-loss orders from short sellers or buy-stop orders from breakout traders are likely resting. Institutional traders often target these zones to fuel their own trades.
The first $$$ (around 3,990) is an immediate target or a minor swing high.
The second $$$ (around 4,010-4,015) is a higher target, representing a more significant swing high.
Proposed Trade Scenario: The solid black line and the dotted arrow show the projected price path:
A retracement (pullback) into the Order Block (OB) zone (around 3,960 - 3,975).
A reversal within or near the OB, leading to a rally (buy/long).
The price targets are the liquidity ($$$) levels.
Current Price Action: The price is currently around 3,937.83, which is below the main Order Block, suggesting the price has already reacted to the BOS and is deep into a decline. The anticipated setup is a counter-trend move (a bullish reaction after a bearish move) or a re-accumulation phase before a larger move.

Sell USDCHFSELL USD/CHF @ 0.80761
Target 1: 0.80500 (+26 pips)
Target 2: 0.80200 (+56 pips)
Stretch: 0.78650 (+211 pips)
Stop-Loss: 0.80950 (-19 pips)
Risk/Reward: 1:1.4 → 1:11
Time: Intraday / Hold to SNB data
Trail: Move to 0.80700 after +20 pips
Why Sell – 3 Clear Reasons
1. Price Action
• Overextended rally from 0.79 support; now testing 0.808 resistance (50-day EMA).
• Bearish correction forming after failed breakout above 0.81.  
• Weekly forecast: Pullback to 0.7865 support imminent. 
2. Indicators
• RSI(14): Overbought (~72) on 4H/daily, signaling reversal. 
• MACD: Bearish divergence (histogram fading).
• Trading signals: Multiple live SELL alerts targeting 0.80730.   
3. Fundamentals
• SNB: Hawkish stance (potential interventions) strengthens CHF vs. USD. 
• Fed: Post-NFP caution; USD overbought amid election risks (Nov 5).
• Yield gap narrowing: CHF bonds outperforming U.S. Treasuries.

EURUSD: Bearish Channel Continuation SetupHi guys!
The EURUSD pair continues to trade within a well-defined descending channel. This confirms that the broader market structure remains bearish.
Important Levels
Resistance Zone: 1.1535 – 1.1550
Resistance Line: Aligns with the top of the highlighted resistance zone and channel structure.
Support Zone: Around 1.1517
Market Context
Recently, the pair formed a bearish flag or pennant pattern following a sharp downward move, suggesting that sellers remain in control. The price has since retested the resistance zone, where bearish pressure is expected to re-emerge.
Trading Outlook
Bearish Scenario (Primary Bias):
If the price fails to break above 1.1578, the bias remains bearish. A rejection from this zone could trigger a continuation move toward 1.1517 and potentially extend lower along the channel’s bottom boundary.
Bullish Scenario (Alternative):
A clear breakout and close above the resistance zone and channel midpoint would invalidate the short-term bearish setup. I
Disclaimer: As part of ThinkMarkets’ Influencer Program, I am sponsored to share and publish their charts in my analysis.

XAU/USD 1H – Bearish Liquidity Sweep Toward BPR Zonepotential shift from a bullish (upward) to a bearish (downward) trend, outlining a clear trade entry area and target:
Prior Trend: The price action leading up to the structural change shows an upward move, indicative of a bullish phase.
Bearish CHOCH (Change of Character): This is the critical signal of a potential trend reversal. The price has broken below a previous significant Higher Low (HL), which signifies that the bulls are losing control and the market's 'character' is changing to bearish.
BOS (Break of Structure): In this bearish context, a Break of Structure would confirm the continuation of the new bearish trend by breaking a new Lower Low (not explicitly marked after the CHOCH but implied as the next step in a downtrend).
BPR (Balanced Price Range): This shaded zone marks a specific area where the price is expected to retrace to before falling further. A BPR is an area of overlapping Fair Value Gaps (FVGs) and acts as a high-probability supply/resistance zone where institutional sell orders are likely to be activated.
EQH (Equal Highs) / BSL (Buy-Side Liquidity): The line marked "EQH" (Equal Highs) is a liquidity target that was swept, suggesting the market cleared out buy stop-loss orders before initiating the main move down (liquidity hunt).
Target - SSS (Sell-Side Stop-loss Sweep / Sell-Side Liquidity): The final horizontal line marked "SSS" is the ultimate profit target. This area represents a pool of liquidity (stop-loss orders placed by traders who were short or who bought at that level) that the market is expected to hunt or "sweep" to fill large institutional sell orders.
In summary, the trade plan suggests:
Entry: A short (sell) trade within the BPR zone after the bearish CHOCH is confirmed.
Target: The lower SSS level.

GBP/NZD 4H Analysis – Premium Sell Setup FormingOn the 4-hour timeframe, we can see that GBP/NZD has bounced strongly from a daily support zone, showing a temporary retracement within the current bearish trend.
At the moment, price is pushing upward toward the 4H Fair Value Gap (FVG) area. This zone
aligns perfectly with multiple key confluences:
- FVG 4H acting as a potential imbalance area to be filled.
- Confluence with strong resistance zone.
- Between 61.8% and 79.8% Fibonacci retracement levels — a classic premium zone for short setups.
- A recent bearish EMA 50/100 crossover confirming bearish momentum remains intact.
Based on this confluence, my expectation is that price will likely move higher to fill the FVG and then reject from that zone, targeting the daily support level below.
It’s also important to note that the sell-side liquidity below daily support has not yet been taken — which suggests that market makers may push the price down to sweep that liquidity before any potential reversal.
📉 Trading Plan:
- Wait for price to reach the FVG / premium zone.
- Then look for a Change of Character (CHoCH) or bearish confirmation on the 5m or 15m timeframe before executing the sell position.
- If the price breaks above the FVG zone on 4H, the setup becomes invalid.
🎯 Target: Daily support zone / sell-side liquidity sweep
⚠️ Invalidation: Break and close above the FVG zone on 4H

(XAU/USD) Bullish Reversal Setup Toward $4,066 Target ZoneThis chart shows the 1-hour price action of Gold (XAU/USD). The price is currently around $3,997 and has bounced from a support trend line. Key support levels are marked at $3,914 and $3,866, while resistance is near $4,030. The chart suggests a potential bullish move toward the target buy zone around $4,066, following a possible retest of the trend line or support area before continuing upward.

EUR/USD: Bearish Pullback to 1.155?FX:EURUSD is flashing bearish signals on the 4-hour chart , where price is respecting a downward trendline with successive lower highs, indicating ongoing weakness and potential for further downside as sellers maintain control near the resistance zone. This setup points to a classic continuation pattern if the trendline holds as resistance.
Entry zone between 1.168-1.170 for a short position. Target at 1.155 near the support zone, offering a risk-reward ratio greater than 1:2.5 . Set a stop loss on a close above 1.1745 to protect against an upside break. Look for confirmation on a breakdown below the entry with rising volume, amid persistent USD strength over the EUR.
Fundamentally , this week features key GDP releases from the Eurozone (Q3 flash on October 29) and the US (Q3 advanced on October 30). Additionally, the upcoming meeting between Trump and Xi could lead to a US-China trade agreement or lack thereof, significantly impacting markets. 💡
📝 Trade Plan:
🎯 Entry Zone: 1.168 – 1.170 (short setup near resistance)
❌ Stop Loss: Close above 1.1745
✅ Target: 1.155 (support zone)
💎 Risk-to-Reward: Greater than 1:2.5, offering a high-quality short opportunity within the prevailing bearish trend.
What's your outlook on this setup? Drop your thoughts

XAGUSD – Liquidity Grab & Supply Rejection ScenarioThis chart illustrates a Smart Money Concept (SMC) outlook on Silver (XAGUSD) with key structural points:
Market Structure Breaks (MSB / BOS / CHOCH) highlighting shifts between bullish and bearish order flow.
Liquidity zones marked where prior highs/lows may attract orders.
Supply Zone (Be_BB) and Order Block (Be_OB) identified as potential reaction areas where price could face resistance.
Demand Zone Area (45.00–46.00) indicating a region of potential buying interest.
The projection visualizes a possible liquidity sweep above 48.45–49.64, followed by a bearish continuation into the demand zone.
All annotations are for educational and analytical purposes only, not financial advice.
Use this chart to study market structure, liquidity behavior, and institutional order flow concepts.

Potential bullish continuation?The US Dollar Index (DXY) is falling towards the pivot, which is a pullback support. It could bounce to the 1st resistance, which is in line with the 161.8% Fibonacci extension.
Pivot: 99.08
1st Support: 98.40
1st Resistance: 100.38
Disclaimer:
The above opinions given constitute general market commentary, and do not constitute the opinion or advice of IC Markets or any form of personal or investment advice.
Any opinions, news, research, analyses, prices, other information, or links to third-party sites contained on this website are provided on an "as-is" basis, are intended only to be informative, is not an advice nor a recommendation, nor research, or a record of our trading prices, or an offer of, or solicitation for a transaction in any financial instrument and thus should not be treated as such. The information provided does not involve any specific investment objectives, financial situation and needs of any specific person who may receive it. Please be aware, that past performance is not a reliable indicator of future performance and/or results. Past Performance or Forward-looking scenarios based upon the reasonable beliefs of the third-party provider are not a guarantee of future performance. Actual results may differ materially from those anticipated in forward-looking or past performance statements. IC Markets makes no representation or warranty and assumes no liability as to the accuracy or completeness of the information provided, nor any loss arising from any investment based on a recommendation, forecast or any information supplied by any third-party.

USDJPY constantly reaches its support and resistance USDJPY constantly reaches its support and resistance now its time to reached its support level that means shorts on usdjpy always put stoploss

EURUSD IS HEADING UPWARDS.. QUICK BUY TRADE!EURUSD is currently in an upward channel and is stuck in-between. There have been clear bullish signs such as the price breaking the resistance zone (the white line drawn on chart) .. the price has also bounced of the powerful support zone (the green trendline) and is now very likely to rebound up to the resistance zone (red line) - good buy trade.

QUICK BUY TRADE OPPORTUNITY FOR AUDUSDAUDUSD has broken a very powerful resistance level (red trendline).. and is very likely to test the next powerful resistance zone which is all the way up at 0.66600. great time to buy now (low risk high reward)

QUICK BUY TRADE OPPORTUNITY FOR EURUSD..EURUSD has broker a very powerful resistance level (red trendline).. and then it rebounded back to a powerful support level (green trendline). It tested the powerful support zone but couldn't break through and has clear signs of a small bullish move to the upside (the next resistance zone) Quick buy trade opportunity.

XAUUSD 4H Short Setup: Selling the FVG RetraceKey Observations:
Recent Structure: The price has experienced a strong move down (impulse leg) followed by a small retracement and then further downside movement. The overall momentum is currently bearish.
Fair Value Gap FVG: The key focus is the Fair Value Gap FVG, marked by the blue/gray box. This is an area of price inefficiency left behind during the strong bearish move. It typically acts as a target for price to retrace to before the dominant trend continues.
Setup Rationale: The analysis suggests the current price movement (around 4,064.9 will see a retracement higher (green arrow up) to fill the FVG and potentially touch the liquidity zone marked by the red box (often representing an optimal entry or order block within the FVG.
Trade Projection: After reaching this inefficiency zone ($\sim\text{4,085}$ to $\sim\text{4,105}$), the projection is for a strong bearish continuation (green arrow down), aiming for the downside target in the green shaded area 4,045.
Conclusion:This setup anticipates a bounce into resistance FVG zone before a continuation of the selling pressure. The core strategy is selling a retracement in a short-term bearish market.

gbpjpy sell signal. Don't forget about stop-loss.
Write in the comments all your questions and instruments analysis of which you want to see.
Friends, push the like button, write a comment, and share with your mates - that would be the best THANK YOU.
P.S. I personally will open entry if the price will show it according to my strategy.
Always make your analysis before a trade

XAUUSD H4: Bullish Order Block (OB) and FVG Analysis for Long ?Key Annotations and Concepts
CRT-H (Current Range Top - High): Key resistance or bullish target around $4,160.
CRT-L (Current Range Top - Low): Key support or bearish target around $4,040.
FVG (Fair Value Gap): The shaded gray area, a price inefficiency that price is often drawn to, currently around the $4,080 to $4,100 range.
CISD (Current Intermediate Swing Down): A local low around $4,060 acting as an intermediate support.
SMT (Smart Money Trap/Toolkit): The swing low that potentially trapped early sellers, leading to the subsequent rally.
OB (Order Block): This is the new key annotation. It points to the last bearish (red) candle before the significant move higher. An Order Block is an area where institutional traders are believed to have placed large orders, and it is a high-probability zone for price to retrace to and find support for a continuation of the trend. This OB is located just above the CISD and within the area that launched the rally.
Curved Arrow: Indicates the anticipated bullish direction towards filling the FVG and potentially targeting the CRT-H. The addition of the OB reinforces the idea that if price retraces further, this is a strong area of support before the anticipated upward move.
