XAUUSD: Bullish Continuation from Support Towards $4,402Instrument and Timeframe: The asset is Gold Spot / U.S. Dollar (XAUUSD). The timeframe is 4-hour (H4), which provides a view of short to medium-term price action.
Current Price Action: The price has recently experienced a strong rally, followed by a minor pullback and consolidation.
Support Zone: A horizontal zone, labeled "Support" (approximately between $4,280 and $4,320, although the price scale isn't fully visible on the left), has been identified. The projected price path shows the price testing this zone before potentially moving higher. This area likely represents a previous resistance level that has turned into support, or a strong area of buying interest.
Projected Move (Pattern): The chart illustrates a projected "pullback and continuation" pattern, often referred to as a "buy the dip" or "flag" pattern in a strong uptrend. The green arrow and subsequent curved line indicate an expectation for the price to drop slightly to the support zone, find buyers, and then reverse to continue the climb.
Target: A specific price level, labeled "Target" at $4,402.15, is marked by a blue dotted line. This is the projected price objective for the move following the bounce off the support.
Forexsignal

SELL EURUSD - Amazing low risk high reward trade!Based on our deep analysis we can see that EUR/USD will head to the downside. Great time to sell - it has broken major support levels + trends. It is also struggling to break past powerful resistance levels.

SELL EURUSD - perfect low risk high reward tradeBased on our deep analysis we can see that EURUSD will head to the downside. Great time to buy - it has broker major support levels + trends.

SELL EURUSD - Perfect low risk high reward tradeBased on all our deep analysis and research, we can see that EURUSD will drop to the downside. This is a great low risk high reward trade. SELL NOW

EURUSD Retest and Drop Bears Eye 1.14 ZoneEURUSD has broken down from its rising structure, with sellers now taking control after weeks of grinding price action. The failed retest of broken support turned resistance highlights that momentum has shifted, and the focus is shifting toward deeper downside targets. With the US dollar supported by sticky inflation risks and geopolitical tensions, the euro’s ability to recover looks limited in the near term.
Current Bias
Bearish – sellers are in control after the channel breakdown, with momentum favoring further downside.
Key Fundamental Drivers
US Dollar Strength: Sticky US services inflation and Fed hesitancy on aggressive cuts keep USD supported.
Eurozone Weakness: German and broader Eurozone data show sluggish growth, keeping ECB cautious.
Geopolitics: Tariff risks and global uncertainty favor the USD as a safe haven.
Macro Context
Interest Rate Expectations: Fed easing path is slowing, with sticky inflation potentially stalling rate cuts. ECB remains cautious with inflation still above target but growth faltering.
Economic Growth Trends: US data still resilient compared to stagnating Eurozone activity.
Commodity Flows: Higher energy costs remain a drag on the euro area’s trade balance.
Geopolitics: Trade tariffs and political tensions in the US and EU support the dollar’s defensive bid.
Primary Risk to the Trend
A dovish Fed surprise or significantly stronger Eurozone inflation data could weaken USD and trigger a corrective euro rebound.
Most Critical Upcoming News/Event
US CPI and Fed speakers will be critical for rate expectations.
Eurozone PMIs and German inflation data will guide the ECB outlook.
Leader/Lagger Dynamics
EURUSD often acts as a leader for broader USD moves, setting tone across USD majors. However, it currently behaves more like a lagger to Fed policy and US inflation dynamics, following rather than driving.
Key Levels
Support Levels:
1.1540 (near-term support)
1.1410–1.1400 (major downside target)
Resistance Levels:
1.1695 (broken support turned resistance)
1.1800 (upper rejection zone if retrace extends)
Stop Loss (SL): 1.1799
Take Profit (TP): 1.1400
Summary: Bias and Watchpoints
EURUSD bias is firmly bearish after breaking below its rising channel and rejecting resistance on the retest. With USD strength underpinned by sticky inflation risks and geopolitical tensions, sellers will likely remain in control unless the Fed pivots more dovishly. The key levels to watch are resistance at 1.1695 and 1.1800, with downside targets at 1.1540 and 1.1400. My trade plan favors short setups with SL around 1.1799 and TP at 1.1400, aligning technical breakdown with fundamentals. Unless Eurozone data surprises to the upside or the Fed softens tone, momentum stays with the bears.

XAUUSD: $4,400 Target Next! Gold Bull Run ContinuesKey Observations:
Massive Uptrend: The chart clearly displays a strong, multi-day uptrend, marked by a series of high-momentum green (bullish) candlesticks.
Recent Price Action: Price has recently surged, followed by a minor retracement (the most recent red candle), but remains near the top of the move. This indicates the primary momentum is still firmly to the upside.
Key Support/Demand Zones:Immediate Demand (Yellow Box): A small yellow box is marked around the $\$4,250$ area. This represents a very recent, short-term support or 'flip' zone where price broke out and could potentially retest before moving higher.Deeper Demand (Blue Box): A larger blue box (around $\$4,130$ to $\$4,190$) represents a more significant, underlying demand zone.
Projected Price Action: The hand-drawn path suggests a direct continuation with potentially only a minor dip:
The path shows a small pullback toward the $\$4,300$ area (not explicitly marked by a zone) or a brief sideways move.
The black arrow points to an anticipated strong push up to the final target, resuming the dominant uptrend without necessarily hitting the marked yellow or blue zones.
Target: A dotted blue line at $\$4,400.69$ is the clear final target for this trade setup.

GBPUSD Shooting Star Near Resistance Lines – Short Opportunity?Today, I want to share a potential Short opportunity on the GBPUSD ( FX:GBPUSD ) pair.
GBPUSD , as I expected in my previous idea , reached its target .
At the moment, GBPUSD has broken through a Support zone($1.340-$1.333) , but overall it is still moving within a Heavy Support zone($1.343-$1.313) and is near Resistance lines .
From a candlestick pattern perspective , it looks like GBPUSD is forming a Shooting Star near these Resistance lines .( To confirm the Shooting Star pattern, we need to wait until the end of the last 4-hour candle)
In terms of Elliott Wave theory , it seems that GBPUSD has completed wave 4 , and we should be looking for the start of wave 5 soon .
I expect GBPUSD in the coming hours to at least retest the 200_EMA(Daily) . If that breaks, the next target would be the Support lines , and if those support lines break, we could even see a move down to the Heavy Support zone($1.343-$1.313) .
Stop Loss(SL): 1.3412 USD
Please respect each other's ideas and express them politely if you agree or disagree.
British Pound / U.S Dollar Analysis (GBPUSD), 4-hour time frame.
Be sure to follow the updated ideas.
Do not forget to put a Stop loss for your positions (For every position you want to open).
Please follow your strategy and updates; this is just my Idea, and I will gladly see your ideas in this post.
Please do not forget the ✅' like '✅ button 🙏😊 & Share it with your friends; thanks, and Trade safe.

XAU/USD – Buyers Reclaim Structure, Targeting Liquidity Zone🔍 Market Context
After a strong Liquidity Sweep yesterday, gold has rebounded and formed consecutive Break of Structure (BoS) , confirming buyers are back in control.
The price has now filled the Fair Value Gap (FVG 4,191 – 4,202) and is heading towards the Sell Liquidity Zone 4,237 – 4,240 USD — where many sell orders and stop-losses from previous short positions are concentrated.
The current structure indicates strong upward momentum , however, the possibility of a pullback from this high liquidity area is noteworthy.
💎 Technical Analysis
Liquidity Sweep: Completed, clearing liquidity below 4,070.
FVG (Fair Value Gap): 4,191 – 4,202 → filled, confirming price balance.
Sell Liquidity Zone: 4,237 – 4,240 → potential resistance area, likely strong reaction.
OB Zone | Buy: 4,143 – 4,145 → nearby support, expected first reaction on price pullback.
OB Deep | Buy: 4,110 – 4,115 → deep demand zone, confluence with Premium Zone 4,156 – 4,118.
Overall Structure: The main trend remains bullish , with strong upward momentum but requires technical pullback for re-accumulation.
📈 Trading Scenarios
1️⃣ Main Scenario – Sell reaction at liquidity zone
When the price approaches the Sell Liquidity Zone 4,237 – 4,240 USD , observe candle reactions (rejection, bearish engulfing).
If confirmation signals appear, open short-term sell orders .
Target: OB Buy Zone 4,145 → 4,110 USD.
Stop Loss: above 4,245 USD.
➡️ This is a liquidity reaction setup, high probability when the market encounters resistance confluence with Fibonacci zone 0.786–1.0.
2️⃣ Alternative Scenario – Buy with trend from OB
If the price pulls back to the OB Zone 4,143 – 4,145 USD and shows clear reaction (strong rejection or minor structure break),
→ consider opening buy orders with the main trend .
Target: return to 4,200 → 4,235 USD.
Stop Loss: below 4,130 USD.
If the price drops further, the OB Deep Buy 4,110 – 4,115 USD will be the final “liquidity draw” zone for a new upward bounce.
⚠️ Risk Management
Avoid FOMO buying at 4,200+ as it is near the liquidity resistance zone.
Prioritize short-term selling at 4,237 if clear signals are present.
When price pulls back to OB, wait for reaction before buying, do not bottom-fish early.
💬 Conclusion
After completing the liquidity sweep, gold has confirmed a return to bullish structure with multiple consecutive BoS.
Currently, the price is nearing the liquidity zone 4,237 USD – a short-term pullback is highly likely.
The 4,145 – 4,110 USD area will be where buyers await reaction to accumulate orders and continue the medium-term uptrend.
👉 Reasonable Strategy:
Short sell at 4,237 USD if reversal signals appear.
Wait to buy at OB zone 4,145 – 4,110 USD when clear reaction occurs.

Bullish bounce off?NZD/CAD is reacting off the support level, which is a pullback support that aligns with the 23.6% Fibonacci retracement and could rise from this level to the upside.
Entry: 0.8031
Why we like it:
There is a pullback support that lines up with the 23.6% Fibonacci retracement.
Stop loss: 0.8013
Why we like it:
There is a pullback support that aligns with. the 61.8% Fibonacci retracement.
Take profit: .80969
Why we like it:
There is a swing high resistance that aligns with the 145% Fibonacci retracement.
Enjoying your TradingView experience? Review us!
Please be advised that the information presented on TradingView is provided to Vantage (‘Vantage Global Limited’, ‘we’) by a third-party provider (‘Everest Fortune Group’). Please be reminded that you are solely responsible for the trading decisions on your account. There is a very high degree of risk involved in trading. Any information and/or content is intended entirely for research, educational and informational purposes only and does not constitute investment or consultation advice or investment strategy. The information is not tailored to the investment needs of any specific person and therefore does not involve a consideration of any of the investment objectives, financial situation or needs of any viewer that may receive it. Kindly also note that past performance is not a reliable indicator of future results. Actual results may differ materially from those anticipated in forward-looking or past performance statements. We assume no liability as to the accuracy or completeness of any of the information and/or content provided herein and the Company cannot be held responsible for any omission, mistake nor for any loss or damage including without limitation to any loss of profit which may arise from reliance on any information supplied by Everest Fortune Group.

Gold Eyes New All-Time High
You said:
btcusd rinning 600+ pips in my direction . translate into german
ChatGPT said:
BTC/USD läuft mit über 600 Pips in meine Richtung.
You said:
translate it into spanish
ChatGPT said:
BTC/USD va con más de 600 pips a mi favor.
You said:
translate into russian
ChatGPT said:
BTC/USD движется в мою сторону более чем на 600 пунктов.
You said:
Ethusdt gone 350+bin my direction after touching fvg, nake ut professionals
ChatGPT said:
ETH/USDT moved 350+ pips in my direction after touching the FVG — a clean and professional move.
You said:
translate it into german
ChatGPT said:
ETH/USDT lief über 350 Pips in meine Richtung, nachdem es die FVG berührt hatte – eine saubere und professionelle Bewegung.
You said:
translate into russian
ChatGPT said:
ETH/USDT прошёл более 350 пунктов в мою сторону после касания зоны FVG — чёткое и профессиональное движение.
You said:
translate into spanish
ChatGPT said:
ETH/USDT se movió más de 350 pips a mi favor después de tocar la zona FVG — un movimiento limpio y profesional.
You said:
Uploaded image
analyze this chart describly and give suitable title
ChatGPT said:
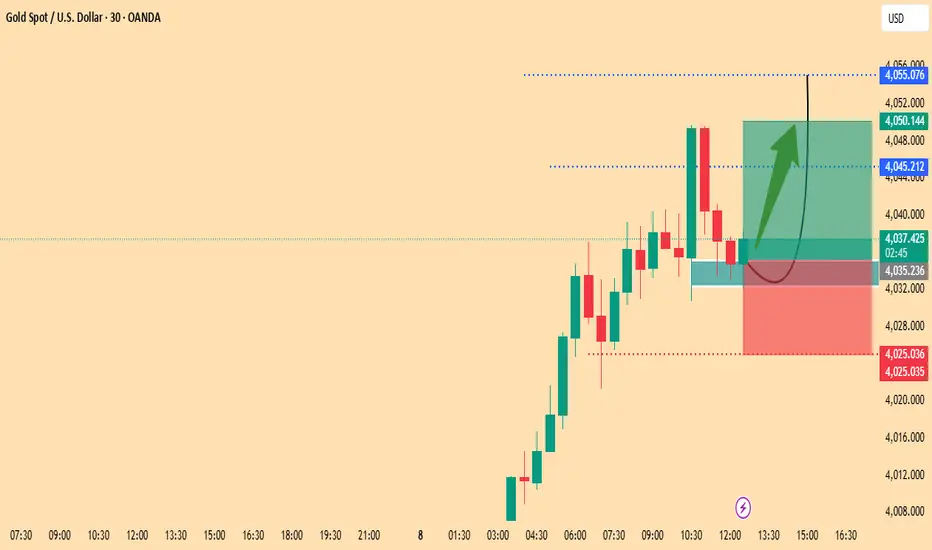
🟡 Chart Analysis: Gold (XAU/USD) — Daily Timeframe
Overview:
This chart presents a bullish continuation setup for Gold (XAU/USD) on the daily timeframe. The market has recently shown strong upward momentum, forming several large bullish candles after a period of consolidation.
Key Observations:
Recent Momentum:
A strong bullish rally has pushed the price upward, indicating renewed buyer interest and institutional activity.
Retracement Zone:
The highlighted green area represents a potential retracement or re-entry zone. Price is expected to pull back into this area before resuming its upward trajectory.
Stop Loss Placement:
The red zone beneath the retracement area marks the stop-loss level around $4,026, strategically placed below recent swing lows for risk management.
Target Level:
The target zone is aligned with the All-Time High (ATH) around $4,200, which serves as a key psychological and technical resistance level.
Projection Path:
The chart’s white and black arrows illustrate an expected bullish impulse–retracement–continuation pattern, suggesting the price may briefly correct before surging to new highs.

GBP/CAD 4HR Trendline Breakout Long Setup. Daily Continuation.I am going to be placing a trade once spread hour is over on the daily open on GBP/CAD to the upside.
Stoploss and take profit is provided.
I will be looking to trail my stoploss either at the 4HR or 8HR Lows as the trade progresses based on my own discretion.
Mostly likely will close the trade at the close of Tuesday daily candle if I feel this is the right decision to make.

NZDUSD possible bearish for 0.5630 & 0.5560#nzdusd forming daily lower highs & lower lows. price broke below 0.5755 which is monthly support level. wait for pullback to test supply zone for shorting to 0.5630. may split your into two positions, one may hold for0.5560. stop loss 0.5860

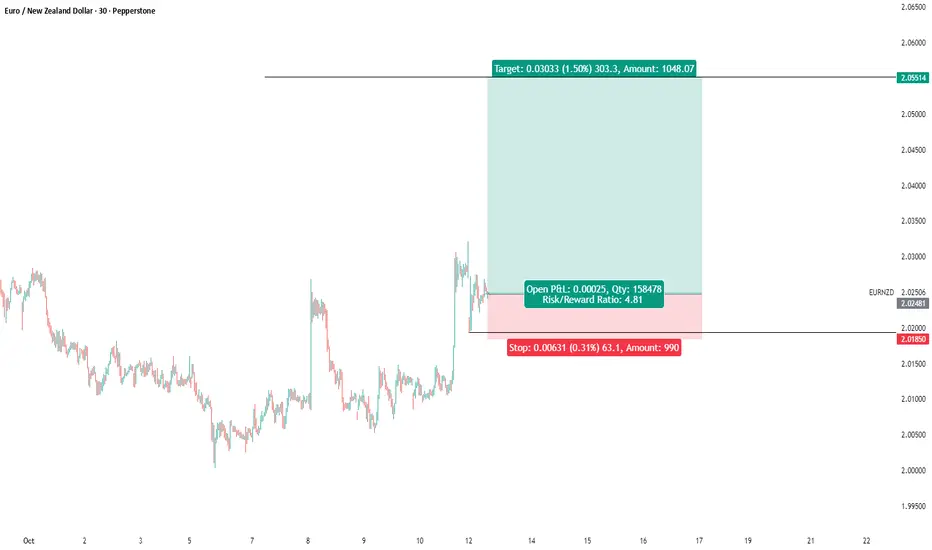
eurnzd buy signal. Don't forget about stop-loss.
Write in the comments all your questions and instruments analysis of which you want to see.
Friends, push the like button, write a comment, and share with your mates - that would be the best THANK YOU.
P.S. I personally will open entry if the price will show it according to my strategy.
Always make your analysis before a trade
XAUUSD Bullish Retracement Opportunity: Targeting $4,030 ?(XAUUSD) price action, focusing on a recent strong move and a potential reversal setup.
1. Key Price Action
Prior Uptrend: The chart shows a significant, powerful bullish move leading up to the $4,030–$4,040 area, evidenced by a series of large, green (bullish) candlesticks. This indicates strong buying pressure and momentum preceding the current segment.
Recent Sell-off/Correction: Following the high, the price experienced a sharp sell-off (red candlesticks), bringing it back down significantly.
Current Bounce and Retracement Area: The price has bounced off a lower area and is now currently trading around $4,012.48.
2. Proposed Trading Scenario (Technical Pattern)
The black and green arrow indicates a potential bullish reversal/continuation pattern:
Potential Retracement/Support Zone: The cyan-shaded rectangle, roughly between $3,990 and $4,005, appears to be a demand zone or a zone of prior support/resistance that the price is expected to re-test. The proposed path shows the price first pulling back to this zone before resuming its ascent.
Planned Trajectory: The indicated path suggests a "dip-buying" strategy, where a trader would wait for a pullback into the support/demand zone (the cyan box) and then enter a long position.
Target 1 (T1): $4,030.42: This is the immediate target, likely a re-test of a recent swing high or a key resistance level.
Target 2 (T2): $4,040.00: This is the secondary target, indicating an expectation for the price to break the first resistance and continue higher to test the ultimate recent high or the next significant resistance level.
3. Conclusion
The analysis suggests a bullish outlook in the short to medium term, following an initial retracement. The trading plan hinges on the cyan box holding as a key support/demand zone to facilitate a push back toward the recent high, aiming for new short-term highs at $4,030 and $4,040. This is a classic "buy-the-dip" setup within a broader context of strong upward momentum.

EUR/USD 4HR Trendline Breakout. Daily Continuation.I will be taking a long trade looking for further upside.
Trade management will be trailing stop loss below 4HR lows when I feel appropriate to do so based on my discretion.
Simple effective trading.

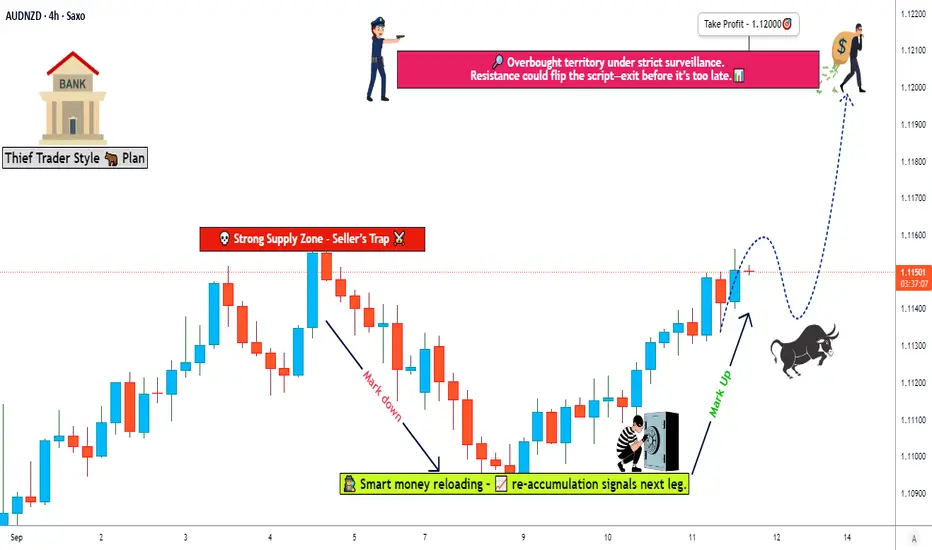
Will The Aussie Outperform The Kiwi This Week? (AUD/NZD)Title: AUD/NZD Heist: The Great Aussie-Kiwi Money Grab 🦘🥝💰
Forex Pair: AUD/NZD (Aussie vs. Kiwi)
Bias: Bullish (Swing Trade)
The Master Plan (The "Thief's" Blueprint) 👑
Ladies and Gentlemen, Thief OGs! 👋 Ready to execute a perfectly laid plan? We're looking for a bullish continuation on the AUD/NVD. The strategy is all about stealthy entries using a layered approach—because why enter all at once when you can average in like a pro?
Entry Protocol (The Layered Ambush) 🎯
We're setting multiple BUY LIMIT orders at key levels to build a strong position. Think of it as picking the lock instead of kicking the door down.
Layer 1: 1.11300
Layer 2: 1.11350
Layer 3: 1.11400
Layer 4: 1.11450
Layer 5: 1.11500
(You can add or adjust layers based on your own capital and risk appetite!)
Escape Route (Stop Loss) 🚨
Every good thief needs a clean exit. Place your stop loss below the recent structure to protect your capital.
Suggested SL: 1.11100 (Place after a confirmed breakout above our entry zone).
⚠️ IMPORTANT: This is MY stop loss. You MUST adjust your SL based on your own strategy and risk tolerance. Protect your capital at all costs.
Profit Zone (Take Profit) 🤑
The goal is to escape with the loot before the market cops show up! We're targeting a key resistance confluence.
Primary TP: 1.12000
Why? This area aligns with a moving average resistance, potential overbought conditions, and could be a trap for late bulls. Let's grab the money and run!
✨ Pro Thief Tip: Consider scaling out your position (e.g., 50% at 1.11850, 50% at 1.12000) to secure profits.
Related Pairs to Watch & Why ($) 🔍
AUD/USD ( OANDA:AUDUSD ): The Aussie's direct strength. A strong AUD/USD can fuel this cross.
NZD/USD ( OANDA:NZDUSD ): The Kiwi's direct strength. Weakness here can give AUD/NZD a boost.
USD/CNH ( FX:USDCNH ): A key proxy for Chinese economic health, which heavily influences the Australian Dollar.
**Correlation Key Point: This trade is essentially a bet on the AUD outperforming the NZD. Watch for relative strength/weakness in the two primary pairs ( OANDA:AUDUSD vs. OANDA:NZDUSD ).
Final Disclaimer / Risk Warning ⚠️
This is my personal analysis and not financial advice. I am not a licensed financial advisor. The "Thief" strategy is a metaphor for a layered entry system.
YOU are solely responsible for your own trades.
YOU must decide your own entry, stop loss, and take profit levels based on your risk management.
Trading forex involves significant risk and is not suitable for all investors. You can lose more than your initial investment.
✨ “If you find value in my analysis, a 👍 and 🚀 boost is much appreciated — it helps me share more setups with the community!”
#AUDNZD #Forex #Trading #SwingTrading #DayTrading #TechnicalAnalysis #AUD #NZD #TradingPlan
CBDCs in Global TradeThe Digital Currency Revolution Transforming International Commerce.
1. Understanding CBDCs: The Foundation of Digital Sovereign Money
A Central Bank Digital Currency (CBDC) is a digital form of a nation’s fiat currency issued directly by its central bank. Unlike cryptocurrencies such as Bitcoin or stablecoins like USDT, CBDCs are fully backed by the state and have legal tender status. They combine the stability of fiat currency with the efficiency of digital payment systems.
CBDCs can be retail (for everyday citizens and businesses) or wholesale (for banks and large financial institutions engaged in cross-border or interbank transactions). The core idea is to modernize money itself, bringing central bank-backed currency into the digital age.
Types of CBDCs:
Retail CBDC: Used by individuals and businesses for daily transactions, similar to digital cash.
Wholesale CBDC: Used for interbank settlements and large-scale trade or financial transactions.
For global trade, wholesale CBDCs play a more critical role, as they directly impact cross-border payments, trade financing, and settlements between international companies and governments.
2. The Need for CBDCs in Global Trade
The current global trade payment system relies heavily on a network of correspondent banks, SWIFT messaging systems, and foreign exchange intermediaries. While effective, it is slow, expensive, and prone to compliance and settlement risks. For example, an international trade transaction can take several days to complete, with high transaction fees and exchange rate fluctuations eroding profit margins.
CBDCs are designed to eliminate these inefficiencies. They enable instant settlement, reduce transaction costs, and allow for direct currency swaps between trading nations without the need for third-party intermediaries. This has massive implications for both developed and emerging markets.
Current Pain Points in Global Trade Payments:
High transaction fees due to multiple intermediaries.
Delays caused by time zone differences and banking hours.
Currency conversion risks and volatility.
Compliance and anti-money laundering (AML) challenges.
Limited access for smaller businesses in developing nations.
CBDCs aim to solve these challenges by creating a seamless, transparent, and programmable payment ecosystem that functions in real time.
3. How CBDCs Transform Cross-Border Trade
CBDCs can fundamentally change how imports, exports, and settlements occur between nations. By connecting central banks directly through digital networks, countries can bypass traditional systems and conduct instant, low-cost international settlements.
a) Faster Settlements
With blockchain or distributed ledger technology (DLT), CBDC transactions can be completed in seconds instead of days. This speed reduces liquidity needs and increases operational efficiency for exporters, importers, and financial institutions.
b) Reduced Currency Conversion Costs
CBDCs can enable direct currency exchange between two national digital currencies without involving an intermediary like the US dollar. For example, a trade between India and Singapore could use the digital rupee (e₹) and digital Singapore dollar (eSGD) for direct settlement.
c) Enhanced Transparency and Security
Every transaction made with CBDCs can be recorded on a secure digital ledger, ensuring full traceability and reducing the risk of fraud, money laundering, or trade-based financial crimes.
d) Programmable Smart Contracts
CBDCs integrated with smart contracts can automate payments upon fulfillment of trade conditions—such as delivery of goods, verification of documents, or customs clearance. This reduces disputes and increases trust in trade relationships.
4. CBDC Pilot Projects in Global Trade
Many nations are experimenting with CBDCs for cross-border trade. Some of the most advanced projects include:
a) China’s Digital Yuan (e-CNY)
China is leading the CBDC race with its digital yuan. It aims to internationalize its currency and reduce dependence on the US dollar in trade settlements, especially within the Belt and Road Initiative (BRI). The e-CNY has already been tested in Hong Kong and is being explored for cross-border trade in Asia and Africa.
b) Project Dunbar (BIS Initiative)
The Bank for International Settlements (BIS) collaborated with the central banks of Singapore, Malaysia, South Africa, and Australia to test a multi-CBDC platform. Project Dunbar demonstrated that multiple central banks could share a single platform for cross-border payments without needing intermediaries.
c) India’s Digital Rupee (e₹)
India’s Reserve Bank of India (RBI) launched pilots for the digital rupee, focusing on wholesale trade settlements between banks. In the future, India aims to use the e₹ for trade with friendly nations in Asia and the Middle East, reducing dependency on the US dollar.
d) Project mBridge
A collaboration between China, Thailand, Hong Kong, and the UAE, Project mBridge is one of the most promising multi-CBDC platforms. It aims to facilitate instant cross-border trade settlements among participating countries.
These experiments signal a major shift toward CBDC interoperability, where different nations’ digital currencies can seamlessly interact within a shared technological framework.
5. Geopolitical Implications: Redefining Economic Power
CBDCs have deep geopolitical consequences. For decades, the US dollar has dominated global trade and finance, giving the United States immense influence over international monetary policy and sanctions enforcement. However, with CBDCs, nations now have a tool to bypass the dollar-based system, reducing US leverage.
a) De-dollarization
Countries like China and Russia are exploring CBDCs to conduct trade directly with partners, avoiding SWIFT and dollar settlement systems. This could accelerate de-dollarization, reshaping global financial power dynamics.
b) Regional Trade Blocks
CBDCs could strengthen regional trade blocs like ASEAN, BRICS, and the EU, as members adopt interoperable digital currencies. For example, BRICS nations (Brazil, Russia, India, China, South Africa) are considering a common digital settlement platform for trade within the group.
c) Financial Sovereignty
CBDCs give countries more control over their monetary policy and international transactions, especially against the backdrop of sanctions, currency manipulation, and capital flight.
6. The Role of CBDCs in Trade Finance
Trade finance involves providing credit and payment guarantees to importers and exporters. Currently, it’s a complex system involving multiple banks, documentation, and intermediaries. CBDCs can simplify this by enabling instant, transparent, and programmable transactions.
Benefits in Trade Finance:
Real-time verification of documents and goods through blockchain.
Reduced paperwork via smart contracts and digital documentation.
Lower default risks due to traceable payment flows.
Easier compliance with KYC (Know Your Customer) and AML (Anti-Money Laundering) norms.
Financial institutions could use CBDCs to streamline letters of credit, escrow arrangements, and payment guarantees, making international trade faster and more reliable.
7. Challenges in Implementing CBDCs for Global Trade
Despite the immense potential, CBDCs also face several hurdles before they can become the backbone of international commerce.
a) Lack of Global Standards
Different countries are developing CBDCs using various technologies and regulatory frameworks, making interoperability a major challenge. A lack of common standards could lead to fragmentation in the digital currency ecosystem.
b) Cybersecurity Risks
CBDCs operate on digital infrastructure that is susceptible to hacking, cyberattacks, and data breaches. Ensuring strong cybersecurity measures is essential to protect national monetary systems.
c) Privacy Concerns
CBDCs can enable governments to monitor transactions in real-time, raising privacy and surveillance concerns among citizens and businesses.
d) Technological and Infrastructure Gaps
Developing countries with limited digital infrastructure may face difficulties in adopting CBDCs efficiently, creating digital inequality in global trade participation.
e) Monetary Policy Impacts
Widespread use of CBDCs could impact traditional monetary policy tools and potentially alter interest rate transmission and capital flows across borders.
8. The Road to Interoperability: A Global CBDC Network
The long-term goal of CBDC adoption in global trade is to achieve cross-border interoperability—the ability of one nation’s digital currency to transact seamlessly with another’s. Central banks and institutions like the BIS, IMF, and SWIFT are working on frameworks to make this possible.
Key Developments:
Multi-CBDC platforms such as mBridge and Dunbar.
Interlinking payment systems, like India’s UPI connected with Singapore’s PayNow.
Digital identity systems integrated with CBDCs for seamless verification.
A future global CBDC network could enable trade settlements that are instant, transparent, and secure, reducing friction and creating new efficiencies across supply chains.
9. The Future of CBDCs and Global Trade Dynamics
As CBDCs mature, we could see the birth of a new global payment architecture—one that is digital-first, decentralized, and less dependent on legacy banking systems. The implications will be profound:
Trade settlements could shift from the US dollar to regional CBDC pairs.
Emerging markets could gain greater participation in global trade.
Smart trade contracts could automate international logistics and compliance.
Real-time trade data could enhance transparency for governments and corporations alike.
Over the next decade, CBDCs could become as central to trade as shipping containers were to the globalization era.
10. Conclusion: A New Era of Digital Trade
CBDCs represent the next frontier of global finance and trade. They hold the power to make international commerce more efficient, inclusive, and transparent, while also challenging existing geopolitical and financial structures.
For businesses, this means faster payments, lower costs, and more predictable trade settlements. For governments, it means enhanced control and sovereignty over cross-border transactions. And for the world, it signifies the dawn of a digitally interconnected economy, where trade flows as seamlessly as information.
The rise of CBDCs is not just a technological evolution—it’s a monetary revolution. As nations continue to pilot and deploy these digital currencies, global trade is poised to enter a new era defined by speed, security, and sovereignty.

USDCHF possible bullish for 0.8165-70#usdchf made extreme low at 0.7873 on 1st July. After one and half month on 16th September price broker and closed below that support level to attract breakout sellers. 17th September formed a daily key reversal bar i.e. made a new low and closed off the high which is early and aggressive indication for trend reversal. 18th September daily insurance bar confirmed that was a fake breakout to trap sellers. first market caught stop losses of longer who placed their stop loss 0.7873.
Better to wait for correction to test daily demand zone i.e. 0.7968-46 for low risk & high reward trade setup. stop loss below 0.7920. Target might be 0.8165 but before this level there are some resistance levels before target price i.e. 0.8095, 0.8120 & 0.8165.

Tripple Top Silver now Traded at Triple top zone
51/52$ is supply zone.
So if not close weekly above this level
We seen side ways to Correction in silver
5 to 25% down side seen

GBP/JPY Short Setup. 4HR Trendline Breakout. Daily Continuation.On friday daily candle open I will be taking a short trade looking to capitalize on the 4HR trendline breakout.
My stoploss and take profit have been provided.
Management will be either close the trade at the end of friday daily candle or trail my stoploss above 4HR candle closure highs if I believe this is a good option to do so.
Simple trading.

EUR/USD – Buyers Holding the Mid-Channel SupportHello guys!
EUR/USD is still moving inside a clean ascending channel on the 4H chart. Price just bounced off the 1.1690–1.1700 support zone, which also lines up with the channel’s midline; a pretty solid area for buyers to step in.
As long as this zone holds, the bias stays bullish. If momentum continues, I’m looking for a move toward the 1.1760–1.1780 area, which is the top of the channel.
If price slips back under 1.1680, then this idea gets invalidated, and we could see a deeper pullback toward 1.1620.
For now, structure is intact, buyers are defending key levels, and the path of least resistance is still up.
Disclaimer: As part of ThinkMarkets’ Influencer Program, I am sponsored to share and publish their charts in my analysis.

GOLD Hello friends
Given that the price has reached the ceiling and recorded a new ceiling, we can expect a price correction. In this correction, we have identified important supports for you and it is expected that it will be able to succeed in setting a new ceiling.
*Trade safely with us*

Gold Retesting Support – Bullish Continuation ExpectedGold (XAU/USD) is showing strong bullish momentum after a brief consolidation around the support zone. Price is currently retesting the breakout level, indicating potential continuation toward the upper resistance area. The bullish engulfing candles and higher lows suggest sustained buying interest, favoring long positions above the support level.