EURUSD strong daily supply is playing out in August 2025EURUSD strong daily supply is playing out in August 2025
Daily downtrend. Imbalance #1, mentioned in the last updates, is still in control and is playing out well. Short positions should be managed.
Forexsignal

xauusd 1min scalpobserve this trade on 1min and 15min also. All the levels are on 15min and the blue level is on 4H. i observed that 15 minutes has volume, but is not able to break the range. observed on 1 minute how the market is reacting on 1 minute on levels then decided to short on 1min. here my strategy was the same as i use on 15min.

XAUUSDHello Traders! 👋
What are your thoughts on GOLD?
Gold remains trapped in a tight consolidation range between key support and resistance zones.
In the short term, the ongoing decline is expected to extend toward the support area, where a bullish reaction may occur.
As long as price stays within this range, the optimal strategy is to buy near support and sell near resistance.
A clear breakout above resistance or below support is needed to confirm the next directional move
Don’t forget to like and share your thoughts in the comments! ❤️

GBPAUD Wave 5 Setup: Breakout Toward Record Highs?Hey Realistic Traders!
Another Bullish Breakout Is Brewing , Could This Be the Next Big Move?
Let’s dive into the technical analysis to see what the chart is really telling us.
Technical Analysis
On the daily chart, GBPAUD has shown consistent support around the EMA200, with several rebounds confirming the strength of its broader bullish trend. During Wave 4, the pair consolidated into a Falling Wedge pattern . This type of formation often appears as a corrective phase within an uptrend, where selling pressure gradually weakens. The eventual breakout from the wedge signaled the end of Wave 4 and the beginning of a Wave 5 impulse move.
The breakout was further supported by strong momentum. A series of full-bodied bullish candlesticks reflected increasing buying appetite, while the MACD golden cross added confirmation to the bullish bias. Together, these factors strengthen the case for continuation of the prevailing trend.
In this scenario, the first upside target lies at 2.14854, a level that coincides with historical resistance and where a short-term correction could take place. Should bullish momentum persist, GBPAUD has the potential to extend higher toward 2.19473, which aligns with the Fibonacci 0.618 projection.
This bullish outlook will remain valid as long as price stays above 2.04151 . A move below that level would invalidate the setup and return the outlook to neutral.
Support the channel by engaging with the content, using the rocket button, and sharing your opinions in the comments below.
Disclaimer: "Please note that this analysis is solely for educational purposes and should not be considered a recommendation to take a long or short position on Nasdaq.

NAS100 BUY TECHNICAL ANALYSIS.nas100 buy technical analysis. price came down and touched support levels and now broke through this bear trend line. now the bear trend line will act as support all the way to resistance levels. gte vip breakout strategy!

Gold (XAU/USD) Short-Term Bearish Setup1. Well-Defined Resistance Zones
Two horizontal shaded areas labeled Resistance R1 and Resistance R2 mark zones near $3,360–$3,380, where price repeatedly failed to break higher.
Trading ideas from analysts on TradingView reinforce that the immediate resistance lies around $3,364–$3,370. As long as price stays below that, sellers remain in control
2. Descending Channel & Bearish Momentum
The chart highlights a shift from an earlier ascending channel (green), followed by breakdown and decline — a classic reversal from bullish to bearish.
In line with this, there’s also mention of a bearish flag pattern forming on the 30-minute (M30) timeframe, offering a potential shorting opportunity
3. Key Support Levels & Targets
Multiple support levels annotated: Support S2 (at two levels) and Support S3, with notable levels around $3,315, $3,301–$3,302, and $3,300.
The annotated price action indicates projected declines toward those levels—especially highlighting $3,314.94, $3,301.55, and $3,300.96 as intermediate and key targets.
Ultimately, the red “High support area” below suggests a broader demand zone, perhaps around $3,280–$3,300, where stronger support may emerge.
4. Trading Plan Illustrated
White arrows depict a descending trajectory: from current levels down to each support, suggesting a sell-on-rally approach.
Blue markers denote possible bounce points for pullbacks before continuation lower.
Broader Market Context
Gold prices have recently been tracking in the $3,330–$3,350 range, facing resistance near $3,350–$3,360 and support near $3,300. Analysts caution that a break below that could push it toward $3,245 or $3,150–$3,120
Overall momentum has turned cautious or bearish—bearish engulfing patterns, weakening rally strength, and below-average technical indicators emphasize the risk of further declines
Weak U.S. economic indicators or dovish signals from Fed officials (like Powell) could offer brief relief rallies; but failure to reclaim resistance may extend the slide
Key Levels at a Glance
Level Type Price Range Notes
Resistance ~$3,350–$3,360+ Strong ceiling—decline confirms bearish bias
Support S1 ~$3,315–$3,320 First potential reaction zone
Support S2 ~$3,301 Intermediate target for sellers
Support S3 ~$3,300 Psychological barrier; near high support zone
High Support Area ~$3,280–$3,300 Zone where bullish buyers might regroup
Conclusion
chart effectively captures a short-term bearish trend in gold (XAU/USD), showing:
Failed attempts to overcome resistance near $3,360.
A bearish flag breakout signaling potential continuation downward.
Clearly plotted support targets, with bounce zones drawn out.
A visual trade plan suggesting sell-on-rallies targeting declining support levels until reaching a strong demand zone.
To succeed with this setup, traders might wait for a brief rally into one of the identified sell zones (e.g. ~$3,314 or $3,325) before entering shorts, with stop-loss placements above the resistance areas and profit objectives aligned with support levels ($3,301 or near $3,300).

Strong daily supply level in control on EURUSDThere is a strong daily supply level in control on EURUSD the 19th of August 2025. Will the EURUSD drop much further. Hopefully it will.

USDJPY – DAILY FORECAST Q3 | W34 | D19 | Y25📊 USDJPY – DAILY FORECAST
Q3 | W34 | D19 | Y25
Daily Forecast 🔍📅
Here’s a short diagnosis of the current chart setup 🧠📈
Higher time frame order blocks have been identified — these are our patient points of interest 🎯🧭.
It’s crucial to wait for a confirmed break of structure 🧱✅ before forming a directional bias.
This keeps us disciplined and aligned with what price action is truly telling us.
📈 Risk Management Protocols
🔑 Core principles:
Max 1% risk per trade
Only execute at pre-identified levels
Use alerts, not emotion
Stick to your RR plan — minimum 1:2
🧠 You’re not paid for how many trades you take, you’re paid for how well you manage risk.
🧠 Weekly FRGNT Insight
"Trade what the market gives, not what your ego wants."
Stay mechanical. Stay focused. Let the probabilities work.
FX:USDJPY

AUDJPY – DAILY FORECAST Q3 | W34 | D19 | Y25📊 AUDJPY – DAILY FORECAST
Q3 | W34 | D19 | Y25
Daily Forecast 🔍📅
Here’s a short diagnosis of the current chart setup 🧠📈
Higher time frame order blocks have been identified — these are our patient points of interest 🎯🧭.
It’s crucial to wait for a confirmed break of structure 🧱✅ before forming a directional bias.
This keeps us disciplined and aligned with what price action is truly telling us.
📈 Risk Management Protocols
🔑 Core principles:
Max 1% risk per trade
Only execute at pre-identified levels
Use alerts, not emotion
Stick to your RR plan — minimum 1:2
🧠 You’re not paid for how many trades you take, you’re paid for how well you manage risk.
🧠 Weekly FRGNT Insight
"Trade what the market gives, not what your ego wants."
Stay mechanical. Stay focused. Let the probabilities work.
FX:AUDJPY

EURGBP – DAILY FORECAST Q3 | W34 | D19 | Y25📊 EURGBP – DAILY FORECAST
Q3 | W34 | D19 | Y25
Daily Forecast 🔍📅
Here’s a short diagnosis of the current chart setup 🧠📈
Higher time frame order blocks have been identified — these are our patient points of interest 🎯🧭.
It’s crucial to wait for a confirmed break of structure 🧱✅ before forming a directional bias.
This keeps us disciplined and aligned with what price action is truly telling us.
📈 Risk Management Protocols
🔑 Core principles:
Max 1% risk per trade
Only execute at pre-identified levels
Use alerts, not emotion
Stick to your RR plan — minimum 1:2
🧠 You’re not paid for how many trades you take, you’re paid for how well you manage risk.
🧠 Weekly FRGNT Insight
"Trade what the market gives, not what your ego wants."
Stay mechanical. Stay focused. Let the probabilities work.
FX:EURGBP

Interest rates are currently higher than necessary.The recent rise in inflation is mainly due to tariffs, which would put inflation at just 2%.
Kevin Grady, president of Phoenix Futures and Options, said interest rates are higher than they should be. He predicted the Fed would likely cut rates by 50 basis points unless inflation continued to rise. However, Grady said the recent rise in inflation was largely due to tariffs, and if that factor were excluded, inflation would be just 2%. He said this was just a one-time effect of the tariffs taking effect, not a long-term trend.
Regarding the gold market, Grady said the market is in a correction phase after last week's strong volatility. The price gap between futures and physical gold (EFP) jumped from $8 to more than $100 on July 21 due to tariff uncertainty. The gap later narrowed to $60 when the government confirmed that gold would not be subject to tariffs. Grady stressed that such large fluctuations make it difficult to trade physical gold, especially for banks and traders.

EUR/USD 1-Hour Rising Channel – Support Zone & Potential Upside!Chart Breakdown & Technical Insights
Rising Channel Structure
The chart clearly shows EUR/USD trading within a rising channel, marked by higher highs (red arrows) and higher lows (green arrows) forming parallel support and resistance trendlines.
Key Support Zone & Bounce Potential
The price is currently sitting near the ascending trendline support, highlighted by the shaded gray box and emphasized with a circled area. Many analysts note that this lower boundary—around the 1.1690 level—serves as crucial support on a broader time frame
.
Short-Term Momentum Indicators
According to recent technical calls, EUR/USD maintains a short-term bullish bias in the rising channel. However, some momentum indicators, such as RSI, hint at weakening strength—particularly when higher price highs are not matched with higher RSI peaks, suggesting a bearish divergence
Forex Crunch
.
Potential Upside Trajectory
Should the lower channel support hold, the chart suggests a rebound toward mid-channel or potentially up to the upper boundary. Analysts highlight the 1.1720–1.1750 area as a near-term resistance, with the upper channel boundary closer to 1.1850
Alternative Scenario – Breakdown Risk
If EUR/USD breaks below the channel (below ~1.1690), the bullish structure may falter. That could expose the pair to deeper pullbacks, possibly testing lower support levels around 1.1650 or lower
.
** Summary Table**
Scenario Likely Outcome
Bounce off support Move up toward mid-channel (~1.172) or channel top (~1.185)
Breakdown below support Decline toward lower support zones (1.1650 and below)
Conclusion & Strategy Snapshot
The price is positioned at a critical support within a well-defined rising channel.
The bullish favored path: a rebound from the lower trendline toward resistance levels.
The bearish risk: a breakdown would shift momentum, possibly leading to deeper retracements.
Monitor for price action signals (e.g. bounce, candlestick patterns), RSI behavior, and behavior around these key levels.

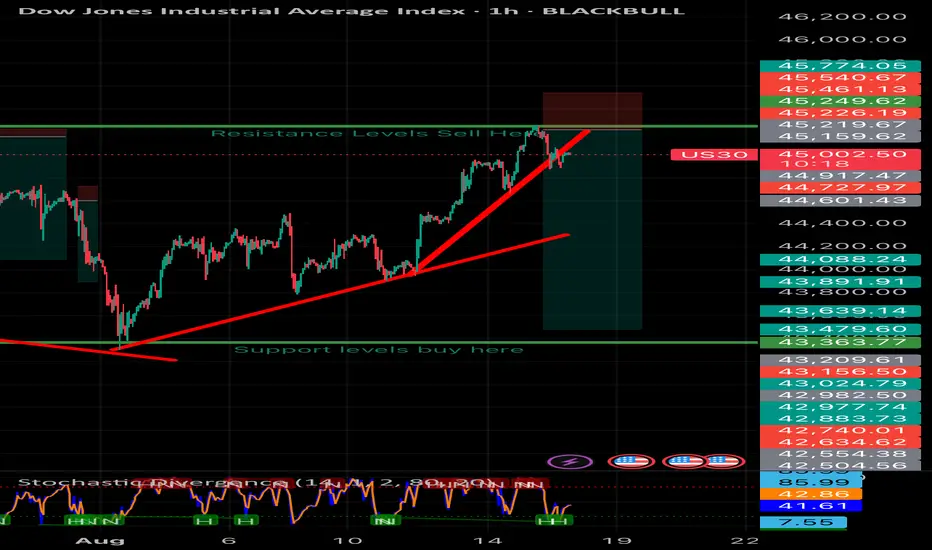
Us30 technical analysis US30 sell technical analysis. At a good trend line breakout opportunity where the trend line is now acting as resistance. We should see a strong breakout movement here to the down side.
Nas100 sell opportunity Nas100 technical analysis. Nas100 price recently reached an all time high. Price is at resistance levels and has also broke through upward trend line which is strong indicator that price will continue down to main support levels over the next week.

Us30 sell opportunity Us30 price reached all time high. Price is at resistance levels. Price should continue down to support levels. Sniper entry here.

AUDJPY – DAILY FORECAST Q3 | W33 | D15 | Y25📊 AUDJPY – DAILY FORECAST
Q3 | W33 | D15 | Y25
Daily Forecast 🔍📅
Here’s a short diagnosis of the current chart setup 🧠📈
Higher time frame order blocks have been identified — these are our patient points of interest 🎯🧭.
It’s crucial to wait for a confirmed break of structure 🧱✅ before forming a directional bias.
This keeps us disciplined and aligned with what price action is truly telling us.
📈 Risk Management Protocols
🔑 Core principles:
Max 1% risk per trade
Only execute at pre-identified levels
Use alerts, not emotion
Stick to your RR plan — minimum 1:2
🧠 You’re not paid for how many trades you take, you’re paid for how well you manage risk.
🧠 Weekly FRGNT Insight
"Trade what the market gives, not what your ego wants."
Stay mechanical. Stay focused. Let the probabilities work.
FX:AUDJPY

EURUSD Bears Ready to Take ControlEURUSD( FX:EURUSD ) is currently trading in a Heavy resistance zone($1.1815-$1.1602) and near the Resistance lines and Potential Reversal Zone(PRZ) .
In terms of Elliott Wave theory , it seems that EURUSD has completed a corrective wave. The corrective wave has a Zigzag Correction(ABC/5-3-5) structure .
Also, we can see the Regular Divergence(RD-) between Consecutive Peaks .
I expect EURUSD to decline at least to the Support zone($1.1642-$1.1578) .
Second Target: Monthly Pivot Point = $1.15491
Note: Stop Loss(SL)= $1.1803
Please respect each other's ideas and express them politely if you agree or disagree.
Euro/U.S. Dollar Analyze (EURUSD), 1-hour time frame.
Be sure to follow the updated ideas.
Do not forget to put a Stop loss for your positions (For every position you want to open).
Please follow your strategy and updates; this is just my Idea, and I will gladly see your ideas in this post.
Please do not forget the ✅' like '✅ button 🙏😊 & Share it with your friends; thanks, and Trade safe.

USDJPY – DAILY FORECAST Q3 | W33 | D14 | Y25📊 USDJPY – DAILY FORECAST
Q3 | W33 | D14 | Y25
Daily Forecast 🔍📅
Here’s a short diagnosis of the current chart setup 🧠📈
Higher time frame order blocks have been identified — these are our patient points of interest 🎯🧭.
It’s crucial to wait for a confirmed break of structure 🧱✅ before forming a directional bias.
This keeps us disciplined and aligned with what price action is truly telling us.
📈 Risk Management Protocols
🔑 Core principles:
Max 1% risk per trade
Only execute at pre-identified levels
Use alerts, not emotion
Stick to your RR plan — minimum 1:2
🧠 You’re not paid for how many trades you take, you’re paid for how well you manage risk.
🧠 Weekly FRGNT Insight
"Trade what the market gives, not what your ego wants."
Stay mechanical. Stay focused. Let the probabilities work.
FX:USDJPY

Gold (XAUUSD) 15M chartImmediate Trend – Price has rebounded from 3,330 support and is now testing the 3,341–3,343 minor resistance zone. Momentum is recovering but still corrective in nature after the recent sharp sell-off.
Demand Zone Reaction – Strong buying emerged from the 3,334–3,330 green support area, showing active buyers defending this level. This remains a key invalidation point for bulls.
Supply Zone Above – Major supply & liquidity trap sits at 3,352–3,357 (yellow zone); any rally into this area without strong volume is vulnerable to rejection.
Key Levels to Watch –
Resistance: 3,343 → 3,352 → 3,357 → 3,374
Support: 3,341 → 3,334 → 3,330 → 3,324
Trading Playbook –
Bullish Scenario: Break & retest above 3,343 with volume could target 3,352–3,357.
Bearish Scenario: Failure to break 3,343 or rejection from 3,352–3,357 could send price back to 3,334–3,330.

Gold Price Faces Key Resistance — Can Bulls Break $3,440?The XAU/USD (Gold vs. USD) 1-hour chart shows a strong bullish structure within an upward channel, supported by higher highs and a recent ATH (All-Time High) retest.
Resistance Zone: $3,410 – $3,440 is acting as a significant supply area. Price may face selling pressure here.
Support Levels: First support lies near $3,300 (supply zone), followed by the $3,225–$3,250 demand zone.
Trend: The price is respecting the upward trendline, but a break below could trigger a retest of the green supply zone.
Bullish Scenario: A breakout and close above $3,440 could lead to a continuation toward $3,475+.
Bearish Scenario: Rejection from the resistance zone with a break below $3,300 could push price toward the $3,225 support.
Overall, gold is currently in a bullish trend, but needs to overcome the $3,440 barrier for further upside momentum.

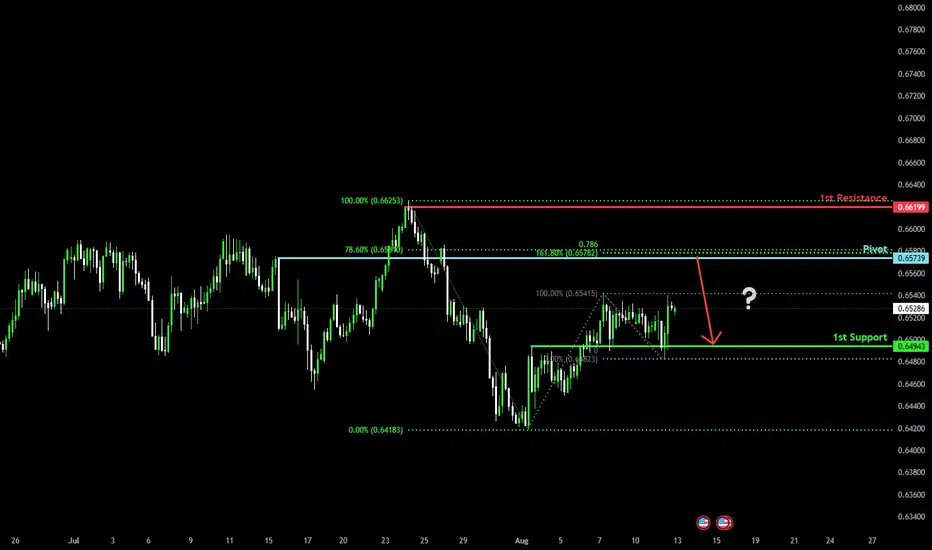
Heading into Fibonacci confluence?The Aussie (AUD/USD) is rising towards the pivot and could reverse to the 1st support which acts as an overlap support.
Pivot: 0.6573
1st Support: 0.6494
1st Resistance: 0.6619
Risk Warning:
Trading Forex and CFDs carries a high level of risk to your capital and you should only trade with money you can afford to lose. Trading Forex and CFDs may not be suitable for all investors, so please ensure that you fully understand the risks involved and seek independent advice if necessary.
Disclaimer:
The above opinions given constitute general market commentary, and do not constitute the opinion or advice of IC Markets or any form of personal or investment advice.
Any opinions, news, research, analyses, prices, other information, or links to third-party sites contained on this website are provided on an "as-is" basis, are intended only to be informative, is not an advice nor a recommendation, nor research, or a record of our trading prices, or an offer of, or solicitation for a transaction in any financial instrument and thus should not be treated as such. The information provided does not involve any specific investment objectives, financial situation and needs of any specific person who may receive it. Please be aware, that past performance is not a reliable indicator of future performance and/or results. Past Performance or Forward-looking scenarios based upon the reasonable beliefs of the third-party provider are not a guarantee of future performance. Actual results may differ materially from those anticipated in forward-looking or past performance statements. IC Markets makes no representation or warranty and assumes no liability as to the accuracy or completeness of the information provided, nor any loss arising from any investment based on a recommendation, forecast or any information supplied by any third-party.
XAU/USD Bullish Bounce from Demand Zone !Gold (XAU/USD) on the 4H chart is showing a potential bullish reversal setup. Price has pulled back into a Fair Value Gap (FVG) and high supply/demand zone near 3,329–3,315, aligning with the 0.382–0.5 Fibonacci retracement.
Key Points:
Support Zone: 3,329–3,315 (demand + FVG).
Bullish Rejection Expected: Price may bounce from this zone, targeting upper resistance levels.
Upside Targets:
TP1: 3,356
TP2: 3,375
TP3: 3,440–3,459 (major resistance)
Invalidation: A daily close below 3,315 could open room for deeper downside toward 3,278–3,245.
Indicators: EMA(9) and Ichimoku showing potential for trend resumption if price closes above 3,362.
Overall, the chart suggests a buy setup on bullish confirmation, aiming for the 3,375–3,459 zone.

EURUSD – DAILY FORECAST Q3 | W33 | D12 | Y25📊 EURUSD – DAILY FORECAST
Q3 | W33 | D12 | Y25
Daily Forecast 🔍📅
Here’s a short diagnosis of the current chart setup 🧠📈
Higher time frame order blocks have been identified — these are our patient points of interest 🎯🧭.
It’s crucial to wait for a confirmed break of structure 🧱✅ before forming a directional bias.
This keeps us disciplined and aligned with what price action is truly telling us.
📈 Risk Management Protocols
🔑 Core principles:
Max 1% risk per trade
Only execute at pre-identified levels
Use alerts, not emotion
Stick to your RR plan — minimum 1:2
🧠 You’re not paid for how many trades you take, you’re paid for how well you manage risk.
🧠 Weekly FRGNT Insight
"Trade what the market gives, not what your ego wants."
Stay mechanical. Stay focused. Let the probabilities work.
FX:EURUSD
