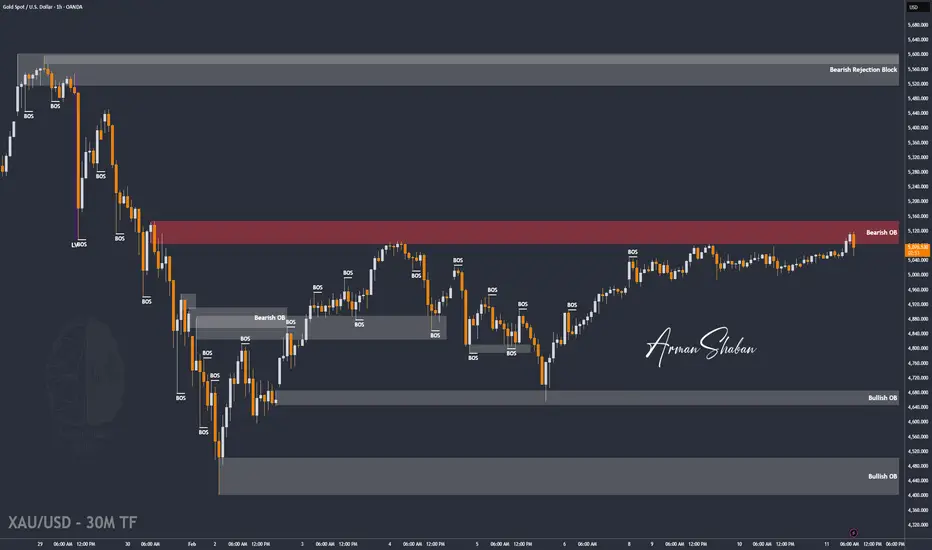
XAU/USD | Gold Breaks $5086, Now Testing Key Zones Again!By analyzing the #Gold chart on the 1-hour timeframe, we can see that after a small pullback yesterday, price made a strong move toward the $5086 resistance. Gold successfully broke this level and rallied up to $5121.
After reaching this important zone, price faced selling pressure and is now trading around $5076.
Key demand zones are $5026, $5050, and $5059.
Key supply zones are $5092–$5099 and $5111–$5121.
If Gold manages to break and hold above the $5120 zone, we can expect further upside toward $5146.
Keep a close eye on price reaction at each of these zones. This analysis will be updated soon.
Please support me with your likes and comments to motivate me to share more analysis with you and share your opinion about the possible trend of this chart with me !
Best Regards , Arman Shaban
Forexsignals
Gold Price Analysis – Resistance and Support LevelsThis chart highlights crucial price levels for gold, including Key Resistance Level at 5,440.457, where a breakout or price rejection may occur. The Minor Resistance at 5,112.237 could lead to a potential reversal. The Support Zone around 5,062.548 is being tested, with the expectation for price stabilization or a potential bounce. Critical Support at 4,980.486 is a key level for a possible bullish reversal, while Major Support at 4,704.862 could provide strong reversal potential. Extreme Support at 4,500.854 is identified as a significant reversal zone, where price is likely to find strong support and could trigger a sharp bullish recovery.

GBPJPY reaching the best level for long-term buying.The GBPJPY pair has been trading within a 10-month Channel Up since the April 09 2025 market bottom. In the past 2 weeks it is on a technical Bearish Leg as following a +8.60% Bullish Leg, it topped and the correction broke below the 1D MA50 (blue trend-line) yesterday.
This has always been an early Buy Signal, with the last two breaks even touching and rebounding exactly on the 1D MA100 (green trend-line). In fact this 8.60% Bullish Leg into correction resembles the one that led to the August 04 2025 Higher Low just above the 1D MA100. The 1D RSI sequences among those two fractals are identical and with the RSI about to enter its Support Zone, we are about to get the strongest Buy Signal.
Our Target is at least the 1.786 Fib extension (like October 08 2025) at 220.000.
---
** Please LIKE 👍, FOLLOW ✅, SHARE 🙌 and COMMENT ✍ if you enjoy this idea! Also share your ideas and charts in the comments section below! This is best way to keep it relevant, support us, keep the content here free and allow the idea to reach as many people as possible. **
---
💸💸💸💸💸💸
👇 👇 👇 👇 👇 👇

USD/JPY | Retesting (READ THE CAPTION)As you can see in the 4H chart of USDJPY, it has been on a bearish run for the past 3 days from Monday open. It gradually dropped in the price from 157.66 all the way to 152.80, that's almost 400 pips in a span of 3 days!
USDJPY hit the demand zone today and it is being traded at 153.21.
If USDJPY manages to stay above the demand zone and manages to go through the IFVG, the targets are: 153.28, 153.40, 153.52 and 153.64.
If it fails at retesting the IFVG: 153.10, 153.00, 152.90 and 152.80.

EURUSD H1 | Bullish BounceThe price has bounced off our buy entry level at 1.1860, which is an overlap support that aligns with the 38.2% Fibonacci retracement.
Our stop loss is set at 1.1812, which is an overlap support that is slightly above the 78.6% Fibonacci retracement.
Our take profit is set at 1.198, which is a pullback resistance.
High Risk Investment Warning
Stratos Markets Limited fxcm.com Stratos Europe Ltd fxcm.com
CFDs are complex instruments and come with a high risk of losing money rapidly due to leverage. 69% of retail investor accounts lose money when trading CFDs with this provider. You should consider whether you understand how CFDs work and whether you can afford to take the high risk of losing your money.
Stratos Global LLC fxcm.com Losses can exceed deposits.
Please be advised that the information presented on TradingView is provided to FXCM (‘Company’, ‘we’) by a third-party provider (‘TFA Global Pte Ltd’). Please be reminded that you are solely responsible for the trading decisions on your account. Any information and/or content is intended entirely for research, educational and informational purposes only and does not constitute investment or consultation advice or investment strategy. The information is not tailored to the investment needs of any specific person and therefore does not involve a consideration of any of the investment objectives, financial situation or needs of any viewer that may receive it. Past performance is not a reliable indicator of future results. Actual results may differ materially from those anticipated in forward-looking or past performance statements. We assume no liability as to the accuracy or completeness of any of the information and/or content provided herein and the Company cannot be held responsible for any omission, mistake nor for any loss or damage including without limitation to any loss of profit which may arise from reliance on any information supplied by TFA Global Pte Ltd.
Stratos Trading Pty. Limited fxcm.com
Trading FX/CFDs carries significant risks. FXCM AU (AFSL 309763), please read the Financial Services Guide, Product Disclosure Statement, Target Market Determination and Terms of Business at fxcm.com

Potential bullish bounce?GBP/CHF has bounced off the pivot, which has been identified as an overlap support nd could rise to the 1st resistance, which is an overlap resistance.
Pivot: 1.0499
1st Support: 1.0440
1st Resistance: 1.0567
Disclaimer:
The opinions given above constitute general market commentary and do not constitute the opinion or advice of IC Markets or any form of personal or investment advice.
Any opinions, news, research, analyses, prices, other information, or links to third-party sites contained on this website are provided on an "as-is" basis, are intended to be informative only, and are not advice, a recommendation, research, a record of our trading prices, an offer of, or solicitation for, a transaction in any financial instrument and thus should not be treated as such. The information provided does not involve any specific investment objectives, financial situation, or needs of any specific person who may receive it. Please be aware that past performance is not a reliable indicator of future performance and/or results. Past performance or forward-looking scenarios based upon the reasonable beliefs of the third-party provider are not a guarantee of future performance. Actual results may differ materially from those anticipated in forward-looking or past performance statements. IC Markets makes no representation or warranty and assumes no liability as to the accuracy or completeness of the information provided, nor any loss arising from any investment based on a recommendation, forecast, or any information supplied by any third party.

Potential bearish drop?GBP/CHF has rejected off the resistance level, which has been identified as an overlap resistance that is slightly below the 61.8% Fibonacci retracement and could reverse from this level to our take profit.
Entry: 1.0557
Why we like it:
There is an overlap resistance level that is slightly below the 61.8% Fibonacci retracement.
Stop loss: 1.0614
Why we like it:
There is a pullback resistance that aligns with the 78.6% Fibonacci retracement.
Take profit: 1.0463
Why we like it:
There is a pullback support level.
Enjoying your TradingView experience? Review us!
Please be advised that the information presented on TradingView is provided to Vantage (‘Vantage Global Limited’, ‘we’) by a third-party provider (‘Everest Fortune Group’). Please be reminded that you are solely responsible for the trading decisions on your account. There is a very high degree of risk involved in trading. Any information and/or content is intended entirely for research, educational and informational purposes only and does not constitute investment or consultation advice or investment strategy. The information is not tailored to the investment needs of any specific person and therefore does not involve a consideration of any of the investment objectives, financial situation or needs of any viewer that may receive it. Kindly also note that past performance is not a reliable indicator of future results. Actual results may differ materially from those anticipated in forward-looking or past performance statements. We assume no liability as to the accuracy or completeness of any of the information and/or content provided herein and the Company cannot be held responsible for any omission, mistake nor for any loss or damage including without limitation to any loss of profit which may arise from reliance on any information supplied by Everest Fortune Group.

EURAUD H4 | Bearish Continuation SetupBased on the H4 chart analysis, we could see the price rise to our sell entry level at 1.6829, which is an overlap resistance that aligns with the 38.2% and the 23.6% Fibonacci retracement.
Our stop loss is set at 1.6996, which is a pullback resistance level slightly above the 38.2% Fibonacci retracement.
Our take profit is set at 1.6632, which is a pullback support.
High Risk Investment Warning
Stratos Markets Limited fxcm.com Stratos Europe Ltd fxcm.com
CFDs are complex instruments and come with a high risk of losing money rapidly due to leverage. 69% of retail investor accounts lose money when trading CFDs with this provider. You should consider whether you understand how CFDs work and whether you can afford to take the high risk of losing your money.
Stratos Global LLC fxcm.com Losses can exceed deposits.
Please be advised that the information presented on TradingView is provided to FXCM (‘Company’, ‘we’) by a third-party provider (‘TFA Global Pte Ltd’). Please be reminded that you are solely responsible for the trading decisions on your account. Any information and/or content is intended entirely for research, educational and informational purposes only and does not constitute investment or consultation advice or investment strategy. The information is not tailored to the investment needs of any specific person and therefore does not involve a consideration of any of the investment objectives, financial situation or needs of any viewer that may receive it. Past performance is not a reliable indicator of future results. Actual results may differ materially from those anticipated in forward-looking or past performance statements. We assume no liability as to the accuracy or completeness of any of the information and/or content provided herein and the Company cannot be held responsible for any omission, mistake nor for any loss or damage including without limitation to any loss of profit which may arise from reliance on any information supplied by TFA Global Pte Ltd.
Stratos Trading Pty. Limited fxcm.com
Trading FX/CFDs carries significant risks. FXCM AU (AFSL 309763), please read the Financial Services Guide, Product Disclosure Statement, Target Market Determination and Terms of Business at fxcm.com

GBPAUD: Time to Recover?! 🇬🇧🇦🇺
GBPAUD looks too oversold after the last bearish wave.
A bullish change of character on an hourly time frame
suggests a highly probable pullback.
Expect a bullish move at least to 1.9197
❤️Please, support my work with like, thank you!❤️
I am part of Trade Nation's Influencer program and receive a monthly fee for using their TradingView charts in my analysis.

Gold Price Analysis – Key Support and Resistance LevelsThis chart outlines the key support and resistance levels for gold prices. The Key Resistance Level at 5,431.175 is a potential rejection zone, where price may face resistance. The Support Zone at 5,040.060 is being tested, and if price holds, a bounce or reversal is expected. The Critical Support at 4,949.972 is a key level for a potential bullish reversal. The Extreme Support at 4,497.334 represents a significant reversal area where price is likely to find strong support. Traders should monitor these levels for price action to confirm potential movements

Bullish bounce off?Fiber (EUR/USD) has bounced off the pivot, which acts as a pullback support and could rise to the 1st resistance level.
Pivot: 1.1837
1st Support: 1.1778
1st Resistance: 1.1940
Disclaimer:
The opinions given above constitute general market commentary and do not constitute the opinion or advice of IC Markets or any form of personal or investment advice.
Any opinions, news, research, analyses, prices, other information, or links to third-party sites contained on this website are provided on an "as-is" basis, are intended to be informative only, and are not advice, a recommendation, research, a record of our trading prices, an offer of, or solicitation for, a transaction in any financial instrument and thus should not be treated as such. The information provided does not involve any specific investment objectives, financial situation, or needs of any specific person who may receive it. Please be aware that past performance is not a reliable indicator of future performance and/or results. Past performance or forward-looking scenarios based upon the reasonable beliefs of the third-party provider are not a guarantee of future performance. Actual results may differ materially from those anticipated in forward-looking or past performance statements. IC Markets makes no representation or warranty and assumes no liability as to the accuracy or completeness of the information provided, nor any loss arising from any investment based on a recommendation, forecast, or any information supplied by any third party.

Potential bearish drop off?Cable (GBP/USD) has rejected off the pivot and could drop to the 1st support, which has been identified as an overlap support.
Pivot: 1.3717
1st Support: 1.3549
1st Resistance: 1.3782
Disclaimer:
The opinions given above constitute general market commentary and do not constitute the opinion or advice of IC Markets or any form of personal or investment advice.
Any opinions, news, research, analyses, prices, other information, or links to third-party sites contained on this website are provided on an "as-is" basis, are intended to be informative only, and are not advice, a recommendation, research, a record of our trading prices, an offer of, or solicitation for, a transaction in any financial instrument and thus should not be treated as such. The information provided does not involve any specific investment objectives, financial situation, or needs of any specific person who may receive it. Please be aware that past performance is not a reliable indicator of future performance and/or results. Past performance or forward-looking scenarios based upon the reasonable beliefs of the third-party provider are not a guarantee of future performance. Actual results may differ materially from those anticipated in forward-looking or past performance statements. IC Markets makes no representation or warranty and assumes no liability as to the accuracy or completeness of the information provided, nor any loss arising from any investment based on a recommendation, forecast, or any information supplied by any third party.

Falling towards key support?Aussie (AUD/USD) is falling towards the pivot, which acts as an overlap support and could bounce to the 1st resistance.
Pivot: 0.7090
1st Support: 0.7040
1st Resistance: 0.7185
Disclaimer:
The opinions given above constitute general market commentary and do not constitute the opinion or advice of IC Markets or any form of personal or investment advice.
Any opinions, news, research, analyses, prices, other information, or links to third-party sites contained on this website are provided on an "as-is" basis, are intended to be informative only, and are not advice, a recommendation, research, a record of our trading prices, an offer of, or solicitation for, a transaction in any financial instrument and thus should not be treated as such. The information provided does not involve any specific investment objectives, financial situation, or needs of any specific person who may receive it. Please be aware that past performance is not a reliable indicator of future performance and/or results. Past performance or forward-looking scenarios based upon the reasonable beliefs of the third-party provider are not a guarantee of future performance. Actual results may differ materially from those anticipated in forward-looking or past performance statements. IC Markets makes no representation or warranty and assumes no liability as to the accuracy or completeness of the information provided, nor any loss arising from any investment based on a recommendation, forecast, or any information supplied by any third party.

Bullish bounce off?Loonie (USD/CAD) has bounced off the pivot and could potentially rise to the 1st resistance.
Pivot: 1.3556
1st Support: 1.3524
1st Resistance: 1.3624
Disclaimer:
The opinions given above constitute general market commentary and do not constitute the opinion or advice of IC Markets or any form of personal or investment advice.
Any opinions, news, research, analyses, prices, other information, or links to third-party sites contained on this website are provided on an "as-is" basis, are intended to be informative only, and are not advice, a recommendation, research, a record of our trading prices, an offer of, or solicitation for, a transaction in any financial instrument and thus should not be treated as such. The information provided does not involve any specific investment objectives, financial situation, or needs of any specific person who may receive it. Please be aware that past performance is not a reliable indicator of future performance and/or results. Past performance or forward-looking scenarios based upon the reasonable beliefs of the third-party provider are not a guarantee of future performance. Actual results may differ materially from those anticipated in forward-looking or past performance statements. IC Markets makes no representation or warranty and assumes no liability as to the accuracy or completeness of the information provided, nor any loss arising from any investment based on a recommendation, forecast, or any information supplied by any third party.

Bullish bounce off pullback support?Swissie (USD/CHF) is falling towards the pivot, which is a pullback support that is slightly below the 61.8% Fibonacci retracement and could bounce to the 1st resistance, which is also a pullback resistance.
Pivot: 0.7684
1st Support: 0.7654
1st Resistance: 0.7654
Disclaimer:
The opinions given above constitute general market commentary and do not constitute the opinion or advice of IC Markets or any form of personal or investment advice.
Any opinions, news, research, analyses, prices, other information, or links to third-party sites contained on this website are provided on an "as-is" basis, are intended to be informative only, and are not advice, a recommendation, research, a record of our trading prices, an offer of, or solicitation for, a transaction in any financial instrument and thus should not be treated as such. The information provided does not involve any specific investment objectives, financial situation, or needs of any specific person who may receive it. Please be aware that past performance is not a reliable indicator of future performance and/or results. Past performance or forward-looking scenarios based upon the reasonable beliefs of the third-party provider are not a guarantee of future performance. Actual results may differ materially from those anticipated in forward-looking or past performance statements. IC Markets makes no representation or warranty and assumes no liability as to the accuracy or completeness of the information provided, nor any loss arising from any investment based on a recommendation, forecast, or any information supplied by any third party.

Bullish reversal off overlap support?NZD/USD is falling towards the support level, which is an overlap support that is slightly above the 127.2% Fibonacci extension and could bounce from this level to our take profit.
Entry: 92.35
Why we like it:
There is an overlap support that is slightly above the 127.2% Fibonacci extension.
Stop loss: 91.65
Why we like it:
There is a pullback support level.
Take profit: 93.10
Why we like it:
There is an overlap resistance level.
Enjoying your TradingView experience? Review us!
Please be advised that the information presented on TradingView is provided to Vantage (‘Vantage Global Limited’, ‘we’) by a third-party provider (‘Everest Fortune Group’). Please be reminded that you are solely responsible for the trading decisions on your account. There is a very high degree of risk involved in trading. Any information and/or content is intended entirely for research, educational and informational purposes only and does not constitute investment or consultation advice or investment strategy. The information is not tailored to the investment needs of any specific person and therefore does not involve a consideration of any of the investment objectives, financial situation or needs of any viewer that may receive it. Kindly also note that past performance is not a reliable indicator of future results. Actual results may differ materially from those anticipated in forward-looking or past performance statements. We assume no liability as to the accuracy or completeness of any of the information and/or content provided herein and the Company cannot be held responsible for any omission, mistake nor for any loss or damage including without limitation to any loss of profit which may arise from reliance on any information supplied by Everest Fortune Group.

GBP/USD | what's ahead? (READ THE CAPTION)Good morning folks, Amirali here.
As you can see, after yesterday's fall, GBPUSD went well below the Jan 26th NWOG and Feb 5th NDOG. However, it made an upwards move after the initial drop and is now being traded at 1.3670, just above the Jan 26th NWOG High.
Now, if the price holds above 1.3670 in the next 2 hours, I can see it go for the Feb 2nd NWOG and for 1.37000.
For the time being, the targets are: 1.3680, 1.3690 and 1.3700.
If it fails to hold above this level, the targets will be: 1.3670, 1.3663, 1.3656 and 1.3650.

EUR/JPY | Where to next? (READ THE CAPTION)By analyzing the 4H chart of EURJPY we can see that ever since Monday Open, it has experienced a dramatic fall from 186.23 all the way to 182.21, just over 400 pips! However after reaching the rejection block, EURJPY bounced back a bit and is now being traded at 182.68.
I expect it to retest the Jan 19th NWOG very soon. If it's rejected from there, the targets are: 182.60, 182.50, 182.40, 182.30 and 182.20.
But if it holds itself: 182.90, 183.00, 183.10, 183.20 and 183.30.

EUR/USD | Going back to 1.1900 (READ THE CAPTION)Well hello folks, Amirali here.
Starting the day with an analysis on the 15m chart of EURUSD, after it hit the Bullish OB it started a upwards move, going through Today's NDOG, and now being traded at 1.1877. If it holds above today's NDOG, I expect to go higher and going for the Feb 11th NDOG.
Targets: 1.1885, 1.1893 and 1.1900.
If it goes below the NDOG: 1.18700, 1.1863 and 1.1855.

USD/CHF H1 | Falling Towards Pullback SupportThe price is falling towards our buy entry level at 0.7684, which is a pullback support that is slightly above the 50% Fibonacci retracement.
Our stop loss is set at 0.7640, which is a multi-swing low support.
Our take profit is set at 0.7743, which is a pullback resistance.
High Risk Investment Warning
Stratos Markets Limited fxcm.com Stratos Europe Ltd fxcm.com
CFDs are complex instruments and come with a high risk of losing money rapidly due to leverage. 69% of retail investor accounts lose money when trading CFDs with this provider. You should consider whether you understand how CFDs work and whether you can afford to take the high risk of losing your money.
Stratos Global LLC fxcm.com Losses can exceed deposits.
Please be advised that the information presented on TradingView is provided to FXCM (‘Company’, ‘we’) by a third-party provider (‘TFA Global Pte Ltd’). Please be reminded that you are solely responsible for the trading decisions on your account. Any information and/or content is intended entirely for research, educational and informational purposes only and does not constitute investment or consultation advice or investment strategy. The information is not tailored to the investment needs of any specific person and therefore does not involve a consideration of any of the investment objectives, financial situation or needs of any viewer that may receive it. Past performance is not a reliable indicator of future results. Actual results may differ materially from those anticipated in forward-looking or past performance statements. We assume no liability as to the accuracy or completeness of any of the information and/or content provided herein and the Company cannot be held responsible for any omission, mistake nor for any loss or damage including without limitation to any loss of profit which may arise from reliance on any information supplied by TFA Global Pte Ltd.
Stratos Trading Pty. Limited fxcm.com
Trading FX/CFDs carries significant risks. FXCM AU (AFSL 309763), please read the Financial Services Guide, Product Disclosure Statement, Target Market Determination and Terms of Business at fxcm.com

Bearish reversal off 50% Fib resistance?US Dollar Index 9DXY) has rejected off the pivot, which is a pullback resistance that aligns with the 50% Fibonacci retracement, and could drop to the 1st support.
Pivot: 97.20
1st Support: 95.95
1st Resistance: 97.67
Disclaimer:
The opinions given above constitute general market commentary and do not constitute the opinion or advice of IC Markets or any form of personal or investment advice.
Any opinions, news, research, analyses, prices, other information, or links to third-party sites contained on this website are provided on an "as-is" basis, are intended to be informative only, and are not advice, a recommendation, research, a record of our trading prices, an offer of, or solicitation for, a transaction in any financial instrument and thus should not be treated as such. The information provided does not involve any specific investment objectives, financial situation, or needs of any specific person who may receive it. Please be aware that past performance is not a reliable indicator of future performance and/or results. Past performance or forward-looking scenarios based upon the reasonable beliefs of the third-party provider are not a guarantee of future performance. Actual results may differ materially from those anticipated in forward-looking or past performance statements. IC Markets makes no representation or warranty and assumes no liability as to the accuracy or completeness of the information provided, nor any loss arising from any investment based on a recommendation, forecast, or any information supplied by any third party.

GBP/USD Bullish Scenario with Risk-Defined Parameters🇬🇧 👑 GBP/USD: "THE CABLE" – Bullish Liquidity Hunt & The Thief Strategy 👑 🇺🇸
Welcome, Ladies & Gentlemen (the Thief OG's). We are tracking the British Pound as it navigates the shark-infested waters of the 1.3500-1.3600 demand zone. While the "Police Force" (major resistance) is watching, we are looking to sneak in, grab the liquidity, and vanish before the sirens go off! 🚨💸
🕵️♂️ THE ENTRY BLUEPRINT: "THE THIEF LIMIT LAYERS"
Don't rush the gates! We use a staggered Limit Layer Entry to catch the best possible average price while the market makers try to shake us out.
Entry Layer 1: 1.36000 🎯
Entry Layer 2: 1.35800 🎯
Entry Layer 3: 1.35600 🎯
Entry Layer 4: 1.35400 🎯 (The Deep Snatch)
💰 THE GETAWAY PLAN (EXIT LEVELS)
The "Police Force" is setting up a trap at the top. We stay one step ahead. 🏃💨
TP1: 1.37200 — First Liquidity Grab Completed. (Secure 50% and move SL to BE). 🏦
TP2: 1.38400 — Final Liquidity Sweep — Exit Complete. (The heist is over, leave no trace). 🏁
🛑 THE PROTECTION: "THIEF STOP LOSS"
SL: 1.34800 — (The "Caught" Zone). 🚔
Note: This is my personal risk level. As a Thief OG, you choose your own exit. Your money, your risk, your reward. Don't let the market catch you sleeping!
📊 TECHNICAL VIBE & MARKET CORRELATION
To succeed, we watch the shadows. Watch these related pairs for confirmation:
FX:EURUSD (The Partner In Crime): If Fiber breaks its 1.1840 resistance, the Cable will fly. 🚀
TVC:DXY (The Enemy): If the Dollar Index drops below 103.50, our Bullish heist is "Green Light." 🟢
OANDA:XAUUSD (The Gold Reserve): Inverse correlation is key. If Gold pumps toward $5,000, the USD is weakening, fueling our GBP long. 🪙
🌐 FUNDAMENTALS & ECONOMIC HEAT MAP (FEB 2026)
The macro climate is shifting. Here is why the "Cable" is ready for a spring:
BoE Stance: The Bank of England recently held rates at 3.75%. While some see a "Dovish" tone, the cooling labor market actually makes the Pound a prime candidate for a "relief rally" as inflation stabilizes toward 2%. 📈
The Trump Factor: Recent tariff threats on European trade have caused volatility, but the market is pricing this in. We are looking for the "Buy the Rumor, Sell the News" reversal. 📰
US Data Watch: Keep your eyes on the upcoming US CPI and Jobless Claims. A cooling US economy means a weaker Dollar, giving us the perfect window to strike. 🦅
🧠 THIEF TRADER MOTIVATION
"A professional trader doesn't try to predict the wind; they just adjust the sails and steal the profits when the wind blows." 🌬️⛵
Stay Sharp: Discipline is the bridge between a heist and a paycheck.
Stay Humble: The market is the house; we are just here to take our share.
Stay Profitable: Get in, get paid, get out.
Happy Hunting, OGs! 🥂✨

GBP/USD | NWOG Retest (READ THE CAPTION)As you can see in the 30m chart of GBPUSD, after it hit the Feb 9th NWOG Midpoint (Consequent Encroachment), it bounced back up, but after hitting Jan 26th NWOG Low, it dropped again, going back to the Feb 12th NDOG, hitting it and going back up a bit and it is now being traded at 1.3638.
I expect GBPUSD to retest the Jan 26th NWOG.
