Falling towards key support?AUD/USD is pulling back toward the pivot level, which serves as a multi–swing-low support zone. From this area, the pair may find buying interest and potentially rebound toward the 1st resistance level.
Pivot: 0.6468
1st Support: 0.6444
1st Resitance: 0.6498
Disclaimer:
The opinions given above constitute general market commentary and do not constitute the opinion or advice of IC Markets or any form of personal or investment advice.
Any opinions, news, research, analyses, prices, other information, or links to third-party sites contained on this website are provided on an "as-is" basis, are intended to be informative only, and are not advice, a recommendation, research, a record of our trading prices, an offer of, or solicitation for, a transaction in any financial instrument and thus should not be treated as such. The information provided does not involve any specific investment objectives, financial situation, or needs of any specific person who may receive it. Please be aware that past performance is not a reliable indicator of future performance and/or results. Past performance or forward-looking scenarios based upon the reasonable beliefs of the third-party provider are not a guarantee of future performance. Actual results may differ materially from those anticipated in forward-looking or past performance statements. IC Markets makes no representation or warranty and assumes no liability as to the accuracy or completeness of the information provided, nor any loss arising from any investment based on a recommendation, forecast, or any information supplied by any third party.
Forexsignals

Wait for a potentil breakout?Cable (GBP/USD) is reacting off the pivot level, and a breakout below this area could drive the price toward the 1st support.
Pivot: 1.3151
1st Support: 1.3112
1st Resistance: 1.3179
Disclaimer:
The opinions given above constitute general market commentary and do not constitute the opinion or advice of IC Markets or any form of personal or investment advice.
Any opinions, news, research, analyses, prices, other information, or links to third-party sites contained on this website are provided on an "as-is" basis, are intended to be informative only, and are not advice, a recommendation, research, a record of our trading prices, an offer of, or solicitation for, a transaction in any financial instrument and thus should not be treated as such. The information provided does not involve any specific investment objectives, financial situation, or needs of any specific person who may receive it. Please be aware that past performance is not a reliable indicator of future performance and/or results. Past performance or forward-looking scenarios based upon the reasonable beliefs of the third-party provider are not a guarantee of future performance. Actual results may differ materially from those anticipated in forward-looking or past performance statements. IC Markets makes no representation or warranty and assumes no liability as to the accuracy or completeness of the information provided, nor any loss arising from any investment based on a recommendation, forecast, or any information supplied by any third party.

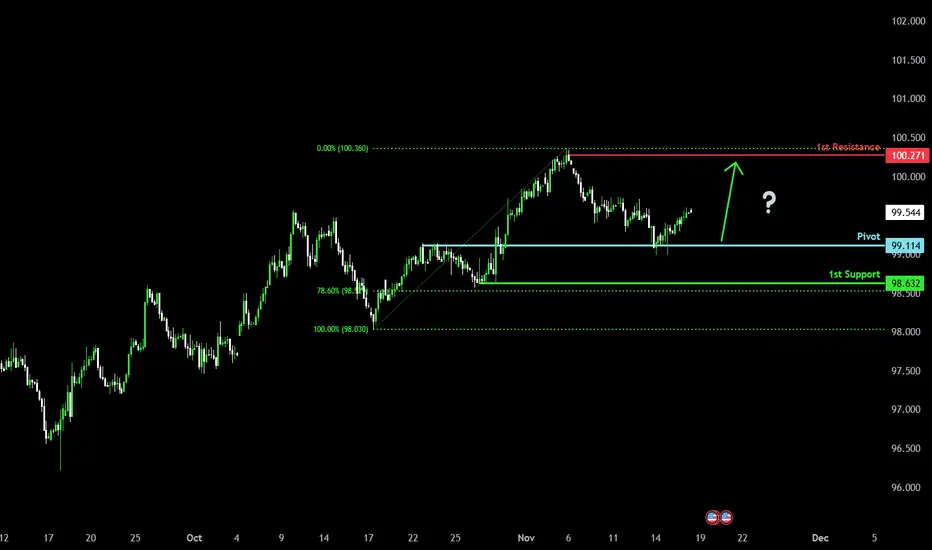
Bullish momentum to extend?US Dollar Index (DXY) has bounced off the pivot, which is a pullback support, and could potentially rise to the 1st resistance.
Pivot: 99.11
1st Support: 98.63
1st Resistance: 100.27
Disclaimer:
The opinions given above constitute general market commentary and do not constitute the opinion or advice of IC Markets or any form of personal or investment advice.
Any opinions, news, research, analyses, prices, other information, or links to third-party sites contained on this website are provided on an "as-is" basis, are intended to be informative only, and are not advice, a recommendation, research, a record of our trading prices, an offer of, or solicitation for, a transaction in any financial instrument and thus should not be treated as such. The information provided does not involve any specific investment objectives, financial situation, or needs of any specific person who may receive it. Please be aware that past performance is not a reliable indicator of future performance and/or results. Past performance or forward-looking scenarios based upon the reasonable beliefs of the third-party provider are not a guarantee of future performance. Actual results may differ materially from those anticipated in forward-looking or past performance statements. IC Markets makes no representation or warranty and assumes no liability as to the accuracy or completeness of the information provided, nor any loss arising from any investment based on a recommendation, forecast, or any information supplied by any third party.
Bullish bounce off pullback supportUSD/ZAR is declining toward the pivot point, which serves as a pullback support level. From there, the pair could potentially bounce toward the 1st resistance level, which acts as a pullback resistance and sits slightly above the 60% Fibonacci retracement.
Pivot: 17.16611
1st Support: 17.10068
1st Resistance: 17.27964
Disclaimer:
The opinions given above constitute general market commentary and do not constitute the opinion or advice of IC Markets or any form of personal or investment advice.
Any opinions, news, research, analyses, prices, other information, or links to third-party sites contained on this website are provided on an "as-is" basis, are intended to be informative only, and are not advice, a recommendation, research, a record of our trading prices, an offer of, or solicitation for, a transaction in any financial instrument and thus should not be treated as such. The information provided does not involve any specific investment objectives, financial situation, or needs of any specific person who may receive it. Please be aware that past performance is not a reliable indicator of future performance and/or results. Past performance or forward-looking scenarios based upon the reasonable beliefs of the third-party provider are not a guarantee of future performance. Actual results may differ materially from those anticipated in forward-looking or past performance statements. IC Markets makes no representation or warranty and assumes no liability as to the accuracy or completeness of the information provided, nor any loss arising from any investment based on a recommendation, forecast, or any information supplied by any third party.

Bullish bounce off?EUR/CAD has bounced off the pivot whic acts as an overlap support and could rise to the 1st resistance.
Pivot: 1.62489
1st Support: 1.62177
1st Resistance: 1.63341
Disclaimer:
The opinions given above constitute general market commentary and do not constitute the opinion or advice of IC Markets or any form of personal or investment advice.
Any opinions, news, research, analyses, prices, other information, or links to third-party sites contained on this website are provided on an "as-is" basis, are intended to be informative only, and are not advice, a recommendation, research, a record of our trading prices, an offer of, or solicitation for, a transaction in any financial instrument and thus should not be treated as such. The information provided does not involve any specific investment objectives, financial situation, or needs of any specific person who may receive it. Please be aware that past performance is not a reliable indicator of future performance and/or results. Past performance or forward-looking scenarios based upon the reasonable beliefs of the third-party provider are not a guarantee of future performance. Actual results may differ materially from those anticipated in forward-looking or past performance statements. IC Markets makes no representation or warranty and assumes no liability as to the accuracy or completeness of the information provided, nor any loss arising from any investment based on a recommendation, forecast, or any information supplied by any third party.

Is GBP/JPY Setting Up for Another Bullish Leg Higher?🐉 GBP/JPY “THE DRAGON” — Swing Trade Opportunity Guide! 💹🔥
💬 Overview:
The Dragon is waking up 🐲 — GBP/JPY showing strong bullish momentum confirmed by Kijun-sen moving average pullback support 🟢. Price action indicates potential upside continuation as long as Kijun holds.
🎯 Plan:
Thief going full layer mode 🕵️♂️💰 — stacking multiple buy limits (layering entries) around 201 / 202 / 203 levels. You can increase or reduce the number of layers based on your personal trade management style and risk tolerance.
🛑 Stop Loss:
This is Thief’s SL @ 200.00 ⚔️
Dear Ladies & Gentlemen (Thief OGs) — manage your stop loss according to your own risk strategy. This is not a fixed level recommendation. Protect your capital like a pro 💼.
🎯 Target:
Expecting a bullish climb toward 208.00 zone, where moving averages align as resistance + potential overbought zone + liquidity trap. 🎯 Take profits smartly, don’t get greedy — escape with profits like a true Thief OG! 😎💸
🧠 Note:
Dear Ladies & Gentlemen (Thief OGs), this setup is not financial advice — it’s a strategic view based on Thief’s layering style. Always plan your entries, SL, and TP according to your own risk tolerance and capital plan.
📊 Correlation & Related Pairs to Watch:
💷 GBP/USD — Often moves in sync with GBP/JPY during strong GBP sentiment.
💴 USD/JPY — Key driver of Yen weakness/strength. If USD/JPY stays bullish, GBP/JPY gets more fuel.
💶 EUR/JPY — Similar momentum flow. A bullish EUR/JPY often confirms risk-on tone for GBP/JPY.
💵 DXY (US Dollar Index) — Watch for inverse reaction. Strong DXY may slow GBP pairs temporarily.
🔑 Key Highlights:
✨ Kijun-sen confirms bullish structure
✨ Layered entry strategy = controlled risk + better average
✨ MA resistance near 208 — perfect take-profit exit
✨ Watch correlated Yen pairs for early confirmation signals
🚀 Thief’s Final Words:
Trade smart, layer deep, and take profits like a pro. The Dragon flies only for the disciplined 🐉💹.

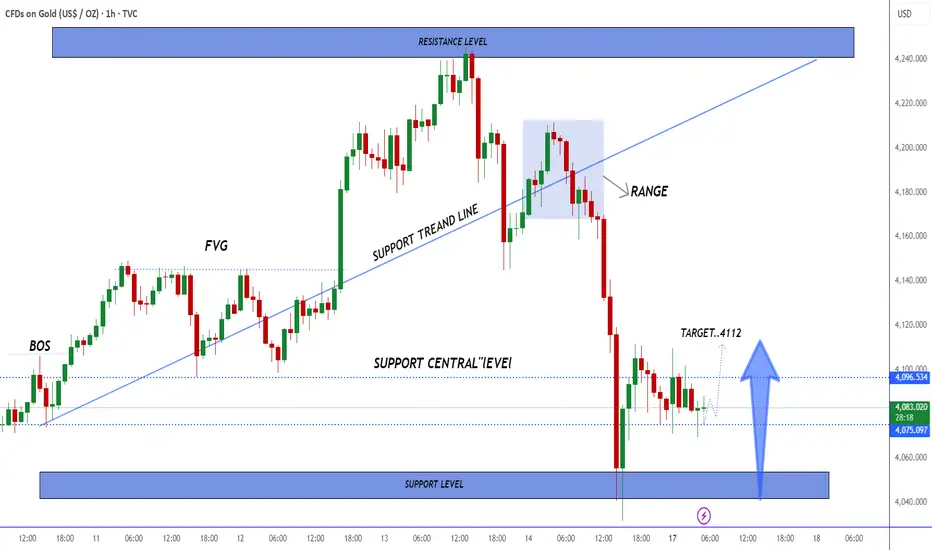
Bitcoin Reversal Setup Toward 96K TargetBitcoin is currently trading within a corrective structure after breaking down from the central zone. The chart highlights a fair value gap (FVG), a support level below, and a potential short-term bullish push toward the 96,000 target before any deeper move. The market remains in a ranging phase with key levels marked for possible reactions.

EUR/USD Trend Analysis: Will Bulls Take Control?EUR/USD Trend Analysis: Will Bulls Take Control?
EURUSD continues to trade inside a broad descending structure that has been active for several weeks, with repeated breaks of structure marking the gradual weakening of bearish momentum. The pair has shown consistent attempts to reclaim internal structure, revealing that sellers are losing dominance at each successive swing.
The recent price action highlights a slowdown in the bearish cycle, with the pair forming a compressed consolidation near the lower boundary of the channel. This type of price behavior typically represents absorption, where liquidity is collected before a potential directional shift. Multiple bullish breaks within the current leg signal that the market is preparing for a transition phase.
The chart illustrates a clear reaction to the most recent liquidity sweep, followed by a controlled reset in order flow. Buyers have stepped in aggressively in previous cycles after similar setups, suggesting that the market is once again positioning itself for a recovery attempt toward higher inefficiencies.
Volume distribution from the left side of the chart shows earlier institutional engagement, and the current region aligns with historical accumulation behaviors seen in prior EURUSD reversals. If the pair maintains strength within this consolidation pocket, the next move could be a bullish repricing wave targeting unmitigated zones above.
Overall, EURUSD is showing signs of shift and structural recovery, with the current pattern favoring a bullish reaction in the coming sessions.

Gold Triangle Breakout Setup Toward 4100 ZoneGold is consolidating inside a symmetrical triangle after breaking below the mid-range zone. A potential bullish breakout could push the price toward the 4100 resistance zone, while the lower support zone remains a key level to watch.
EURUSD:LIVE TRADEHello friends
Given the good growth we had, the price is now correcting and it is expected that buyers will support the price in this area and the price will rise to the specified targets.
Don't forget risk and capital management.
*Trade safely with us*

GBPJPY:LIVE TRADEHello friends
With the breakdown of the ascending channel, you can see that the power has fallen to the sellers and now the price is expected to see lower targets.
Don't forget risk and capital management.
*Trade safely with us*

XAUUSDHello Traders! 👋
What are your thoughts on GOLD?
Gold completed the expected bullish correction, reached the resistance zone and the broken trendline, and was strongly rejected from that area.
This rejection confirms continued bearish pressure in the market.
In the current region, we expect gold to move through a period of sideways consolidation, followed by a continuation of the downward move toward lower levels.
As long as the price remains below the resistance zone, the medium-term outlook stays bearish, and further downside movement is favored.
Don’t forget to like and share your thoughts in the comments! ❤️

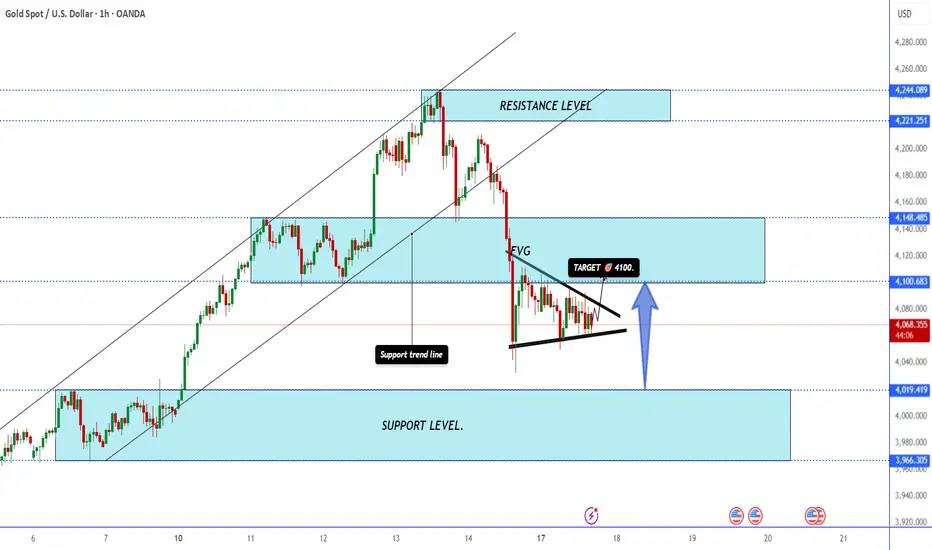
Gold Rejection at Support Zone with Bullish Targeting 4112Gold has broken below the support trendline and tapped the major support zone. Price is now consolidating near the support level, indicating a possible bullish reaction. If buyers step in, the next upside target is around 4112, aligned with the previous intraday structure.
XAU/USD | Gold Holding Strong – More Upside If Support Holds!By analyzing the #Gold chart on the 4H timeframe, we can see that after a pullback, the price climbed again to $4112 before making a small correction. It’s now trading around $4078.
If gold can hold above $4048, we can expect another move to the upside.
The next potential targets are $4106, $4112, $4133, and $4159.
Please support me with your likes and comments to motivate me to share more analysis with you and share your opinion about the possible trend of this chart with me !
Best Regards , Arman Shaban

EURJPYEurjpy buy opportunity, using buy stop will wait for the trade to open , always keeping trading simple and straightforward remember to maximise profits and have a safety Stop Loss

XAUUSD BULLS Gold looking to be buying so shall wait for the buy stop to be triggered and will then be into the trade, I recommend closing some profits or adjusting SL to entry when in profits

EURUSDEURUSD is at 1.15939
It has the potential to move towards 1.16152
The critical price level is 1.15797

USDJPY - Perfect time to buy!USDJPY Is in a clear uptrend and has been for a while! It is currently inside an upward channel and has recently broken the last major resistance zone which means it is extremely likely to keep heading to the upside for much longer (just a very minor resistance level which is causing slight delays for its bullish movements). The next target will be the fibonacci extension zone which is shown on the chart. USDJPY has struggled to break below support but has constantly been breaking through resistance levels. TIME TO BUY!

SELL EURUSD - Amazing trade opportunityEURUSD has broken a powerful channel that it was stuck in-between for a few weeks and broke the major support zone. The price recently retested the support trendline (which is now acting as resistance) .. From here it will continue to remain bearish and likely hit the next support level which is marked as "take profit". This is a very good zone to sell at! SELL EURUSD.

EURCHF SHORT SETUP FOREX ( 17 NOV 2025 )If you have doubt on our trades you can test in demo.
OANDA:EURCHF SHORT SETUP
TP: 0.92105
SL: 0.92255
Trade Ideas:
Idea is clearly shown on chart + we have some secret psychologies and tools behind this.
Trade Signal:
I provide trade signals here so follow my account and you can check my previous analysis. So don't miss trade opportunity so follow must.

EURCHF: Another Selling Opportunity 🇪🇺🇨🇭
EURCHF will most likely drop after a test of a major intraday/daily
resistance cluster.
The pair completed a consolidation on that, forming a local
selling imbalance.
I expect a bearish movement at least to 0.92 level.
❤️Please, support my work with like, thank you!❤️
I am part of Trade Nation's Influencer program and receive a monthly fee for using their TradingView charts in my analysis.

eurnzd buy signal. Don't forget about stop-loss.
Write in the comments all your questions and instruments analysis of which you want to see.
Friends, push the like button, write a comment, and share with your mates - that would be the best THANK YOU.
P.S. I personally will open entry if the price will show it according to my strategy.
Always make your analysis before a trade

AUDCHF: Bearish Move From Resistance Confirmed?! 🇦🇺🇨🇭
AUDCHF may drop from the underlined resistance cluster.
A formation of an inverted cup & handle pattern on that
on an hourly time frame and a bearish breakout of its neckline
during the Asian session suggest a highly probable drop lower.
Goal - 0.5174
❤️Please, support my work with like, thank you!❤️
I am part of Trade Nation's Influencer program and receive a monthly fee for using their TradingView charts in my analysis.
