USDCAD: Strong Bullish Pattern
USDCAD will rise more today, following a confirmed bullish breakout
of a resistance line of a bullish flag pattern.
Expect a rise after a completion of a pullback.
Forexsignals

Continuation of bearish momentum?The Kiwi (NZD/USD) is rising towards the pivot which acts as a pullback resistance and could reverse to the 1st support.
Pivot: 0.5883
1st Support: 0.5804
1st Resistance: 0.5914
Disclaimer:
The above opinions given constitute general market commentary, and do not constitute the opinion or advice of IC Markets or any form of personal or investment advice.
Any opinions, news, research, analyses, prices, other information, or links to third-party sites contained on this website are provided on an "as-is" basis, are intended only to be informative, is not an advice nor a recommendation, nor research, or a record of our trading prices, or an offer of, or solicitation for a transaction in any financial instrument and thus should not be treated as such. The information provided does not involve any specific investment objectives, financial situation and needs of any specific person who may receive it. Please be aware, that past performance is not a reliable indicator of future performance and/or results. Past Performance or Forward-looking scenarios based upon the reasonable beliefs of the third-party provider are not a guarantee of future performance. Actual results may differ materially from those anticipated in forward-looking or past performance statements. IC Markets makes no representation or warranty and assumes no liability as to the accuracy or completeness of the information provided, nor any loss arising from any investment based on a recommendation, forecast or any information supplied by any third-party.

Gold shakes violently | Priority Buy on dip to support🟡 XAU/USD – 24/09 | Captain Vincent ⚓
🔎 Captain’s Log – Context & News
Geopolitics : Trump unexpectedly supported Ukraine reclaiming full territory and called on NATO to be tougher on Russia → defensive sentiment returned, supporting Gold.
US Economy : Housing data due today, no FED speeches.
Earlier: Weak US PMI + dovish FED tone → no momentum for a prolonged downtrend.
Price Action : Gold dropped more than 20 points overnight, then quickly rebounded to 3,76x → likely profit-taking pressure at higher levels.
⏩ Captain’s Summary : Main trend stays bullish, but the voyage will remain choppy as Gold absorbs profit-taking near resistance.
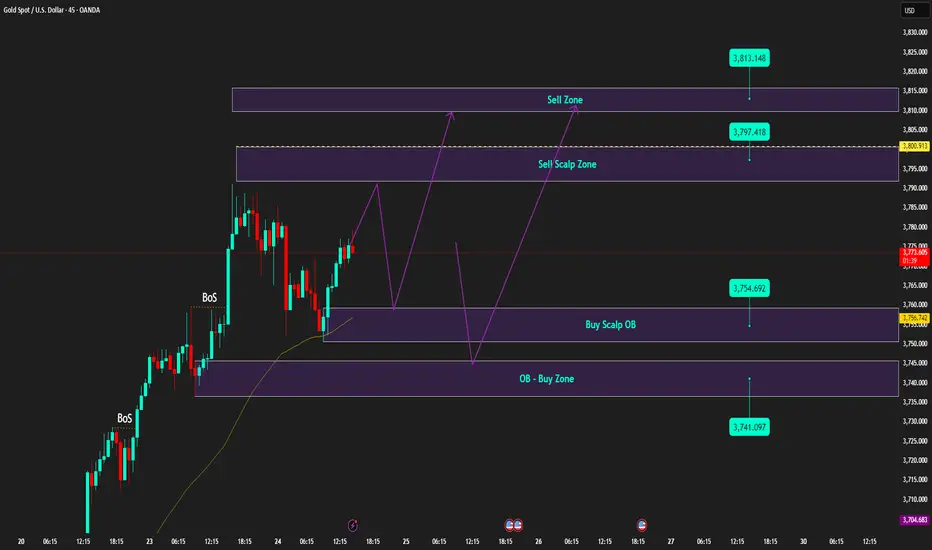
📈 Captain’s Chart – Technical Analysis (M45)
Golden Harbor (Support / Buy Zone)
Buy Scalp OB: 3,754 – 3,757
OB Harbor: 3,741 – 3,744
Storm Breaker (Resistance / Sell Zone)
Sell Scalp Zone: 3,797 – 3,800
Higher Sell Zone: 3,813 – 3,815
Market Structure
After the deep drop, Gold rebounded and held above 3,76x.
Bullish trend remains intact, but waves of volatility may occur near higher resistance zones.
🎯 Captain’s Map – Trade Plan
✅ Buy (priority)
Buy Scalp OB
Entry: 3,754 – 3,757
SL: 3,747
TP: 3,762 – 3,767 – 3,772 – 3,777 – 3,782
Buy Zone OB
Entry: 3,741 – 3,744
SL: 3,732
TP: 3,749 – 3,754 – 3,759 – 3,764 – 3,769
⚡ Sell (short scalp – lower RR)
Sell Scalp Zone
Entry: 3,797 – 3,800
SL: 3,806
TP: 3,795 – 3,790 – 3,785 – 3,780 – 3,775
Higher Sell Zone
Entry: 3,813 – 3,815
SL: 3,823
TP: 3,810 – 3,805 – 3,800 – 3,795 – 3,790
⚓ Captain’s Note
“The Golden ship rocked violently overnight but still anchored firmly at Golden Harbor 🏝️ (3,754 – 3,741) . Profit-taking waves may still rise at Storm Breaker 🌊 (3,797 – 3,815) , suitable for short Quick Boarding 🚤 scalps. Yet the main voyage continues north – Buy the Dip remains the compass to follow the strong winds.”
📢 If you find the Captain’s Log useful, don’t forget to Follow for the latest signals.
💬 Got your own view on Gold? Share it in the comments and join the crew discussion!
Bearish reversal off 50% Fibonacci resistance?GBP/JPY is rising towards the pivot which aligns with the 50% Fibonacci retracement, and could reverse to the 1st support which is a pullback support.
Pivot: 200.21
1st Support: 199
1st Resistance: 201.14
Disclaimer:
The above opinions given constitute general market commentary, and do not constitute the opinion or advice of IC Markets or any form of personal or investment advice.
Any opinions, news, research, analyses, prices, other information, or links to third-party sites contained on this website are provided on an "as-is" basis, are intended only to be informative, is not an advice nor a recommendation, nor research, or a record of our trading prices, or an offer of, or solicitation for a transaction in any financial instrument and thus should not be treated as such. The information provided does not involve any specific investment objectives, financial situation and needs of any specific person who may receive it. Please be aware, that past performance is not a reliable indicator of future performance and/or results. Past Performance or Forward-looking scenarios based upon the reasonable beliefs of the third-party provider are not a guarantee of future performance. Actual results may differ materially from those anticipated in forward-looking or past performance statements. IC Markets makes no representation or warranty and assumes no liability as to the accuracy or completeness of the information provided, nor any loss arising from any investment based on a recommendation, forecast or any information supplied by any third-party.

XAUUSD – Pressure at 3777 zone XAUUSD – Pressure at 3777 zone, adjustment scenario and trend-following buy
Technical Analysis
After a strong upward move, gold (XAUUSD) is now approaching the resistance zone of 3777–3780, where it converges with the Fibonacci expansion cluster and the old resistance structure. This is a price area prone to short-term selling pressure, and a decisive point for the next trend.
EMA200 (H1: 3685) is still clearly sloping upwards → the main trend remains upward, but the market is in a state of range expansion, with a potential adjustment phase before continuing upward.
RSI (14) is currently oscillating around 57–60, indicating that the upward momentum has cooled, not yet entering the overbought zone but posing a risk of divergence if a new peak is formed without accompanying momentum.
Volume Profile levels and support zones 3738–3740 / 3719–3722 / 3661–3665 will be where buyers can react to protect the main trend.
Trading Scenarios
Scenario 1 – Sell adjustment at resistance zone:
Entry: 3777–3780
SL: 3784
TP: 3755 – 3742 – 3730 – 3705
Scenario 2 – Short-term scalping buy:
Entry: 3738–3740
SL: 3734
TP: 3747 – 3755 – 3770
Scenario 3 – Trend-following buy (priority when deep adjustment):
Entry: 3719–3722
SL: 3715
TP: 3728 – 3740 – 3765 – 3780
Price Zones to Watch
3777–3780: critical resistance, potential Sell zone.
3738–3740: nearby support, suitable for scalping buy.
3719–3722: main Buy zone for recovery, confluence of support structure.
3705: deep support, target if adjustment trend expands.
Outlook
The major trend for gold still leans towards upward, however, the 3777–3780 zone currently plays a decisive role. Sellers can take advantage of short-term Sell to catch the adjustment phase, while buyers should wait for prices to pull back to support zones to enter trend-following orders.
This is a reference scenario based on technical analysis, not an investment recommendation. Stay tuned for earlier analyses and prepare well for your trading plan.

Bullish momentum to extend?EUR/JPY is falling towards the pivot and could bounce to the 1st resistance.
Pivot: 173.78
1st Support: 173.09
1st Resistance: 175.01
Disclaimer:
The above opinions given constitute general market commentary, and do not constitute the opinion or advice of IC Markets or any form of personal or investment advice.
Any opinions, news, research, analyses, prices, other information, or links to third-party sites contained on this website are provided on an "as-is" basis, are intended only to be informative, is not an advice nor a recommendation, nor research, or a record of our trading prices, or an offer of, or solicitation for a transaction in any financial instrument and thus should not be treated as such. The information provided does not involve any specific investment objectives, financial situation and needs of any specific person who may receive it. Please be aware, that past performance is not a reliable indicator of future performance and/or results. Past Performance or Forward-looking scenarios based upon the reasonable beliefs of the third-party provider are not a guarantee of future performance. Actual results may differ materially from those anticipated in forward-looking or past performance statements. IC Markets makes no representation or warranty and assumes no liability as to the accuracy or completeness of the information provided, nor any loss arising from any investment based on a recommendation, forecast or any information supplied by any third-party.

Bullish bounce?EUR/GBP is falling towards the pivot and could bounce to the 1st resistance.
Pivot: 0.8713
1st Support: 0.8680
1st Resistance: 0.8763
Disclaimer:
The above opinions given constitute general market commentary, and do not constitute the opinion or advice of IC Markets or any form of personal or investment advice.
Any opinions, news, research, analyses, prices, other information, or links to third-party sites contained on this website are provided on an "as-is" basis, are intended only to be informative, is not an advice nor a recommendation, nor research, or a record of our trading prices, or an offer of, or solicitation for a transaction in any financial instrument and thus should not be treated as such. The information provided does not involve any specific investment objectives, financial situation and needs of any specific person who may receive it. Please be aware, that past performance is not a reliable indicator of future performance and/or results. Past Performance or Forward-looking scenarios based upon the reasonable beliefs of the third-party provider are not a guarantee of future performance. Actual results may differ materially from those anticipated in forward-looking or past performance statements. IC Markets makes no representation or warranty and assumes no liability as to the accuracy or completeness of the information provided, nor any loss arising from any investment based on a recommendation, forecast or any information supplied by any third-party.

Gold price analysis September 25The corrective downtrend is heading towards the next important support zones 3701 and 3671. Today's strategy is still looking for better SELL points. Pay attention to price reactions at important support zones. If it is confirmed that buyers want to jump into the market, we can follow that buying force to execute BUY strategies. 3750 plays an important role today and the SELL strategy will no longer be effective when this zone is broken.

World gold prices are experiencing profit-taking. After soaring to nearly $3,800 an ounce, world gold prices are facing profit-taking. Rising US new home sales have put pressure on the precious metal.
According to a report released on Wednesday by the US Census Bureau and the Department of Housing and Urban Development, new home sales increased 20.5% last month to an annualized rate of 800,000 units, compared to an adjusted rate of 664,000 units in July.
New home sales increased 15.4% year-on-year and are now at their highest level since February 2022.
Despite the decline, world gold prices still receive positive forecasts from experts. Bart Melek - Managing Director, Head of Global Commodity Strategy at TD Securities predicts that gold prices could reach $4,000/ounce in the short term as central banks, especially China and many emerging markets, will buy millions of ounces more to increase their reserve ratios.
The main reason is that the US Federal Reserve (FED) continues to loosen monetary policy as it enters 2026. There is a high possibility of another interest rate cut this year, or even two, although the FED Chairman did not confirm it clearly in his speech on Tuesday," Melek said in an interview on Tuesday.


Potential bullish rise?GBP/CAD has bounced off the support level which is a pullback support that aligns with the 50% Fibonacci retracement and could rise from this level to our take profit.
Entry: 1.8640
Why we like it:
There is a pullback support that aligns with the 50% Fibonacci retracement.
Stop loss: 1.8554
Why we like it:
There is a pullback support level.
Take profit: 1.8821
Why we like it:
There is a multi-swing high resistance.
Enjoying your TradingView experience? Review us!
Please be advised that the information presented on TradingView is provided to Vantage (‘Vantage Global Limited’, ‘we’) by a third-party provider (‘Everest Fortune Group’). Please be reminded that you are solely responsible for the trading decisions on your account. There is a very high degree of risk involved in trading. Any information and/or content is intended entirely for research, educational and informational purposes only and does not constitute investment or consultation advice or investment strategy. The information is not tailored to the investment needs of any specific person and therefore does not involve a consideration of any of the investment objectives, financial situation or needs of any viewer that may receive it. Kindly also note that past performance is not a reliable indicator of future results. Actual results may differ materially from those anticipated in forward-looking or past performance statements. We assume no liability as to the accuracy or completeness of any of the information and/or content provided herein and the Company cannot be held responsible for any omission, mistake nor for any loss or damage including without limitation to any loss of profit which may arise from reliance on any information supplied by Everest Fortune Group.

Bullish bounce off?EUR/AUD has bounced off the support level which is a pullback support that aligns with the 38.2% Fibonacci retracement and could rise from this level to our take profit.
Entry: 1.7806
Why we like it:
There is a pullback support that aligns with the 38.2% Fibonacci retracement.
Stop loss: 1.7702
Why we like it:
There is a pullback support that is slightly below the 61.8% Fibonacci retracement.
Take profit: 1.7968
Why we like it:
There is a pullback resistance that is slightly above the 61.8% Fibonacci retracement.
Enjoying your TradingView experience? Review us!
Please be advised that the information presented on TradingView is provided to Vantage (‘Vantage Global Limited’, ‘we’) by a third-party provider (‘Everest Fortune Group’). Please be reminded that you are solely responsible for the trading decisions on your account. There is a very high degree of risk involved in trading. Any information and/or content is intended entirely for research, educational and informational purposes only and does not constitute investment or consultation advice or investment strategy. The information is not tailored to the investment needs of any specific person and therefore does not involve a consideration of any of the investment objectives, financial situation or needs of any viewer that may receive it. Kindly also note that past performance is not a reliable indicator of future results. Actual results may differ materially from those anticipated in forward-looking or past performance statements. We assume no liability as to the accuracy or completeness of any of the information and/or content provided herein and the Company cannot be held responsible for any omission, mistake nor for any loss or damage including without limitation to any loss of profit which may arise from reliance on any information supplied by Everest Fortune Group.

Bearish reversal off multi swing high resistance?EUR/GBP is reacting off the resistance level which is a multi-swing high resistance that aligns with the 127.2% Fibonacci extension and could drop from this level to our take profit.
Entry: 0.8737
Why we like it:
There is a multi-swing high resistance that lines up with the 127.2% Fibonacci extension.
Stop loss: 0.8762
Why we like it:
There is a resistance level at the 161.8% Fibonacci extension.
Take profit: 0.8681
Why we like it:
There is a pullback support that is slightly below the 50% Fibonacci retracement.
Enjoying your TradingView experience? Review us!
Please be advised that the information presented on TradingView is provided to Vantage (‘Vantage Global Limited’, ‘we’) by a third-party provider (‘Everest Fortune Group’). Please be reminded that you are solely responsible for the trading decisions on your account. There is a very high degree of risk involved in trading. Any information and/or content is intended entirely for research, educational and informational purposes only and does not constitute investment or consultation advice or investment strategy. The information is not tailored to the investment needs of any specific person and therefore does not involve a consideration of any of the investment objectives, financial situation or needs of any viewer that may receive it. Kindly also note that past performance is not a reliable indicator of future results. Actual results may differ materially from those anticipated in forward-looking or past performance statements. We assume no liability as to the accuracy or completeness of any of the information and/or content provided herein and the Company cannot be held responsible for any omission, mistake nor for any loss or damage including without limitation to any loss of profit which may arise from reliance on any information supplied by Everest Fortune Group.

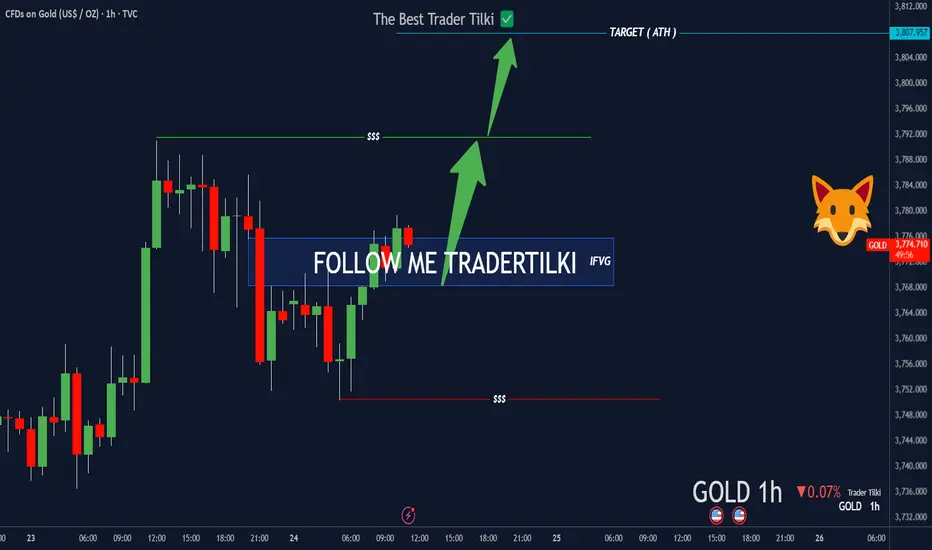
XAUUSD-Gold Game Just Changed: Post-FVG Violation SetupHey Traders,
Gold is currently sitting at 3774. From here, I’m aiming straight for 3807.
Why?
FVG got violated—we now have a clean IFVG.
That’s why my target is locked: 3807.
Set your stop-loss based on your own margin.
I believe we’ll hit that level sooner or later.
Every single like you drop keeps me motivated
to keep sharing these insights.
Big thanks to everyone supporting!
Bearish drop off?NZD/JPY has rejected off the resistance level which is a pullback resistance that lines up with the 23.6% Fibonacci retracement and could drop from this level to our take profit.
Entry: 86.73
Why we like it:
There is a pullback resistance that lines up with the 23.6% Fibonacci retracement.
Stop loss: 87.25
Why we like it:
There is a pullback resistance that is slightly above the 50% Fibonacci retracement.
Take profit: 85.73
Why we like it:
There is a swing low support.
Enjoying your TradingView experience? Review us!
Please be advised that the information presented on TradingView is provided to Vantage (‘Vantage Global Limited’, ‘we’) by a third-party provider (‘Everest Fortune Group’). Please be reminded that you are solely responsible for the trading decisions on your account. There is a very high degree of risk involved in trading. Any information and/or content is intended entirely for research, educational and informational purposes only and does not constitute investment or consultation advice or investment strategy. The information is not tailored to the investment needs of any specific person and therefore does not involve a consideration of any of the investment objectives, financial situation or needs of any viewer that may receive it. Kindly also note that past performance is not a reliable indicator of future results. Actual results may differ materially from those anticipated in forward-looking or past performance statements. We assume no liability as to the accuracy or completeness of any of the information and/or content provided herein and the Company cannot be held responsible for any omission, mistake nor for any loss or damage including without limitation to any loss of profit which may arise from reliance on any information supplied by Everest Fortune Group.

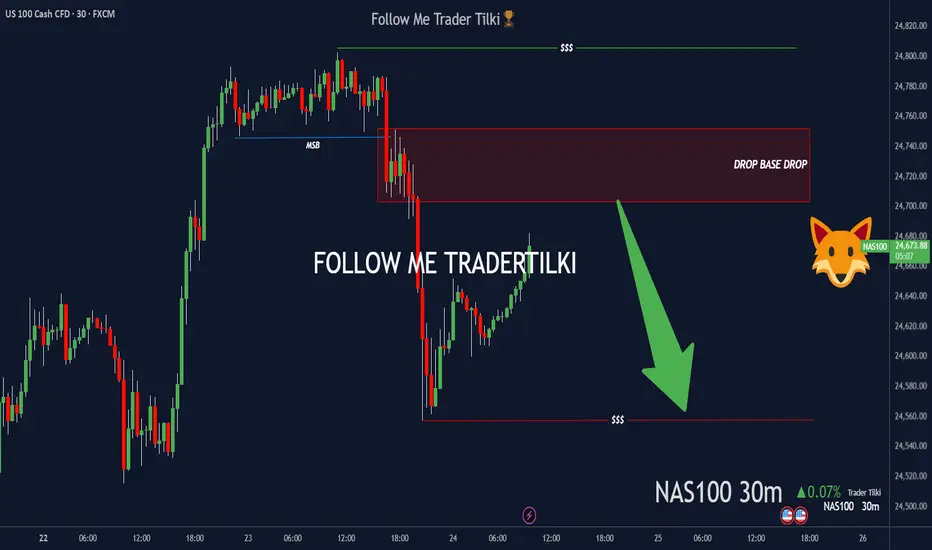
Pressure’s buildin’ on NAS100—could pop any minute.Hey Guys,
Once NAS100 hits my SELL zone, I’m pulling the trigger—targeting 24557.06
• Entry: 24752.05 or 24703.29
Set the stop point according to your own margin, my friends.
Every like you drop pushes me to share more setups like this. Big thanks to everyone showing support!
CHFJPY: To The New Highs 🇨🇭🇯🇵
CHFJPY has recently broken and closed above a major daily resistance.
As I predicted earlier, the price managed to reach 187.0 psychological level
after a retest of the underlined area.
Watching how strong is a bullish pressure today, I think that there will be a high
chance to see a further bullish continuation.
The next strong resistance is 188.0.
It will be the next goal for the buyers.
❤️Please, support my work with like, thank you!❤️
I am part of Trade Nation's Influencer program and receive a monthly fee for using their TradingView charts in my analysis.

Price breaks the 3,740 OB → bearish BOS → liquidity target at 3,1. Overall Picture
After a strong bullish rally, price formed a double top → distribution phase signal.
The 3,740 zone is currently acting as a liquidity zone (area holding buy-side stop-losses from bottom pickers).
2. Order Block (OB)
Before the strong bullish move, there was a Bullish Order Block around 3,740 – 3,750.
Now price is retesting this OB → if it breaks, the bearish momentum will likely be confirmed.
3. Break of Structure (BOS) & Change of Character (ChoCh)
At the 3,790 high, the structure showed a ChoCh (shift from bullish → bearish).
If price breaks below the 3,740 zone → it will form a clear bearish BOS, confirming a medium-term downtrend.
4. Liquidity Hunt
The 3,740 support is packed with buy stop-loss orders.
A sharp break below this level could trigger a liquidity hunt, allowing “big players” to accumulate around 3,690 – 3,700 before a potential rebound.
5. SMC Scenarios
Bearish scenario (primary): Price breaks the 3,740 OB → bearish BOS → liquidity target at 3,690.
Bullish scenario (less likely): If price reacts strongly at the 3,740 OB with a bullish engulfing candle → price could retest the supply zone near 3,770 – 3,780 before resuming its decline.
👉 In summary: Under SMC, the downside target at 3,690 – 3,700 is the main scenario, after which we should watch if “big players” push the market back up to continue the broader uptrend.
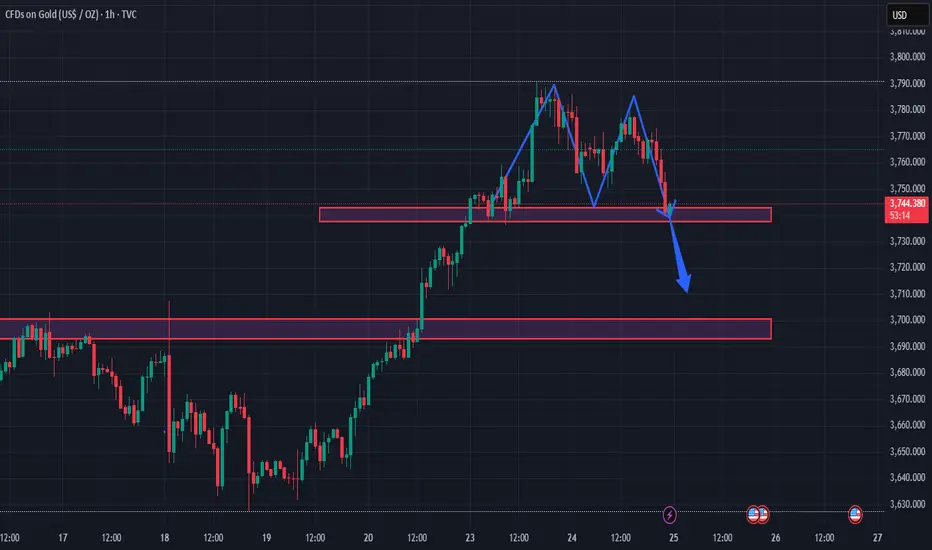
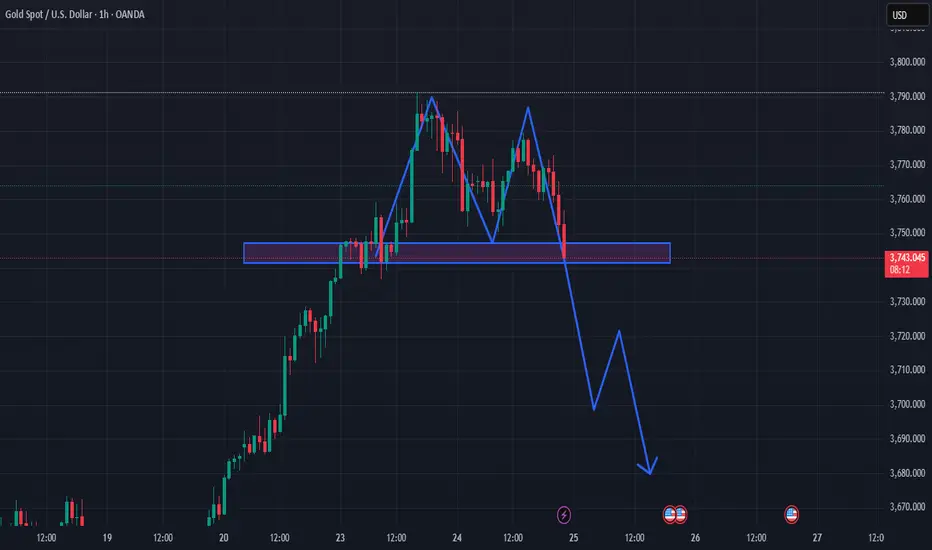
: likely to panic-sell once support breaks, triggering stop-loss1. Price Structure
Previous trend: strong uptrend (from the 20th to the 23rd).
After reaching the ~3,790 peak: the market formed two lower highs → a sign of weakness.
The price is now retesting the key support zone around 3,740 – 3,750 (blue box).
2. Technical Pattern
This looks like a Double Top / variant of Head & Shoulders, signaling a bearish reversal.
The blue box area is the neckline – if broken, the pattern completes and the downtrend scenario has high probability.
3. Price Scenarios
If the 3,740 support breaks decisively:
Price may drop quickly towards 3,700 – 3,710 (nearest support).
Further down, it could retest the 3,670 – 3,680 area, as shown by your blue arrow.
If the 3,740 support holds:
Price could bounce back, forming a sideways consolidation before the next move.
However, the probability of a strong recovery is lower, as buying momentum has weakened.
4. Market Sentiment
Retail traders: likely to panic-sell once support breaks, triggering stop-loss cascades.
Big players / institutions: may take advantage around 3,700 to accumulate again after “stop-loss hunting” retailers.
👉 Conclusion: This is a short-term bearish scenario.
For existing long positions, consider taking profit / protecting capital if support breaks.
For dip buyers, it’s safer to wait for a positive reaction around 3,700 – 3,680.
Is This the Next Bullish Wave for USD/CAD Traders?💵 USD/CAD "THE LOONIE" | Forex Market Wealth Strategy Map (Swing/Day Trade)
📊 Trade Plan: BULLISH Outlook
Entry Style (Thief Layering Strategy):
Multiple buy limit orders layered around 🔑 key levels.
Example layers:
🟢 1.37600
🟢 1.37700
🟢 1.37800
🟢 1.37900
🟢 1.38000
(You can increase or reduce your own limit layers depending on risk & style).
Stop Loss (Thief SL 🚨):
🛑 Suggested protective stop @ 1.37400
⚠️ Note to my OG Thief crew: This SL is just my style. You are free to choose your own SL — manage your risk your way.
Target (Police Trap Exit 🎯):
👮♂️ Strong resistance + overbought conditions = possible trap zone.
🎯 Target: 1.39200
⚠️ Note: Same as above — this TP is my roadmap, but you choose how & when to take profits. Escape smart!
🔍 Key Market Outlook
USD/CAD shows bullish momentum supported by USD resilience and CAD lagging on weaker oil flows.
Macro View: Fed’s tone + oil market softness = stronger USD pressure on CAD.
Sentiment Check: Buyers layering in, market showing gradual accumulation.
Police (resistance) spotted higher up — profit-taking advised before getting caught in the trap!
🔗 Related Pairs to Watch & Correlations
💹 TVC:DXY → Dollar Index (tracks USD strength 💪).
🛢 BLACKBULL:WTI Crude Oil → CAD correlation 🔑 (weaker oil = weaker CAD).
💶 FX:EURUSD / FX:GBPUSD → Inverse flows vs USD.
🇲🇽 FX:USDMXN → Another USD + commodity-linked pair to compare moves.
Keeping an eye on these helps confirm momentum across markets ✅.
✨ “If you find value in my analysis, a 👍 and 🚀 boost is much appreciated — it helps me share more setups with the community!”
⚠️ Disclaimer: This is a Thief style trading strategy 🥷 created for fun & educational sharing only. This is not financial advice. Trade at your own risk.
#USDCAD #Forex #SwingTrade #DayTrading #TradingStrategy #Loonie #ThiefStyle #FXCorrelations #Dollar #CAD #ForexCommunity

GER40’s playin’ games—might be time to strike.Hey Guys,
Once GER40 hits my buy zone, I’m pulling the trigger—targeting 23691.52
• ENTRY:23552.12
Every like you drop pushes me to share more setups like this. Big thanks to everyone showing support!

AVAX/USDT: Rebound from Trendline Support Signals Bullish ContinAVAX/USDT has rebounded from the upward trendline, reclaiming bullish momentum after rejecting support near 33.20. The price structure reflects an initial impulse leg, followed by a corrective pullback and a false break, before bulls regained control.
As long as price holds above the 33.00 support level, the market is likely to continue its push toward the 37.00 resistance zone and potentially beyond. The upward trendline continues to act as dynamic support, keeping the bullish outlook intact with momentum favoring further gains.

USD/CAD: Climbing Within Channel But Facing Overhead ResistanceUSD/CAD has rebounded sharply from a double bottom near 1.3700 and is now moving within an upward channel. The current structure features lower highs, limited by a descending red resistance trendline, while buyers aim to push toward the 1.3868–1.3924 resistance zone.
If the price fails to break and hold above 1.3868, a rejection could trigger a move back toward the 1.3800 support level. In the broader context, this advance appears to be a corrective upswing within a larger resistance area, where sellers remain active and could reassert control.
