AUDUSD: Bullish Move From Support 🇦🇺🇺🇸
AUDUSD will likely bounce from a key intraday/daily support.
A double bottom pattern on that provides a reliable confirmation.
Expect a rise at least to 0.6535
❤️Please, support my work with like, thank you!❤️
I am part of Trade Nation's Influencer program and receive a monthly fee for using their TradingView charts in my analysis.
Forexsignals

EUR/USD Bearish Rejection from TrendlineEUR/USD shows rejection from the descending trendline near resistance, signaling potential bearish momentum. Price is expected to drop toward the 1.15300 support and FVG zone for possible reversal or continuation.

GBPUSD Pullback or Trap? Watch These Levels Closely!It seems that GBPUSD ( FX:GBPUSD ) has broken below its Heavy Support zone($1.343-$1.313) and the 200_EMA(Daily) , and is currently pulling back up to retest that area.
From an Elliott Wave perspective , it looks like GBPUSD is completing a microwave 4, and overall the corrective structure appears to be a Double Three Correction(WXY) .
My expectation is that GBPUSD could decline at least back down to around its previous low , roughly around $1.300 AFTER breaking the support line .
Take Profit(1): $1.3054
Take Profit(2): $1.3019
Take Profit(3): $1.2957
Stop Loss(SL): $1.3302(Worst)
Note: Keep in mind that some important U.S. indices and data are going to be released this week, especially around November 13th and 14th. If GBPUSD hasn’t reached its targets by then, you might want to manage your positions accordingly and keep an eye out for updates.
Please respect each other's ideas and express them politely if you agree or disagree.
British Pound / U.S Dollar Analysis (GBPUSD), 4-hour time frame.
Be sure to follow the updated ideas.
Do not forget to put a Stop loss for your positions (For every position you want to open).
Please follow your strategy and updates; this is just my Idea, and I will gladly see your ideas in this post.
Please do not forget the ✅' like '✅ button 🙏😊 & Share it with your friends; thanks, and Trade safe.

EUR/CAD: Rejection at Trendline Keeps Downtrend IntactEUR/CAD was rejected near the 1.6300 descending trendline after an impulsive bounce, confirming resistance within a bearish structure. Price remains inside a downward channel, with lower highs reinforcing seller control.
As long as price stays below 1.6250, a drop toward the 1.6135–1.6100 support zone is likely, in line with the ongoing correction phase from October’s highs.
❗️ Risks:
– Break above 1.6250 could shift short-term bias bullish.
– Strong Eurozone inflation data may lift the euro.
– Weak Canadian jobs data could limit CAD strength.

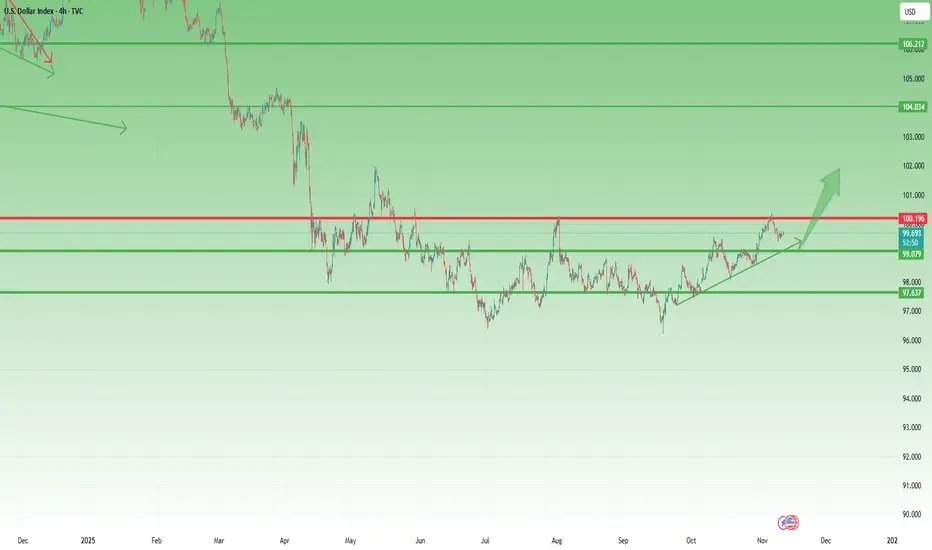
DXY Pulls Back from 100 – A Healthy Correction, Not a Reversal1. What Happened Since Last Week
In last week’s DXY analysis, I warned that although the U.S. Dollar Index remains in a broader uptrend, the 100.00 level represents both a strong technical and psychological resistance that could trigger a short-term retracement.
That scenario played out almost perfectly — after a brief spike above 100, DXY rolled over and is now trading near 99.70.
2. Market Context
The pullback so far looks orderly, not impulsive, suggesting that this move is a correction within an ongoing bullish structure, rather than the start of a major reversal. The market is simply digesting gains after a move higher.
3. Technical Outlook
The area between 99.00 and 99.20 stands out as a key confluence support zone, combining horizontal structure with the up trend line. This is where I expect buyers to reemerge if the index continues to drift lower.
4. Trading Plan
If DXY dips into 99.00–99.20, I’ll look for signs of USD strength resuming — specifically by considering short setups on GBP/USD and EUR/USD.
5. Conclusion
The dollar remains in an uptrend, and this pullback appears to be healthy, not bearish. As long as DXY holds above 99.00, the broader bullish bias remains intact, and traders should prepare for a possible rebound in the next sessions. 💵
Bearish reversal off key resistance?EUR/GBP is rising towards the resistance level, which is a pullback resistance slightly above the 38.2% Fibonacci retracement, and could potentially reverse from this level to our take-profit.
Entry: 0.878
Why we like it:
There is a pullback resistance that is slightly above the 38.2% Fibonacci retracement.
Stop loss: 0.8795
Why we like it:
There is a pullback resistance that aligns with the 61.8% Fibonacci retracement.
Take profit: 0.8764
Why we like it:
There is a pullback support level.
Enjoying your TradingView experience? Review us!
Please be advised that the information presented on TradingView is provided to Vantage (‘Vantage Global Limited’, ‘we’) by a third-party provider (‘Everest Fortune Group’). Please be reminded that you are solely responsible for the trading decisions on your account. There is a very high degree of risk involved in trading. Any information and/or content is intended entirely for research, educational and informational purposes only and does not constitute investment or consultation advice or investment strategy. The information is not tailored to the investment needs of any specific person and therefore does not involve a consideration of any of the investment objectives, financial situation or needs of any viewer that may receive it. Kindly also note that past performance is not a reliable indicator of future results. Actual results may differ materially from those anticipated in forward-looking or past performance statements. We assume no liability as to the accuracy or completeness of any of the information and/or content provided herein and the Company cannot be held responsible for any omission, mistake nor for any loss or damage including without limitation to any loss of profit which may arise from reliance on any information supplied by Everest Fortune Group.Please be advised that the information presented on TradingView is provided to Vantage (‘Vantage Global Limited’, ‘we’) by a third-party provider (‘Everest Fortune Group’). Please be reminded that you are solely responsible for the trading decisions on your account. There is a very high degree of risk involved in trading. Any information and/or content is intended entirely for research, educational and informational purposes only and does not constitute investment or consultation advice or investment strategy. The information is not tailored to the investment needs of any specific person and therefore does not involve a consideration of any of the investment objectives, financial situation or needs of any viewer that may receive it. Kindly also note that past performance is not a reliable indicator of future results. Actual results may differ materially from those anticipated in forward-looking or past performance statements. We assume no liability as to the accuracy or completeness of any of the information and/or content provided herein and the Company cannot be held responsible for any omission, mistake nor for any loss or damage including without limitation to any loss of profit which may arise from reliance on any information supplied by Everest Fortune Group.

GBPJPY: Bearish Move From Resistance 🇬🇧🇯🇵
There is a high probability that GBPJPY will retrace
from the underlined resistance.
A double top pattern on that and a formation of a bearish imbalance
provide a strong signal.
Goal - 202.7
❤️Please, support my work with like, thank you!❤️
I am part of Trade Nation's Influencer program and receive a monthly fee for using their TradingView charts in my analysis.

Bullish bounce off pullback support?NZD/JPY has bounced off the support level, which serves as a pullback support that aligns with the 38.2% Fibonacci retracement and could rise from this level to our take-profit target.
Entry: 86.64
Why we like it:
There is a pullback support that aligns with the 38.2% Fibonacci retracement.
Stop loss: 86.64
Why we like it:
There is a pullback support level that aligns with the 61.8% Fibonacci retracement.
Take profit: 87.40
Why we like it:
There is a support level that aligns with the 50% Fibonacci retracement.
Enjoying your TradingView experience? Review us!
Please be advised that the information presented on TradingView is provided to Vantage (‘Vantage Global Limited’, ‘we’) by a third-party provider (‘Everest Fortune Group’). Please be reminded that you are solely responsible for the trading decisions on your account. There is a very high degree of risk involved in trading. Any information and/or content is intended entirely for research, educational and informational purposes only and does not constitute investment or consultation advice or investment strategy. The information is not tailored to the investment needs of any specific person and therefore does not involve a consideration of any of the investment objectives, financial situation or needs of any viewer that may receive it. Kindly also note that past performance is not a reliable indicator of future results. Actual results may differ materially from those anticipated in forward-looking or past performance statements. We assume no liability as to the accuracy or completeness of any of the information and/or content provided herein and the Company cannot be held responsible for any omission, mistake nor for any loss or damage including without limitation to any loss of profit which may arise from reliance on any information supplied by Everest Fortune Group.

Bearish momentum to extend?Kiwi (NZD/USD) is rising towards the pivot and could reverse to the 1st support, which aligns witht he 161.8% Fibonacci extension.
Pivot: 0.5689
1st Support: 0.5614
1st Resistance: 0.5760
Disclaimer:
The above opinions given constitute general market commentary, and do not constitute the opinion or advice of IC Markets or any form of personal or investment advice.
Any opinions, news, research, analyses, prices, other information, or links to third-party sites contained on this website are provided on an "as-is" basis, are intended only to be informative, is not an advice nor a recommendation, nor research, or a record of our trading prices, or an offer of, or solicitation for a transaction in any financial instrument and thus should not be treated as such. The information provided does not involve any specific investment objectives, financial situation and needs of any specific person who may receive it. Please be aware, that past performance is not a reliable indicator of future performance and/or results. Past Performance or Forward-looking scenarios based upon the reasonable beliefs of the third-party provider are not a guarantee of future performance. Actual results may differ materially from those anticipated in forward-looking or past performance statements. IC Markets makes no representation or warranty and assumes no liability as to the accuracy or completeness of the information provided, nor any loss arising from any investment based on a recommendation, forecast or any information supplied by any third-party.

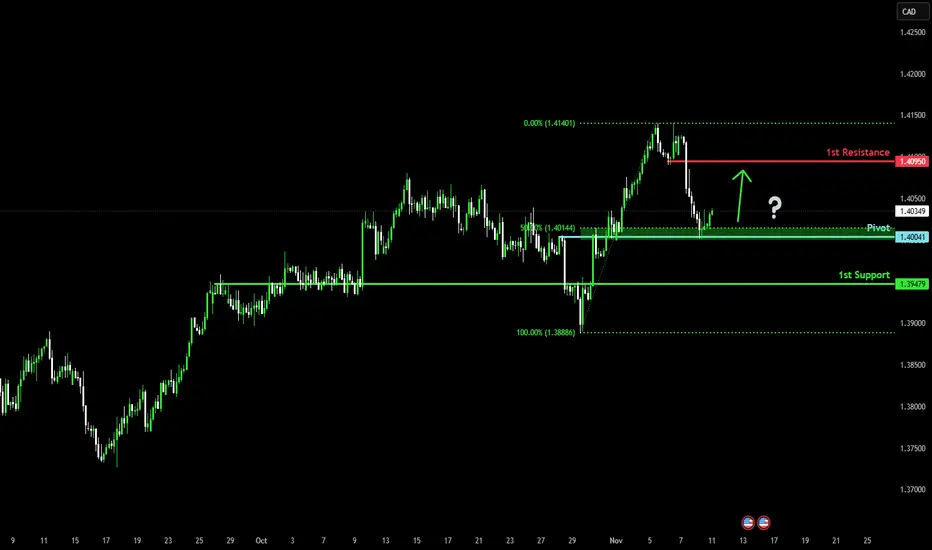
Bullish reversal?Loonie (USD/CAD) has bounced off the pivot and could rise to the 1st resistance, which acts as a pullback resistance.
Pivot: 1.4004
1st Support: 1.3947
1st Resistance: 1.4095
Disclaimer:
The above opinions given constitute general market commentary, and do not constitute the opinion or advice of IC Markets or any form of personal or investment advice.
Any opinions, news, research, analyses, prices, other information, or links to third-party sites contained on this website are provided on an "as-is" basis, are intended only to be informative, is not an advice nor a recommendation, nor research, or a record of our trading prices, or an offer of, or solicitation for a transaction in any financial instrument and thus should not be treated as such. The information provided does not involve any specific investment objectives, financial situation and needs of any specific person who may receive it. Please be aware, that past performance is not a reliable indicator of future performance and/or results. Past Performance or Forward-looking scenarios based upon the reasonable beliefs of the third-party provider are not a guarantee of future performance. Actual results may differ materially from those anticipated in forward-looking or past performance statements. IC Markets makes no representation or warranty and assumes no liability as to the accuracy or completeness of the information provided, nor any loss arising from any investment based on a recommendation, forecast or any information supplied by any third-party.
Bearish drop off?Swissie (USD/CHF) has rejected off the pivot, which acts as a pullback resistance and could drop to the 1st support.
Pivot: 0.8076
1st Support: 0.8009
1st Resistance: 0.8127
Disclaimer:
The above opinions given constitute general market commentary, and do not constitute the opinion or advice of IC Markets or any form of personal or investment advice.
Any opinions, news, research, analyses, prices, other information, or links to third-party sites contained on this website are provided on an "as-is" basis, are intended only to be informative, is not an advice nor a recommendation, nor research, or a record of our trading prices, or an offer of, or solicitation for a transaction in any financial instrument and thus should not be treated as such. The information provided does not involve any specific investment objectives, financial situation and needs of any specific person who may receive it. Please be aware, that past performance is not a reliable indicator of future performance and/or results. Past Performance or Forward-looking scenarios based upon the reasonable beliefs of the third-party provider are not a guarantee of future performance. Actual results may differ materially from those anticipated in forward-looking or past performance statements. IC Markets makes no representation or warranty and assumes no liability as to the accuracy or completeness of the information provided, nor any loss arising from any investment based on a recommendation, forecast or any information supplied by any third-party.

Heading into pullback resistance?Cable (GBP/USD) is rising towards the pivot, which has been identified as a pullback resistance and could reverse to the 1st support.
Pivot: 1.3257
1st Support: 1.3102
1st Resistance: 1.3319
Disclaimer:
The above opinions given constitute general market commentary, and do not constitute the opinion or advice of IC Markets or any form of personal or investment advice.
Any opinions, news, research, analyses, prices, other information, or links to third-party sites contained on this website are provided on an "as-is" basis, are intended only to be informative, is not an advice nor a recommendation, nor research, or a record of our trading prices, or an offer of, or solicitation for a transaction in any financial instrument and thus should not be treated as such. The information provided does not involve any specific investment objectives, financial situation and needs of any specific person who may receive it. Please be aware, that past performance is not a reliable indicator of future performance and/or results. Past Performance or Forward-looking scenarios based upon the reasonable beliefs of the third-party provider are not a guarantee of future performance. Actual results may differ materially from those anticipated in forward-looking or past performance statements. IC Markets makes no representation or warranty and assumes no liability as to the accuracy or completeness of the information provided, nor any loss arising from any investment based on a recommendation, forecast or any information supplied by any third-party.

Potential bearish reversal?Fiber (EUR/USD) is rising towards the pivot, which is a pullback resistance that aligns with the 61.8% Fibonacci retracement and could reverse to the 1st support, which acts as a pullback support.
Pivot: 1.1598
1st Support: 1.537
1st Resistance: 1.1669
Disclaimer:
The above opinions given constitute general market commentary, and do not constitute the opinion or advice of IC Markets or any form of personal or investment advice.
Any opinions, news, research, analyses, prices, other information, or links to third-party sites contained on this website are provided on an "as-is" basis, are intended only to be informative, is not an advice nor a recommendation, nor research, or a record of our trading prices, or an offer of, or solicitation for a transaction in any financial instrument and thus should not be treated as such. The information provided does not involve any specific investment objectives, financial situation and needs of any specific person who may receive it. Please be aware, that past performance is not a reliable indicator of future performance and/or results. Past Performance or Forward-looking scenarios based upon the reasonable beliefs of the third-party provider are not a guarantee of future performance. Actual results may differ materially from those anticipated in forward-looking or past performance statements. IC Markets makes no representation or warranty and assumes no liability as to the accuracy or completeness of the information provided, nor any loss arising from any investment based on a recommendation, forecast or any information supplied by any third-party.

Bullish bounce off 50% FIbonacci support?Dollar Index (DXY) has bounced off the pivot and could rise to the 1st resistance, which acts as a swing high resistance.
Pivot: 99.41
1st Support: 99.13
1st Resistance: 100.29
Disclaimer:
The above opinions given constitute general market commentary, and do not constitute the opinion or advice of IC Markets or any form of personal or investment advice.
Any opinions, news, research, analyses, prices, other information, or links to third-party sites contained on this website are provided on an "as-is" basis, are intended only to be informative, is not an advice nor a recommendation, nor research, or a record of our trading prices, or an offer of, or solicitation for a transaction in any financial instrument and thus should not be treated as such. The information provided does not involve any specific investment objectives, financial situation and needs of any specific person who may receive it. Please be aware, that past performance is not a reliable indicator of future performance and/or results. Past Performance or Forward-looking scenarios based upon the reasonable beliefs of the third-party provider are not a guarantee of future performance. Actual results may differ materially from those anticipated in forward-looking or past performance statements. IC Markets makes no representation or warranty and assumes no liability as to the accuracy or completeness of the information provided, nor any loss arising from any investment based on a recommendation, forecast or any information supplied by any third-party.

Gold price analysis October 11✨ Gold Analysis XAUUSD – 10/11/2025
Gold price has officially broken the Keylevel 4031 zone, confirming a strong bullish wave is forming. This development makes the intraday trading strategy clearer and more favorable when giving full priority to BUY setups following the trend.
Main scenario:
✅ BUY right at the price zone 4045
✅ BUY when the price rejection signal appears around the support zone 4031
🎯 Profit target: 4150
Sub-scenario (low risk):
❌ SELL is only considered if a false break appears and the price closes the candle back below 3985 – however, this possibility is currently very low.
👉 Comment: The break zone 4031 is the perfect confirmation point for the uptrend. Prioritize looking for buying opportunities with the main wave instead of trading against the trend.

EUR/USD: Rebounding Off 1.15 as Buyers Eye Short-Term RecoveryEUR/USD is bouncing from the 1.15 psychological support after a fake breakdown of October’s low. Price is forming a short-term reversal inside a rising channel, hinting at a corrective bullish move.
If the pair holds above 1.1530, a push toward 1.1620 resistance is likely. Momentum supports a short-term bullish bias before the broader downtrend resumes.
❗️ Risks:
– A strong U.S. CPI print could trigger a sharp USD rally.
– Dovish ECB commentary may cap euro strength.
– Falling below 1.1520 invalidates the recovery setup.

XAU/USD – Gold Retests FVG Preparing for a New Uptrend, Target..📊 Market Structure
Gold has officially broken the bearish structure (BoS + ChoCH) by surpassing the 4,025 USD zone, confirming a significant shift in market momentum.
Following a series of consecutive BoS and a break of the downtrend line, the price is entering a balanced retest phase (FVG 4,030 – 4,040 USD) .
As long as the price maintains above the 4,020 USD support zone, the bullish structure remains intact, and it is expected to target the Liquidity Zone 4,070 – 4,090 USD , further extending to the Order Block 4,118 – 4,125 USD .
💎 Key Technical Zones
• FVG Retest Zone: 4,030 – 4,040 USD
• Trendline Support: around 4,000 USD
• Liquidity Zone: 4,070 – 4,090 USD
• Final Target (OB): 4,118 – 4,125 USD
🎯 Trading Plan
1️⃣ BUY Setup #1 – Main FVG Retest
If the price retraces to the FVG zone of 4,030 – 4,040 USD and forms a bullish confirmation signal (bullish candle / rejection wick):
• Entry: 4,033 – 4,038
• SL: 4,020
• TP1: 4,070
• TP2: 4,090
• TP3: 4,120
→ Enter at the “discount” zone after the market absorbs liquidity.
2️⃣ BUY Setup #2 – Defensive (deep trendline retest)
If the price slightly sweeps the small OB zone around the trendline:
• Entry: 3,998 – 4,004
• SL: 3,985
• TP1: 4,070
• TP2: 4,120
→ The structure remains intact, this entry has a high RR, suitable for mid-term swing.
⚠️ Invalidation:
• If the price closes an H1 candle below 3,985 USD → the short-term uptrend is invalidated.
🧠 Vincent’s View
The buyers are fully controlling the H1 structure after breaking the downtrend line that lasted nearly 2 weeks.
The price is likely to complete the FVG – trendline – breakout retest before continuing to expand towards the liquidity peak of 4,120 USD.
This is the “buy-the-dip” strategic phase for this week.
“Smart money buys the discount while everyone waits for confirmation.” ⚜️🟡
⏰ Timeframe: 1H
📅 Updated: 11/10/2025
✍️ Analysis by: Captain Vincent

USDJPY is ready to head to the upside - BUY NOW!For several weeks USDJPY has been stuck inside a strong upwards channel that it has not broken out of and keeps making more clear bullish signs. Recently the price touched the lower channel trend line (which acts as a support level) and bounced back up from it. Secondly, the price also broke above the white trendline which was acting as a strong resistance zone (the price then retraced back to the white trendline and treated it as a new support level) the next target has been drawn out on the chart - time to buy USDJPY!

TIME TO SELL EURUSD! amazing opportunity..EURUSD has recently broken a powerful channel that it was stuck in-between for several weeks and struggled to break upwards. The price also tried to retrace back to the upside but it struggled and could not break through the 0.618 level (which is acting as resistance). There is also a trendline which the price is struggling to break through towards the upside (resistance number 2). The price is very likely to keep dropping and head to our target zone (next major support level) - SELL !

Gold Price Rejection at Trendline – Pullback Toward 4075 TargetGold price is testing a key resistance trendline near the 4,110 level after a strong bullish rally. A potential pullback is expected toward the 4,075 target zone, aligning with a nearby support level and fair value gap (FVG).

XAUUSDHello Traders! 👋
What are your thoughts on Gold?
The $3,900 level continues to act as a key support zone for gold, preventing further downside pressure for now.
Currently, the price is consolidating between the highlighted support and resistance levels, showing range-bound behavior in the short term.
We expect gold to form a short-term upward correction toward the resistance zone, followed by a bearish rejection from that level.
If price fails to hold above $3,900 zone and breaks below the support, a deeper decline toward lower levels could follow.
As long as the $3,900 support holds, gold is likely to remain in a sideways structure, but a confirmed breakdown would signal the start of a new bearish leg.
Don’t forget to like and share your thoughts in the comments! ❤️

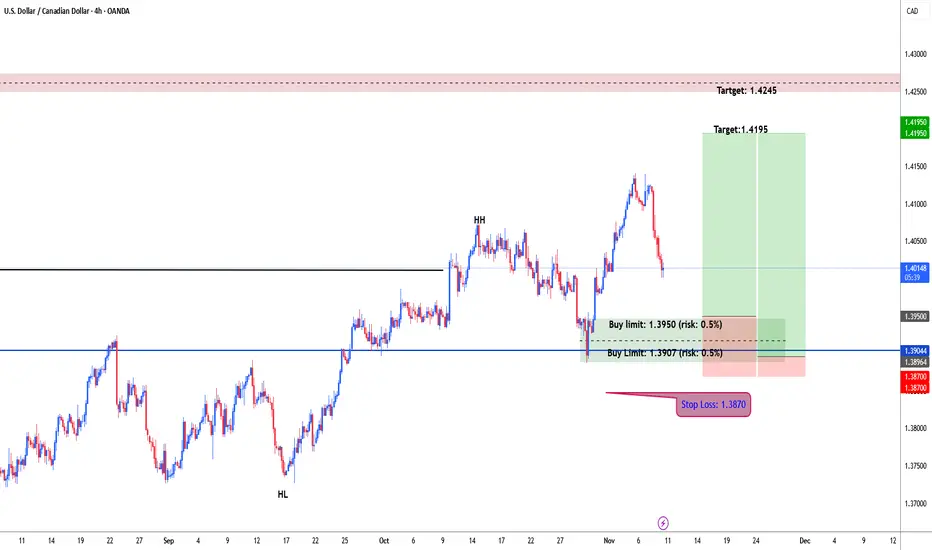
USDCAD possible bullish for 1.4195 & 1.4245#usdcad daily chart forming higher high and higher low. usdcad price broke and closed above 1.4016. wait for correction and test demand zone for another leg higher. i placed my orders at 1.3950 & 1.3906 each with 0.5% risk. stop loss: 1.3870. target: 1.4195 & 1.4245 as well.
EURJPY BUY THE TREND Will be using a buy limit to enter a buy on Eurjpy and will be keeping things simple with the trend following , very good trade and low risk higher chance to buy than sell
