EURUSD H4 | Bearish Reversal Off 78.6% Fibonacci ResistanceThe price is rising towards the sell entry, which is a pullback resistance that aligns with the 78.6% Fibonacci retracement and could potentially reverse to the downside from this level.
Sell entry is at 1.1718, which is a pullback resistance that lines up with the 78.6% Fibonacci retracement.
Stop loss is at 1.1776, which is a pullback resistance that lines up with the 61.8% Fibonacci retracement.
Take profit is at 1.1615, which is an overlap support.
High Risk Investment Warning
Trading Forex/CFDs on margin carries a high level of risk and may not be suitable for all investors. Leverage can work against you.
Stratos Markets Limited (tradu.com ):
CFDs are complex instruments and come with a high risk of losing money rapidly due to leverage. 65% of retail investor accounts lose money when trading CFDs with this provider. You should consider whether you understand how CFDs work and whether you can afford to take the high risk of losing your money.
Stratos Europe Ltd (tradu.com ):
CFDs are complex instruments and come with a high risk of losing money rapidly due to leverage. 66% of retail investor accounts lose money when trading CFDs with this provider. You should consider whether you understand how CFDs work and whether you can afford to take the high risk of losing your money.
Stratos Global LLC (tradu.com ):
Losses can exceed deposits.
Please be advised that the information presented on TradingView is provided to Tradu (‘Company’, ‘we’) by a third-party provider (‘TFA Global Pte Ltd’). Please be reminded that you are solely responsible for the trading decisions on your account. There is a very high degree of risk involved in trading. Any information and/or content is intended entirely for research, educational and informational purposes only and does not constitute investment or consultation advice or investment strategy. The information is not tailored to the investment needs of any specific person and therefore does not involve a consideration of any of the investment objectives, financial situation or needs of any viewer that may receive it. Kindly also note that past performance is not a reliable indicator of future results. Actual results may differ materially from those anticipated in forward-looking or past performance statements. We assume no liability as to the accuracy or completeness of any of the information and/or content provided herein and the Company cannot be held responsible for any omission, mistake nor for any loss or damage including without limitation to any loss of profit which may arise from reliance on any information supplied by TFA Global Pte Ltd.
The speaker(s) is neither an employee, agent nor representative of Tradu and is therefore acting independently. The opinions given are their own, constitute general market commentary, and do not constitute the opinion or advice of Tradu or any form of personal or investment advice. Tradu neither endorses nor guarantees offerings of third-party speakers, nor is Tradu responsible for the content, veracity or opinions of third-party speakers, presenters or participants.
Forexsignals

Bearish reversal off pullback resistance?The Kiwi (NZD/USD) is rising towards the pivot, which has been identified as an overlap resistance that is slightly below the 38.2% Fibonacci retracement and could drop to the pullback support.
Pivot: 0.5730
1st Support: 0.5708
1st Resistance: 0.5741
Disclaimer:
The above opinions given constitute general market commentary, and do not constitute the opinion or advice of IC Markets or any form of personal or investment advice.
Any opinions, news, research, analyses, prices, other information, or links to third-party sites contained on this website are provided on an "as-is" basis, are intended only to be informative, is not an advice nor a recommendation, nor research, or a record of our trading prices, or an offer of, or solicitation for a transaction in any financial instrument and thus should not be treated as such. The information provided does not involve any specific investment objectives, financial situation and needs of any specific person who may receive it. Please be aware, that past performance is not a reliable indicator of future performance and/or results. Past Performance or Forward-looking scenarios based upon the reasonable beliefs of the third-party provider are not a guarantee of future performance. Actual results may differ materially from those anticipated in forward-looking or past performance statements. IC Markets makes no representation or warranty and assumes no liability as to the accuracy or completeness of the information provided, nor any loss arising from any investment based on a recommendation, forecast or any information supplied by any third-party.

Bearish drop in play?The Swissie (USD/CHF) has reacted off the pivot and could potentially drop to the 1st support, which aligns with the 161.8% Fibonacci extension.
Pivot: 0.7947
1st Support: 0.7856
1st Resistance: 0.8010
Disclaimer:
The above opinions given constitute general market commentary, and do not constitute the opinion or advice of IC Markets or any form of personal or investment advice.
Any opinions, news, research, analyses, prices, other information, or links to third-party sites contained on this website are provided on an "as-is" basis, are intended only to be informative, is not an advice nor a recommendation, nor research, or a record of our trading prices, or an offer of, or solicitation for a transaction in any financial instrument and thus should not be treated as such. The information provided does not involve any specific investment objectives, financial situation and needs of any specific person who may receive it. Please be aware, that past performance is not a reliable indicator of future performance and/or results. Past Performance or Forward-looking scenarios based upon the reasonable beliefs of the third-party provider are not a guarantee of future performance. Actual results may differ materially from those anticipated in forward-looking or past performance statements. IC Markets makes no representation or warranty and assumes no liability as to the accuracy or completeness of the information provided, nor any loss arising from any investment based on a recommendation, forecast or any information supplied by any third-party.

Potential bearish drop off?USD/JPY has rejected off the pivot which is an overlap resistance and oculd drop to the 1st support.
Pivot: 151.14
1st Suport: 148.79
1st Resistance: 153.11
Disclaimer:
The above opinions given constitute general market commentary, and do not constitute the opinion or advice of IC Markets or any form of personal or investment advice.
Any opinions, news, research, analyses, prices, other information, or links to third-party sites contained on this website are provided on an "as-is" basis, are intended only to be informative, is not an advice nor a recommendation, nor research, or a record of our trading prices, or an offer of, or solicitation for a transaction in any financial instrument and thus should not be treated as such. The information provided does not involve any specific investment objectives, financial situation and needs of any specific person who may receive it. Please be aware, that past performance is not a reliable indicator of future performance and/or results. Past Performance or Forward-looking scenarios based upon the reasonable beliefs of the third-party provider are not a guarantee of future performance. Actual results may differ materially from those anticipated in forward-looking or past performance statements. IC Markets makes no representation or warranty and assumes no liability as to the accuracy or completeness of the information provided, nor any loss arising from any investment based on a recommendation, forecast or any information supplied by any third-party.

Bearish drop?AUD/CAD has rejected off the pivot, which is a pullback resistance and could drop to the 1st support, which aligns with the 78.6% Fibonacci projection.
Pivot: 0.91529
1st Support: 0.90179
1st Resistance: 0.92279
Disclaimer:
The above opinions given constitute general market commentary, and do not constitute the opinion or advice of IC Markets or any form of personal or investment advice.
Any opinions, news, research, analyses, prices, other information, or links to third-party sites contained on this website are provided on an "as-is" basis, are intended only to be informative, is not an advice nor a recommendation, nor research, or a record of our trading prices, or an offer of, or solicitation for a transaction in any financial instrument and thus should not be treated as such. The information provided does not involve any specific investment objectives, financial situation and needs of any specific person who may receive it. Please be aware, that past performance is not a reliable indicator of future performance and/or results. Past Performance or Forward-looking scenarios based upon the reasonable beliefs of the third-party provider are not a guarantee of future performance. Actual results may differ materially from those anticipated in forward-looking or past performance statements. IC Markets makes no representation or warranty and assumes no liability as to the accuracy or completeness of the information provided, nor any loss arising from any investment based on a recommendation, forecast or any information supplied by any third-party.

Bullish reversal off major support?NZD/JPY is falling towards the pivot, which is a multi-swing low support level and could bounce to the pullback resistance.
Pivot: 85.65
1st Support: 84.74
1st Resistance: 86.43
Disclaimer:
The above opinions given constitute general market commentary, and do not constitute the opinion or advice of IC Markets or any form of personal or investment advice.
Any opinions, news, research, analyses, prices, other information, or links to third-party sites contained on this website are provided on an "as-is" basis, are intended only to be informative, is not an advice nor a recommendation, nor research, or a record of our trading prices, or an offer of, or solicitation for a transaction in any financial instrument and thus should not be treated as such. The information provided does not involve any specific investment objectives, financial situation and needs of any specific person who may receive it. Please be aware, that past performance is not a reliable indicator of future performance and/or results. Past Performance or Forward-looking scenarios based upon the reasonable beliefs of the third-party provider are not a guarantee of future performance. Actual results may differ materially from those anticipated in forward-looking or past performance statements. IC Markets makes no representation or warranty and assumes no liability as to the accuracy or completeness of the information provided, nor any loss arising from any investment based on a recommendation, forecast or any information supplied by any third-party.

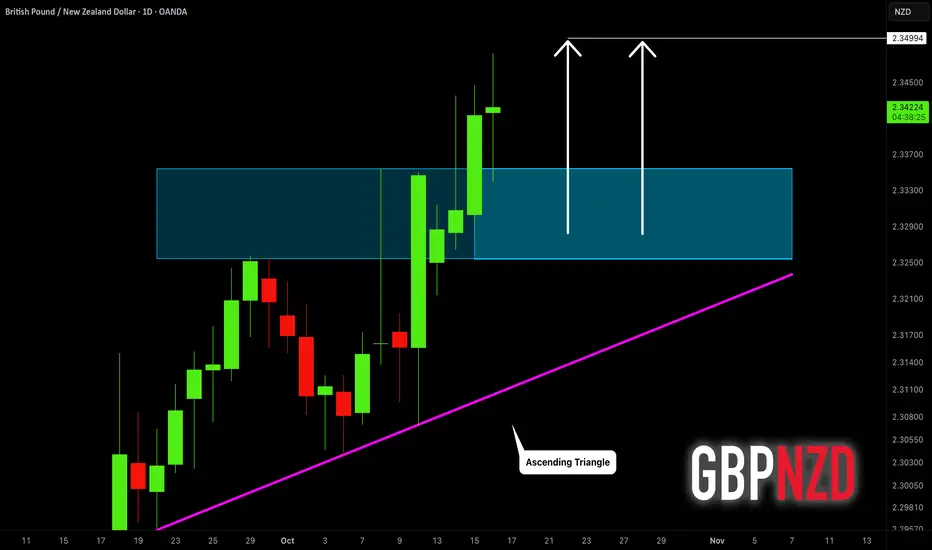
GBPNZD: Bull Run Continues 🇬🇧🇳🇿
GBPNZD will likely grow more following a confirmed
breakout of a resistance of an ascending triangle pattern on a daily.
Next resistance is 2.35
❤️Please, support my work with like, thank you!❤️
EUR/USD | EURUSD Breakdown Alert: Could It Drop Toward 1.1565?By analyzing the EUR/USD chart on the 2-hour timeframe, we can see that the price is currently trading around 1.162 .
If it manages to hold below the 1.164 level, we could expect further downside movement from the Euro.
The next potential bearish targets are 1.160, 1.158, and 1.1565 .
Please support me with your likes and comments to motivate me to share more analysis with you and share your opinion about the possible trend of this chart with me !
Best Regards , Arman Shaban

GBPUSD Shooting Star Near Resistance Lines – Short Opportunity?Today, I want to share a potential Short opportunity on the GBPUSD ( FX:GBPUSD ) pair.
GBPUSD , as I expected in my previous idea , reached its target .
At the moment, GBPUSD has broken through a Support zone($1.340-$1.333) , but overall it is still moving within a Heavy Support zone($1.343-$1.313) and is near Resistance lines .
From a candlestick pattern perspective , it looks like GBPUSD is forming a Shooting Star near these Resistance lines .( To confirm the Shooting Star pattern, we need to wait until the end of the last 4-hour candle)
In terms of Elliott Wave theory , it seems that GBPUSD has completed wave 4 , and we should be looking for the start of wave 5 soon .
I expect GBPUSD in the coming hours to at least retest the 200_EMA(Daily) . If that breaks, the next target would be the Support lines , and if those support lines break, we could even see a move down to the Heavy Support zone($1.343-$1.313) .
Stop Loss(SL): 1.3412 USD
Please respect each other's ideas and express them politely if you agree or disagree.
British Pound / U.S Dollar Analysis (GBPUSD), 4-hour time frame.
Be sure to follow the updated ideas.
Do not forget to put a Stop loss for your positions (For every position you want to open).
Please follow your strategy and updates; this is just my Idea, and I will gladly see your ideas in this post.
Please do not forget the ✅' like '✅ button 🙏😊 & Share it with your friends; thanks, and Trade safe.

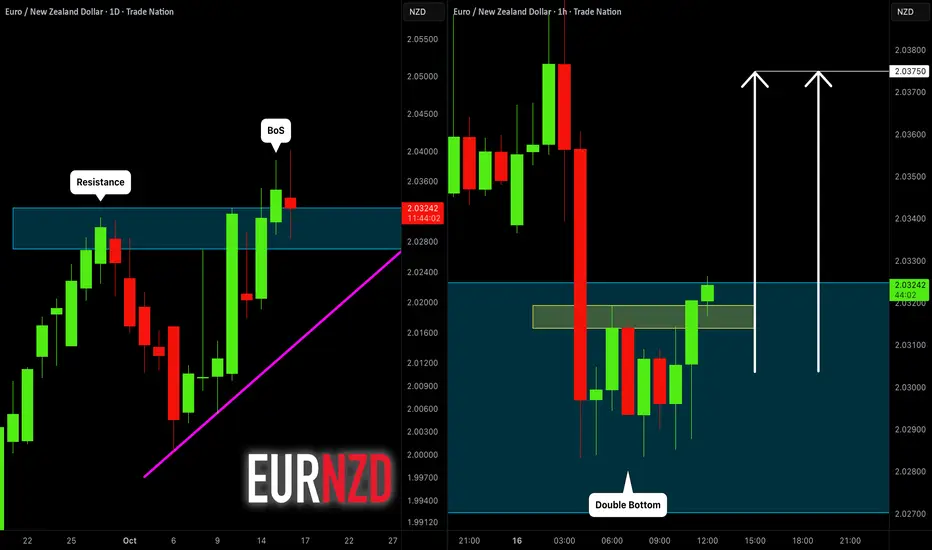
EURNZD: Intraday Confirmation?! 🇪🇺🇳🇿
A quick follow-up for EURNZD.
I see some intraday bullish confirmation on an hourly time frame
after a retest of a broken structure.
A double bottom pattern on that provides a strong bullish clue.
I expect a rise now at least to 2.0375
❤️Please, support my work with like, thank you!❤️
I am part of Trade Nation's Influencer program and receive a monthly fee for using their TradingView charts in my analysis.
GBP/CAD 382 MA Retest – A Clean Setup for Swing Buyers!🎯 GBP/CAD: The Great British Heist Setup!💰
📊 Asset Overview
GBP/CAD (British Pound Sterling vs Canadian Dollar)
Market: Forex
Trade Type: Swing/Day Trade
Style: The Thief Method 🦹♂️💼
🔍 Market Analysis
The Setup: Bullish Confirmation Play
We're eyeing a bullish confirmation with a clean retest pullback at the 382 Moving Average inside a triangular pattern formation. The Sterling is showing strength against the Loonie, and this pullback to the 382 MA could be your golden ticket for entry! 🎫✨
🎯 Trading Plan
📍 Entry Strategy
You've got two paths to infiltrate this trade:
Option 1: Market Execution 💨
Enter at current price levels when price retests and bounces off the 382 Moving Average
Option 2: The Thief Layering Strategy 🎯
Multiple limit orders stacked like a pro heist team:
Layer 1: 1.87500
Layer 2: 1.87800
Layer 3: 1.88000
Layer 4: 1.88300
Pro Tip: You can add more layers based on your risk appetite and account size! The more layers, the better your average entry becomes. 🧠💡
🛡️ Risk Management
Stop Loss: 1.87000 🚨
This is the Thief's recommended escape hatch. However, this is NOT financial advice — adjust your stop loss based on YOUR risk tolerance and trading plan. You're the boss of your own money! 👑💰
🎯 Profit Targets
Target: 1.90000 🏁
This level acts as a police barricade 🚔 — expect strong resistance here! Multiple confluences:
Historical resistance zone
Potential overbought conditions
Classic trap territory for late entries
Exit Strategy: Take profits in stages! Don't be greedy. Lock in gains and let the rest ride if momentum continues.
⚠️ Reminder: This is MY target level, but YOU control YOUR exits. Take profits when YOU'RE comfortable. Risk management is KING! 👑
🔗 Related Pairs to Watch
Keep your eyes on these correlated markets for confirmation:
💵 OANDA:USDCAD — The Loonie's behavior against the Dollar can signal CAD strength/weakness
💷 FX:GBPUSD (Cable) — Pound strength indicator across the board
🛢️ Crude Oil ( BLACKBULL:WTI / BLACKBULL:BRENT ) — Canadian Dollar is oil-sensitive; rising oil = stronger CAD
💰 OANDA:XAUUSD (Gold) — Risk-on/risk-off sentiment gauge
Key Correlation Point: If USD/CAD is falling while GBP/USD is rising, that's your double confirmation that GBP/CAD should climb! 📈🔥
⚙️ Technical Confluences
✅ Price retesting the 382 Moving Average as dynamic support
✅ Triangular pattern formation suggesting consolidation before breakout
✅ Bullish market structure intact
✅ Higher lows pattern forming
✅ Volume supporting the upside move
🎭 The Thief's Final Words
This setup combines technical precision with strategic layering — the hallmark of the Thief method! The 382 MA has been a reliable dynamic support level, and this retest presents a high-probability entry zone. Whether you're a swing trader looking for multi-day moves or a day trader scalping intraday momentum, this plan adapts to YOUR style.
Remember: Markets don't care about your feelings. Stick to the plan, manage your risk, and let probability work in your favor! 🎲📊
📢 Community Love
✨ If you find value in my analysis, a 👍 and 🚀 boost is much appreciated — it helps me share more setups with the community!
#GBPCAD #ForexTrading #SwingTrading #DayTrading #TheThiefMethod #ForexSignals #TechnicalAnalysis #MovingAverage #PriceAction #ForexCommunity #TradingView #ForexStrategy #RiskManagement #BullishSetup #ForexAnalysis #GBP #CAD #CurrencyTrading #ForexEducation #TradingIdeas

Gold Plan | Where will gold drop today?🔍 Market Context
Gold continues to maintain a short-term upward trend following a series of Break of Structure (BoS) , confirming active buying from lower zones.
Currently, the price is approaching the ATH GOLD zone and heading towards the Liquidity Sell Zone 4,281 USD – a densely liquid area where short-term sell reactions from major players may occur.
After a hot rise, technical correction risks are starting to increase. Lower zones like 4,186 – 4,152 – 4,130 USD will be potential “accumulation zones” for institutional buyers in the upcoming pullback.
💎 Technical Analysis
ATH GOLD: 4,275 – 4,280 USD
Liquidity Sell Zone: 4,281 – 4,285 USD → high liquidity resistance area, may trigger short-term reversal reactions.
Liquidity Zone $$$: 4,186 – 4,152 USD → crucial support area in the uptrend, where technical reactions are expected.
FVG – BoS Zone: 4,152 – 4,148 USD → “price balance” zone yet to be filled, likely to be retested.
OB Deep Zone: 4,130 – 4,120 USD → deep demand zone converging with Fibo 0.786 – ideal area for large capital to re-accumulate.
Overall structure remains bullish , but in the premium zone – an area where institutions typically distribute orders to gain liquidity before adjusting.
📈 Trading Scenarios
1️⃣ Main Scenario – Sell reaction at Liquidity Zone 4,281 USD
When the price hits the 4,275 – 4,281 USD zone and clear reversal signals appear (rejection candles, bearish engulfing, or minor structure break),
→ open short-term sell orders (scalp/intraday).
Target: 4,186 → 4,152 USD.
Stop Loss: above 4,285 USD.
➡️ This is a typical “liquidity sweep – technical reaction” scenario, capitalising on short-term sell-offs at high liquidity peaks.
2️⃣ Secondary Scenario – Buy back following the main trend after correction
When the price corrects to the 4,186 – 4,152 USD zone or deeper to OB Deep 4,130 USD ,
and clear upward confirmation signals appear (strong rejection or minor BoS increasing again),
→ open buy orders in line with the main trend.
Target: 4,230 → 4,275 USD.
Stop Loss: below 4,120 USD.
➡️ Trend-following scenario – waiting for price correction to discount zones to accumulate in line with the larger trend.
⚠️ Risk Management
Do not FOMO buy when the price is hitting the 4,275 – 4,281 USD zone.
Prioritise short-term sells with clear confirmations or buys at lower OB zones.
Keep light volume when trading against the main trend.
Observe reactions at the 4,186 zone – this is the key level of the day.
💬 Conclusion
Gold is at the peak of the current rise , short-term profit-taking pressure may appear around the 4,281 USD zone.
If strong reactions occur, a correction to the 4,186 – 4,152 USD zone is reasonable for market rebalancing.
The larger trend remains upward , so lower OB zones will be reasonable buy opportunities for the next wave.
👉 Reasonable Strategy:
Sell reaction at 4,281 USD when reversal signals appear.
Buy back at 4,186 – 4,152 – 4,130 USD when confirmation signals appear.

Hellena | EUR/USD (4H): LONG to the resistance area 1.16827.Colleagues, the recent continuation of the downtrend has made me reevaluate my wave analysis a bit.
If everything is correct, we are now witnessing a correction - triangle (ABCDE).
In this case, wave “C” should not update the minimum of wave “A”. This means that I expect the upward movement to start either from the current values or after the correction is completed around 1.14876.
Then I expect the beginning of the upward movement at least to the resistance area of 1.16827 - the middle line of the triangle.
Fundamental context
The U.S. dollar is showing signs of weakness — recent labor data came out softer than expected, and markets continue to price in further Fed rate cuts. This reduces demand for the dollar as a safe-haven asset.
At the same time, the ECB is likely to keep its current policy unchanged, as there’s limited room for additional easing. That gives the euro a slight fundamental advantage.
Manage your capital correctly and competently! Only enter trades based on reliable patterns!

EUR/USD: Bearish Pullback to 1.156?FX:EURUSD is flashing bearish signals on the 4-hour chart , where price is testing a downward trendline with successive lower highs, signaling continued weakness in the pair. The good entry point aligns near the EMA 200 (acting as dynamic resistance) and a key resistance zone, setting up for a potential downside continuation if sellers step in. 🎯
Entry zone between 1.167-1.169 for a short position. Target at 1.156 near the support zone for solid risk-reward. 📊 Set a stop loss on a close above 1.1725 to protect against upside breaks. 🌟 Look for confirmation on a break below the entry with increasing volume, amid ongoing USD strength against the EUR.
On the fundamental front , today—Wednesday, October 15, 2025,today's Eurozone Industrial Production data stands out as a key event for EUR, while speeches from several Federal Reserve members could influence USD movements. 💡
📝 Trade Plan:
✅ Entry Zone: 1.167 – 1.169 (short setup near resistance & EMA 200)
❌ Stop Loss: Close above 1.1725
🎯 Target: 1.156 (major support & take-profit zone)
What's your outlook on this setup? Drop your thoughts below! 👇

EUR/USD bullish setupEUR/USD is forming a bullish setup. Price is expected to retrace to the demand zone near 1.1650–1.1660 before moving upward toward the target zone at 1.1712–1.1743. Stop loss is set below 1.1609.

AUD/CAD: Bearish Drop to 0.9097?As the previous analysis worked exactly as predicted, FX:AUDCAD is signaling a bearish continuation on the 1-hour chart , with price testing a downward trendline and forming lower highs, indicating sustained selling pressure. The entry zone sits near the resistance zone , aligning with the trendline for a high-probability short setup if sellers maintain control.
Entry between 0.9182-0.9200 for a sell position. Targets at 0.9116 (first) and 0.9097 (second) near the support zone for a solid risk-reward ratio. Set a stop loss on a close above 0.922 to protect against an unexpected reversal. Look for confirmation with a break below 0.9182 accompanied by increasing volume, driven by the prevailing bearish momentum.
Fundamentally , tomorrow—Thursday, October 16, 2025—we have the Australian Unemployment Rate report, which could trigger volatility in AUD. Additionally, the Bank of Canada Governor’s participation in a friendly session in Washington tomorrow may influence CAD movements, adding another layer of uncertainty to the pair. 💡
📝 Trade Plan:
✅ Entry Zone: 0.9182 – 0.9200 (short setup near resistance & trendline)
❌ Stop Loss: Close above 0.9220
🎯 Targets:
TP1: 0.9116 (initial support)
TP2: 0.9097 (extended downside target)
What’s your take on this setup? Share below! 👇

KIWI H1 | otential Bearish Reversal off Major Resistance LevelBased on the H1 chart analysis, we could see the price rise to the sell entry, which is an overlap resistance that is slightly below the 50% Fibonacci retracement and could reverse from this level to the take profit.
Sell entry is at 0.5738, which is an overlap resistance that is slightly below the 50% Fibonacci retracement.
Stop loss is at 0.5768, which is a pullback resistance.
Take profit is at 0.5684, which is a pullback support.
High Risk Investment Warning
Trading Forex/CFDs on margin carries a high level of risk and may not be suitable for all investors. Leverage can work against you.
Stratos Markets Limited (tradu.com ):
CFDs are complex instruments and come with a high risk of losing money rapidly due to leverage. 65% of retail investor accounts lose money when trading CFDs with this provider. You should consider whether you understand how CFDs work and whether you can afford to take the high risk of losing your money.
Stratos Europe Ltd (tradu.com ):
CFDs are complex instruments and come with a high risk of losing money rapidly due to leverage. 66% of retail investor accounts lose money when trading CFDs with this provider. You should consider whether you understand how CFDs work and whether you can afford to take the high risk of losing your money.
Stratos Global LLC (tradu.com ):
Losses can exceed deposits.
Please be advised that the information presented on TradingView is provided to Tradu (‘Company’, ‘we’) by a third-party provider (‘TFA Global Pte Ltd’). Please be reminded that you are solely responsible for the trading decisions on your account. There is a very high degree of risk involved in trading. Any information and/or content is intended entirely for research, educational and informational purposes only and does not constitute investment or consultation advice or investment strategy. The information is not tailored to the investment needs of any specific person and therefore does not involve a consideration of any of the investment objectives, financial situation or needs of any viewer that may receive it. Kindly also note that past performance is not a reliable indicator of future results. Actual results may differ materially from those anticipated in forward-looking or past performance statements. We assume no liability as to the accuracy or completeness of any of the information and/or content provided herein and the Company cannot be held responsible for any omission, mistake nor for any loss or damage including without limitation to any loss of profit which may arise from reliance on any information supplied by TFA Global Pte Ltd.
The speaker(s) is neither an employee, agent nor representative of Tradu and is therefore acting independently. The opinions given are their own, constitute general market commentary, and do not constitute the opinion or advice of Tradu or any form of personal or investment advice. Tradu neither endorses nor guarantees offerings of third-party speakers, nor is Tradu responsible for the content, veracity or opinions of third-party speakers, presenters or participants.

GBPJPY H4 | Sharp Bearish ReversalGBP/JPY is reacting off the sell entry, whichis a pullback resistance that lines up with the 23.6% Fibonacci retracement and could drop from this level to veto the downside.
Sell entry is at 202.51, which is a pullback resistance that aligns with the 23.6% Fibonacci retracement
Stop loss is at 204.01, which is a pullback resistance that lines up with he 61.8% Fibonacci retracement.
Take profit is at 200.41, whichis a pullback support that aligns with the 61.8% Fibonacci retracement.
High Risk Investment Warning
Trading Forex/CFDs on margin carries a high level of risk and may not be suitable for all investors. Leverage can work against you.
Stratos Markets Limited (tradu.com ):
CFDs are complex instruments and come with a high risk of losing money rapidly due to leverage. 65% of retail investor accounts lose money when trading CFDs with this provider. You should consider whether you understand how CFDs work and whether you can afford to take the high risk of losing your money.
Stratos Europe Ltd (tradu.com ):
CFDs are complex instruments and come with a high risk of losing money rapidly due to leverage. 66% of retail investor accounts lose money when trading CFDs with this provider. You should consider whether you understand how CFDs work and whether you can afford to take the high risk of losing your money.
Stratos Global LLC (tradu.com ):
Losses can exceed deposits.
Please be advised that the information presented on TradingView is provided to Tradu (‘Company’, ‘we’) by a third-party provider (‘TFA Global Pte Ltd’). Please be reminded that you are solely responsible for the trading decisions on your account. There is a very high degree of risk involved in trading. Any information and/or content is intended entirely for research, educational and informational purposes only and does not constitute investment or consultation advice or investment strategy. The information is not tailored to the investment needs of any specific person and therefore does not involve a consideration of any of the investment objectives, financial situation or needs of any viewer that may receive it. Kindly also note that past performance is not a reliable indicator of future results. Actual results may differ materially from those anticipated in forward-looking or past performance statements. We assume no liability as to the accuracy or completeness of any of the information and/or content provided herein and the Company cannot be held responsible for any omission, mistake nor for any loss or damage including without limitation to any loss of profit which may arise from reliance on any information supplied by TFA Global Pte Ltd.
The speaker(s) is neither an employee, agent nor representative of Tradu and is therefore acting independently. The opinions given are their own, constitute general market commentary, and do not constitute the opinion or advice of Tradu or any form of personal or investment advice. Tradu neither endorses nor guarantees offerings of third-party speakers, nor is Tradu responsible for the content, veracity or opinions of third-party speakers, presenters or participants.

Bearish drop off in play?USD/JPY has rejected off the pivot which is an overlap resistance that aligns with the 50% Fibonacci retracement and could drop to the 1st support.
Pivot: 151.60
1st Support: 149.90
1st Resistance: 152.43
Disclaimer:
The above opinions given constitute general market commentary, and do not constitute the opinion or advice of IC Markets or any form of personal or investment advice.
Any opinions, news, research, analyses, prices, other information, or links to third-party sites contained on this website are provided on an "as-is" basis, are intended only to be informative, is not an advice nor a recommendation, nor research, or a record of our trading prices, or an offer of, or solicitation for a transaction in any financial instrument and thus should not be treated as such. The information provided does not involve any specific investment objectives, financial situation and needs of any specific person who may receive it. Please be aware, that past performance is not a reliable indicator of future performance and/or results. Past Performance or Forward-looking scenarios based upon the reasonable beliefs of the third-party provider are not a guarantee of future performance. Actual results may differ materially from those anticipated in forward-looking or past performance statements. IC Markets makes no representation or warranty and assumes no liability as to the accuracy or completeness of the information provided, nor any loss arising from any investment based on a recommendation, forecast or any information supplied by any third-party.

Bullish reversal off multi swing low support?The Swissie (USD/CHF) is falling towards the pivot, which acts as a multi swing low support and oculd bounce to the 1st resistance, which is acts as an overlap resistance.
Pivot: 0.7947
1st Support: 0.7930
1st Resistance: 0.7991
Disclaimer:
The above opinions given constitute general market commentary, and do not constitute the opinion or advice of IC Markets or any form of personal or investment advice.
Any opinions, news, research, analyses, prices, other information, or links to third-party sites contained on this website are provided on an "as-is" basis, are intended only to be informative, is not an advice nor a recommendation, nor research, or a record of our trading prices, or an offer of, or solicitation for a transaction in any financial instrument and thus should not be treated as such. The information provided does not involve any specific investment objectives, financial situation and needs of any specific person who may receive it. Please be aware, that past performance is not a reliable indicator of future performance and/or results. Past Performance or Forward-looking scenarios based upon the reasonable beliefs of the third-party provider are not a guarantee of future performance. Actual results may differ materially from those anticipated in forward-looking or past performance statements. IC Markets makes no representation or warranty and assumes no liability as to the accuracy or completeness of the information provided, nor any loss arising from any investment based on a recommendation, forecast or any information supplied by any third-party.

Bearish reversal off pullback resistance?Kiwi (NZD/USD) is reacting off the pivot, which acts as a pullback resistance and oculd drop to the pullback support.
Pivot: 0.5734
1st Support: 0.5686
1st Resistance: 0.5758
Disclaimer:
The above opinions given constitute general market commentary, and do not constitute the opinion or advice of IC Markets or any form of personal or investment advice.
Any opinions, news, research, analyses, prices, other information, or links to third-party sites contained on this website are provided on an "as-is" basis, are intended only to be informative, is not an advice nor a recommendation, nor research, or a record of our trading prices, or an offer of, or solicitation for a transaction in any financial instrument and thus should not be treated as such. The information provided does not involve any specific investment objectives, financial situation and needs of any specific person who may receive it. Please be aware, that past performance is not a reliable indicator of future performance and/or results. Past Performance or Forward-looking scenarios based upon the reasonable beliefs of the third-party provider are not a guarantee of future performance. Actual results may differ materially from those anticipated in forward-looking or past performance statements. IC Markets makes no representation or warranty and assumes no liability as to the accuracy or completeness of the information provided, nor any loss arising from any investment based on a recommendation, forecast or any information supplied by any third-party.

Bullish bounce off?Aussie (AUD/USD) has bounced off the pivot which aligns with the 38.2% Fibonacci retracement and could rise to the 1st resistance that aligns with rhe 61.8% Fibonacci retracement.
Pivot: 0.6495
1st Support: 0.6469
1st Resistance: 0.6469
Disclaimer:
The above opinions given constitute general market commentary, and do not constitute the opinion or advice of IC Markets or any form of personal or investment advice.
Any opinions, news, research, analyses, prices, other information, or links to third-party sites contained on this website are provided on an "as-is" basis, are intended only to be informative, is not an advice nor a recommendation, nor research, or a record of our trading prices, or an offer of, or solicitation for a transaction in any financial instrument and thus should not be treated as such. The information provided does not involve any specific investment objectives, financial situation and needs of any specific person who may receive it. Please be aware, that past performance is not a reliable indicator of future performance and/or results. Past Performance or Forward-looking scenarios based upon the reasonable beliefs of the third-party provider are not a guarantee of future performance. Actual results may differ materially from those anticipated in forward-looking or past performance statements. IC Markets makes no representation or warranty and assumes no liability as to the accuracy or completeness of the information provided, nor any loss arising from any investment based on a recommendation, forecast or any information supplied by any third-party.

Bullish momentum to extend?Cable (GBP/USD) has bounced off the pivot and could rise to the multi swing high resistance.
Pivot: 1.3354
1st Support: 1.3312
1st Resistance: 1.3486
Disclaimer:
The above opinions given constitute general market commentary, and do not constitute the opinion or advice of IC Markets or any form of personal or investment advice.
Any opinions, news, research, analyses, prices, other information, or links to third-party sites contained on this website are provided on an "as-is" basis, are intended only to be informative, is not an advice nor a recommendation, nor research, or a record of our trading prices, or an offer of, or solicitation for a transaction in any financial instrument and thus should not be treated as such. The information provided does not involve any specific investment objectives, financial situation and needs of any specific person who may receive it. Please be aware, that past performance is not a reliable indicator of future performance and/or results. Past Performance or Forward-looking scenarios based upon the reasonable beliefs of the third-party provider are not a guarantee of future performance. Actual results may differ materially from those anticipated in forward-looking or past performance statements. IC Markets makes no representation or warranty and assumes no liability as to the accuracy or completeness of the information provided, nor any loss arising from any investment based on a recommendation, forecast or any information supplied by any third-party.
