Pipping the Aussie-Swiss Bank: Day Trading Strategy UnleashedUltimate AUD/CHF Forex Heist Plan 🚨 Swing Trade Mastery for Epic Gains! 🚀
Greetings, Wealth Warriors & Market Mavericks! 👋💸
Get ready to execute a legendary heist on the AUD/CHF "Aussie vs Swissy" Forex market with our exclusive Thief Trading Style! 🎯 This meticulously crafted strategy blends technical precision and fundamental firepower to maximize your profits. Follow the plan outlined in the chart, focusing on a long entry to conquer the high-risk Yellow MA Zone—a battleground of overbought conditions, consolidation, and potential trend reversals where bearish bandits lurk. 🐻 Stay sharp, lock in profits, and trade safely! 💪🎉
Entry 📈: The heist begins! Watch for the MA pullback in the market maker’s trap zone (0.52200 OR above) to strike. Bullish riches await! Set buy stop orders above the Moving Average or place buy limit orders within the 15 or 30-minute timeframe’s recent swing low/high.
Pro tip: Set an alert to catch the breakout entry in action! 🔔
Stop Loss 🛑: Place your Thief SL at the recent swing low/high on the 4H timeframe for swing trades basis. Adjust SL based on your risk tolerance, lot size, and multiple orders.
Target 🎯: Aim for 0.54800 or make a swift exit before the target to secure your loot!
🧲 Scalpers, listen up! 👀 Stick to long-side scalps. Big players can jump in now; others, join the swing trade heist. Use a trailing SL to protect your stash. 💰
💵 AUD/CHF "Aussie vs Swissy" Forex Heist Plan (Swing Trade) is riding a bullish wave 🐂, fueled by critical market drivers. Dive into the fundamentals—Macro Economics, COT Reports, Quantitative Analysis, Intermarket Analysis, Sentiment Outlook, and Future Trends—before launching your heist. Check the linkKs for the full scoop! 🔗👉
📌 Markets move fast, so stay vigilant and adapt your analysis to the latest developments.
⚠️ Trading Alert: News & Position Management 📰🚨
News releases can shake up prices and volatility. Protect your positions by:
Avoiding new trades during news events
Using trailing stop-loss orders to lock in gains
💖 Boost our heist plan! 💥 Hit the Boost Button to supercharge our team’s strength and make stealing profits a breeze. With the Thief Trading Style, you’ll conquer the market daily with ease! 🏆🤝🎉
Stay tuned for the next epic heist plan, Money Makers! 🤑🐱👤🚀
Forexsignalservice

USDJPY Analysis – Yield Support Signals Potential UpsideUSDJPY is currently sitting at a key support zone around 142.80–143.00, showing signs of a potential bullish reversal. This support area has previously acted as a strong launchpad for price rallies.
🟢 Technical Setup:
Price action has formed a clean higher low structure, bouncing off horizontal support.
The US10Y Treasury Yield (pink line) has rebounded sharply and is diverging to the upside — a leading indicator for USDJPY strength.
The Fib retracement from the last swing move aligns well with the 0% zone, suggesting the dip might be complete.
A bullish reaction from here targets the 148.50 zone, with intermediate resistance around 145.00–146.00.
🟠 Risk Levels:
Invalidated below 141.40 (structure break).
Stops could be placed below 142.00, targeting a 2:1 or better risk-reward ratio.
🔍 Macro-Fundamental Insight:
U.S. Yields are firming despite mixed Fed signals — this gives strength to USD, especially against low-yielders like the JPY.
BOJ remains dovish with no urgency to normalize rates, keeping the yen weak.
With risk appetite improving and bond yields lifting, carry trade dynamics favor USDJPY upside.
✅ Conclusion:
As long as US10Y yields remain firm and USD holds above 142.00, USDJPY has a strong probability of rallying toward 148.50. Look for confirmation with higher highs on the 4H chart and continued divergence between yield and price.

AUD/JPY “Aussie vs. Yen” Skyrocketing Safari!🌈 G’day, Forex Adventurers & PIP Hunters! 🌏✨
Join our epic AUD/JPY Forex expedition! 🦘🚀 Our Stellar Navigator Strategy fuses pinpoint technicals with powerful fundamentals to chase profits in the Aussie-Yen jungle. Ready to soar to new heights and grab those pips? Let’s embark on this bullish quest! 🌍💰
🌟 The Stellar Navigator Plan
Entry Points 🛫:
🦅 Bullish Launch: Jump in after a breakout above the Sky High at 94.800—your cue for bullish gains!
🐾 Pullback Path: Place buy limit orders near the 15M/30M support (94.200) for a savvy entry.
Pro Tip: Set alerts to spot the breakout spark! 🔔
Stop Loss (SL) 🛡️:
Bullish Trade: Secure SL at the 2H support (93.600) for day trades.
Tailor SL to your risk, lot size, and order count. This is your safety net—keep it snug! ⚠️
Take Profit (TP) 🎯:
Bullish Explorers: Aim for the Star Peak at 96.500 or exit if the momentum dips.
Scalpers: Grab quick pips on the long side, but lock in gains with trailing stops! 🚨
🌏 Why AUD/JPY?
The Aussie’s soaring 📈 as of May 12, 2025, powered by:
Fundamentals: RBA’s 4.35% rate dwarfs BoJ’s 0.1%, boosting AUD.
Macroeconomics: Australia’s commodity boom (gold, iron ore) outpaces Japan’s slow recovery.
COT Data (May 9, 2025): Rising AUD net longs signal bullish sentiment (source: CFTC).
Intermarket: AUD/JPY tracks Nikkei 225’s risk-on rally.
Quantitative: RSI (14) at 59 and a break above the 50-day SMA (93.57) confirm upward momentum.
📊 Sentiment Snapshot (May 12, 2025, UTC+1)
Retail Traders:
🟢 Bullish: 53% 😊 (RBA strength, China trade optimism)
🔴 Bearish: 37% 😣 (Yen safe-haven demand on tariff risks)
⚪ Neutral: 10% 🤔
Institutional Traders:
🟢 Bullish: 46% 💼 (Commodity demand, risk-on flows)
🔴 Bearish: 39% ⚠️ (BoJ intervention fears, US yields)
⚪ Neutral: 15% 🧐
📰 Market Buzz (May 12, 2025)
- US-China trade progress lifts risk appetite, pushing AUD/JPY to 94.50.
- Easing tariff concerns weaken JPY safe-haven appeal.
- Japan’s soft consumer spending data pressures JPY.
📡 Risk Navigation ⚡
Markets can be wild—tread carefully:
- Avoid new trades during major news (RBA, BoJ, US CPI).
- Use trailing stops to protect profits and cap losses.
- Watch for BoJ moves if JPY weakens sharply! 🌪️
💸 Real-Time Market Data (May 12, 2025, UTC+1)
- Forex: AUD/JPY at 94.50, up 0.5% daily (source: Financial Juice).
- Commodities CFD: Gold (XAU/USD) at 2,650, up 0.2%; Iron Ore at 105.50, flat.
- Metals: Silver (XAG/USD) at 31.820, down 1.3%.
- Energies: WTI Crude Oil at 78.40, up 0.6%.
- Crypto: BTC/USD at 62,300, down 0.5%.
- Indices: Nikkei 225 at 39,200, up 0.7%; ASX 200 at 7,850, up 0.4%.
🚀 Join the Stellar Navigator Squad!
Smash the Boost Button to supercharge our Stellar Navigator Strategy and make this safari epic! 🌟 Every boost empowers our crew to dominate the markets. Let’s conquer AUD/JPY together! 🤝
Stay glued to your charts, keep alerts active, and vibe high. See you in the profits, adventurers! 🤑🎉
#StellarNavigator #AUDJPY #AussieYen #TradingView #ChaseThePips

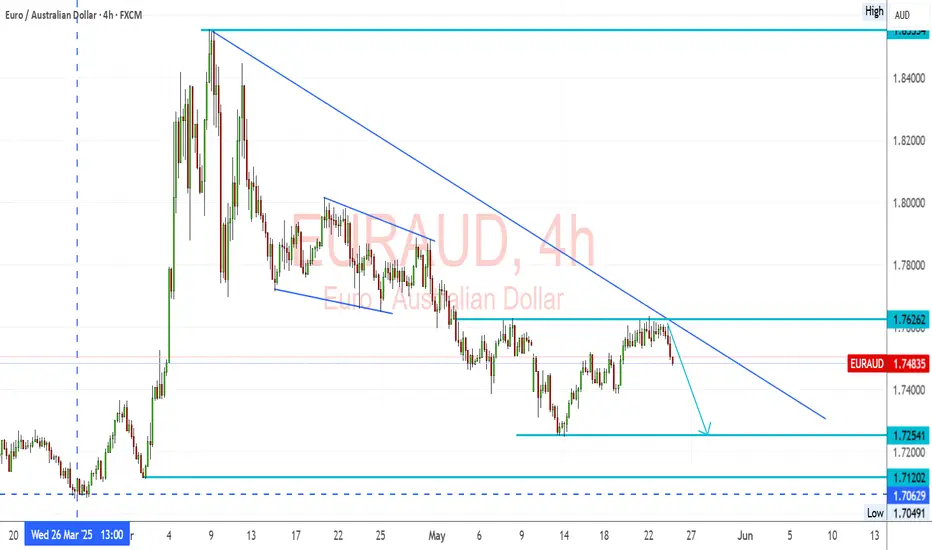
EURAUD – Trendline Holds, Bearish Setup Below 1.7626EURAUD Trend: EURAUD pair remains in a strong downtrend, marked by consistent lower highs and a descending trendline.
Resistance: 1.7626 has been retested and rejected, confirming it as a short-term ceiling.
Structure: The latest rejection from both horizontal resistance and the trendline confirms bearish intent.
🔽 Bearish Targets:
1.7254 – minor support and near-term target
1.7120 – stronger support zone
1.7060 – previous low and potential extended target
A clear break below 1.7400 could confirm continuation of the trend toward those levels.
Fundamental Overview:
🔻 EUR Weakness:
The Eurozone is slowing, particularly in Germany and France.
ECB remains cautious; recent comments show concern about tight financial conditions and sticky inflation.
Political uncertainties and mixed data prints are adding pressure.
🟢 AUD Support:
The RBA remains firm with hawkish language, holding rates while global peers lean dovish.
Commodities remain stable, and Australia benefits from demand out of Asia.
Domestic data (jobs and retail) shows surprising resilience.
Summary:
Bias: Bearish below 1.7626
Break Trigger: 1.7400
Target Range: 1.7250 – 1.7060
Fundamentals: Favor AUD on stronger economic footing and RBA policy tone
📉 EURAUD looks ready for another leg lower unless we see a breakout above 1.7630 with conviction.
Market next move Original Analysis Summary:
Price has entered a support area and is expected to bounce.
Two possible bullish paths (blue & yellow arrows) suggest a continuation toward the marked target zone.
---
Disruption Thesis: Bearish Reversal Setup
1. Overextended Rally Into Resistance
The move up into the “support area” is sharp and fast, suggesting it's a liquidity grab.
This zone might actually be a supply zone, where smart money is offloading.
Disruption Call: Price could stall or reverse sharply from this area due to lack of follow-through volume.
---
2. Volume Profile Weakness
Volume peaked earlier in the rally and is now diminishing, which often signals buyer exhaustion.
Disruption Call: Fading bullish momentum implies a fakeout, not a breakout.
---
3. False Breakout / Bull Trap
The green arrow assumes a bounce, but price may just be hovering to bait longs before dropping.
Previous swing highs near 1.1320 may act as a strong rejection point.
Disruption Call: A sudden drop below 1.1300, with a new bearish wave back to 1.1250 or lower.

"Dare to Swipe EUR/USD Gains with Our Risky Heist Blueprint?"Ultimate EUR/USD Heist Plan: Snag Profits with the Thief Trading Strategy! 🚀💰
🌍 Greetings, Wealth Raiders! Ciao, Hello, Bonjour, Hola! 🌟
Fellow profit hunters, get ready to crack the EUR/USD "The Fiber" Forex vault with our slick Thief Trading Strategy! 🤑💸 This plan blends razor-sharp technicals and fundamentals to loot the market. Follow the chart’s long-entry blueprint to strike at high-risk zones like the Red MA (short-term traders) or the Red Zone Resistance (long-term traders). It’s a wild ride—overbought conditions, consolidation, and potential trend reversals mean bears are lurking! 🐻 Stay sharp, grab your profits, and treat yourself—you’ve earned it! 🎉💪
📈 Entry: Storm the Vault!
The market’s ripe for a bullish grab! 💥 Place buy limit orders within the most recent 15 or 30-minute swing low/high levels. Set alerts on your chart to stay locked in. 🔔
🛑 Stop Loss: Guard Your Loot!
Set your Thief SL at the nearest swing low on the 4H timeframe for day/swing trades. Adjust based on your risk tolerance, lot size, and number of orders. Safety first! 🔒
🎯 Targets: Claim Your Prize!
🏴☠️ Short-Term Target: 1.14700
🏴☠️ Long-Term Target: 1.17000
👀 Scalpers, Listen Up!
Stick to long-side scalps. Got deep pockets? Jump in now! Otherwise, join swing traders for the heist. Use trailing stop-loss to lock in gains and protect your stash. 💰
🐂 Why EUR/USD is Hot!
The Fiber’s bullish surge is fueled by key fundamentals. Dive into Macro, COT Reports, Quantitative Analysis, Sentiment, Intermarket trends, and future targets via the linkss below for the full scoop. 👉🔗. Stay informed to stay ahead! 📰
⚠️ Trading Alert: News & Position Management
News releases can shake the market like a heist gone wrong! 🗞️ To protect your profits:
🚫 Avoid new trades during news events.
🛡️ Use trailing stops to secure running positions.
💥 Boost the Heist!
Hit the Boost Button to supercharge our Thief Trading Strategy! 💪 Every click strengthens our crew, making it easier to swipe profits daily. Join the squad, trade smart, and let’s make money rain! 🌧️💵

USDCAD Consolidation Within Bullish Flag – Targets 1.4130USDCAD is consolidating inside a descending flag structure following a strong impulsive rally earlier in May. The current pullback is orderly and corrective, indicating potential for continuation higher. If price breaks above 1.3960, this flag breakout could extend toward 1.4130 and possibly 1.4225. With CAD weakening on soft oil prices and USD regaining strength from yield-driven flows, the bias remains bullish while price stays above 1.3870.
🔍 Technical Analysis
Pattern: Bullish flag forming after a strong rally
Support Zone: 1.3870–1.3900 → base of flag
Resistance/Breakout Zone: 1.3960–1.3980 → upper flag line
Structure:
Higher lows holding firm
Fib confluence near 1.3933 (23.6% retracement)
Target Levels:
1.4130 – 50% fib level + previous structure resistance
1.4225 – 61.8% fib zone from March–April high
📈 Bias: Bullish continuation on breakout
🌍 Fundamental Context
🇺🇸 U.S. Dollar (USD)
Supported by:
Higher bond yields
Fed expected to hold rates higher for longer
Safe-haven inflows post-Moody’s downgrade fading
USD Index recovering broadly across majors
🇨🇦 Canadian Dollar (CAD)
Oil prices softening due to global demand concerns (China slowdown, US inventories)
BoC likely done hiking — no fresh bullish catalysts
CAD correlation with crude oil adds downside risk if energy markets weaken further
🎯 Trade Plan
Entry: Break and close above 1.3960
Stop Loss: Below 1.3870 (flag support zone)
Targets:
TP1: 1.4130 (structure resistance + fib level)
TP2: 1.4225 (swing high + golden ratio)
⚠️ Risk Factors to Watch
If USD sentiment shifts (e.g., dovish Fed speaker) → breakout may fail
Crude oil rebound would support CAD and cap USD/CAD upside
False breakouts common near 1.3960 — wait for confirmation (strong candle close)
🧭 Conclusion
USD/CAD remains in a bullish consolidation phase with a clear continuation setup. A break above 1.3960 would confirm a flag breakout targeting 1.4130 and 1.4225. With the macro backdrop favoring the USD and energy-linked CAD weakening, this setup offers clean structure and potential for follow-through.

AUD/NZD Forex Ambush: Thief Trading’s Profit-Grabbing Plan!🌟 AUD/NZD Forex Heist: Snag Profits with the Thief Trading Plan! 🚀💰
Hey there, wealth hunters and market bandits! 🤑💸
Welcome to the Thief Trading blueprint for cracking the AUD/NZD "Aussie vs Kiwi" Forex vault! 🏦🔥 This plan fuses sharp technicals 📊 with gritty fundamentals 📈 to score big loot. Follow the charted strategy, leaning into long entries, and aim to cash out near the high-risk Yellow Moving Average Zone 🎯—a hotspot for overbought vibes, consolidation, or trend flips where bearish bandits prowl 🐻. Grab your profits and treat yourself—you’ve earned it! 💪🎉
Entry Signals 🔑:
Bullish Ambush 🚀: Jump in on a pullback to the Blue MA at 1.08600 or Green MA at 1.07600. 📈
Bearish Blitz ⚡: Go short on a break below the Blue MA at 1.08200, riding the downward wave. 📉
Set a chart alert 🔔 to catch the breakout entry in real-time!
Stop Loss Tactics 🛑:
For buy stop orders, wait for the breakout to confirm before setting your stop. 📍 Place it at 1.07800 for Blue MA bullish entries or 1.06800 for Green MA entries on swing trades. Adjust based on your risk, lot size, and number of orders—play smart, not wild! 😎🔥
Profit Targets 🎯:
Bullish Raiders 🏴☠️: Shoot for 1.09700 or bail early if the market shifts.
Bearish Thieves 🕵️: Target 1.07600.
Scalpers 👀: Stick to long-side scalps. Big players can dive in; smaller traders, join the swing crew and execute the heist with a trailing stop loss to guard your gains! 💰🛡️
The AUD/NZD Forex Bank Heist (Day/Swing Trade) is riding a bullish surge 🐂, driven by key fundamentals. 📜 Dig into the COT Report, macroeconomics, sentiment analysis, intermarket trends, and future price targets for the full scoop—check those links! 🔗👉
Trading Alert: News & Position Management 🚨
News drops can shake the market! 📰 To protect your stash:
Avoid new trades during news events. 🚫
Use trailing stops to lock in profits on open positions. 🔒
Support the heist! Hit that Boost Button 🚀 to power up our robbery squad. With the Thief Trading Style, stacking profits daily is a breeze! 🌟 Stay sharp for the next heist—catch you in the markets! 🤑🐱👤🤝.

EUR/JPY "Yuppy" Heist: Sniping Swiss Profits with Thief Trading!🌍 Hello Global Traders! 🌟
Money Makers, Risk Takers, and Market Shakers! 🤑💸✈️
Dive into our EUR/JPY "Yuppy" Forex heist, crafted with the signature 🔥Thief Trading Style🔥, blending sharp technicals and deep fundamentals. Follow the strategy outlined in the TradingView chart, focusing on a long entry targeting the high-risk MA Zone. Expect a wild ride with overbought conditions, consolidation, and potential trend reversals where bearish players lurk. 🏆💰 Celebrate your wins, traders—you’ve earned it! 💪🎉
Entry 📈: The vault’s open! Grab bullish opportunities at any price, but for precision, set buy limit orders on a 15 or 30-minute timeframe near swing lows or highs for pullback entries.
Stop Loss 🛑:
📍 Place your Thief SL at the recent swing low on the 4H timeframe (163.00) for scalping or day trades.
📍 Adjust SL based on your risk tolerance, lot size, and number of open orders.
Target 🎯: Aim for 167.00
💵 EUR/JPY "Yuppy" is riding a bullish wave, fueled by key market drivers. ☝
Unlock the full picture—dive into Fundamentals, Macro Insights, COT Reports, Quantitative Analysis, Sentiment Outlook, Intermarket Trends, and Future Targets. Check 👉🌎🔗.
⚠️ Trading Alert: News & Position Management 📰🚨
News can shake the market hard. Protect your trades by:
Avoiding new entries during news releases.
Using trailing stops to lock in profits and shield running positions.
📌 Markets move fast—stay sharp, keep learning, and adapt your strategy as conditions evolve.
💖 Power up our heist! 🚀 Tap the Boost Button to amplify our Thief Trading Style and make stealing profits a breeze. Join our crew, grow stronger, and conquer the markets daily with ease. 🏆🤝❤️
Catch you at the next heist, traders—stay ready! 🤑🐱👤🤩

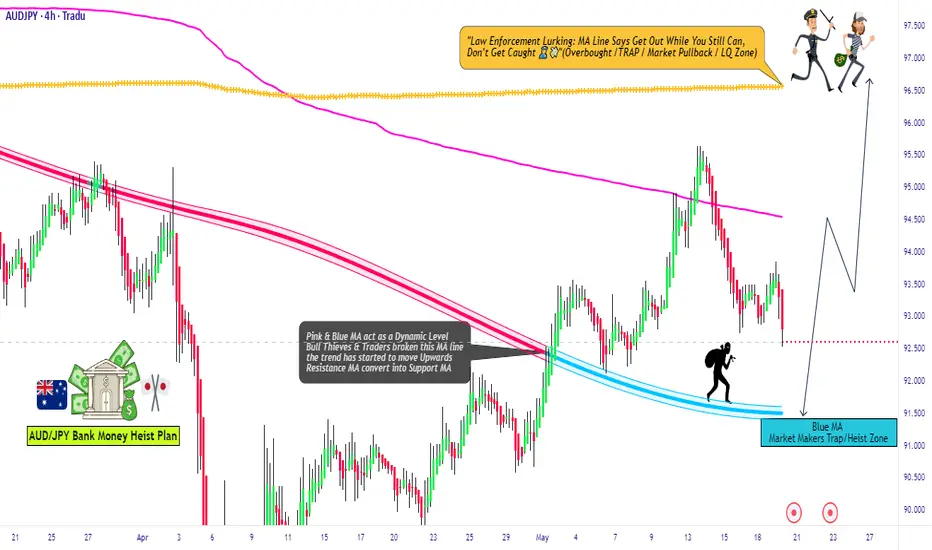
"Epic AUD/JPY Forex Raid Plan Bullish Swing Trade to 96.600!"Ultimate AUD/JPY Forex Heist Plan 🚨 Swing Trade Mastery for Epic Gains! 🚀
Greetings, Wealth Warriors & Market Mavericks! 👋💸
Get ready to execute a legendary heist on the AUD/JPY "Aussie vs Yen" Forex market with our exclusive Thief Trading Style! 🎯 This meticulously crafted strategy blends technical precision and fundamental firepower to maximize your profits. Follow the plan outlined in the chart, focusing on a long entry to conquer the high-risk Yellow MA Zone—a battleground of overbought conditions, consolidation, and potential trend reversals where bearish bandits lurk. 🐻 Stay sharp, lock in profits, and trade safely! 💪🎉
Entry 📈: The heist begins! Watch for the MA pullback in the market maker’s trap zone (91.500 OR above) to strike. Bullish riches await! Set buy stop orders above the Moving Average or place buy limit orders within the 15 or 30-minute timeframe’s recent swing low/high.
Pro tip: Set an alert to catch the breakout entry in action! 🔔
Stop Loss 🛑: Place your Thief SL at the recent swing low/high on the 4H timeframe (90.200) for swing trades. Adjust SL based on your risk tolerance, lot size, and multiple orders.
Target 🎯: Aim for 96.600 or make a swift exit before the target to secure your loot!
🧲 Scalpers, listen up! 👀 Stick to long-side scalps. Big players can jump in now; others, join the swing trade heist. Use a trailing SL to protect your stash. 💰
💵 AUD/JPY "Aussie vs Yen" Forex Heist Plan (Swing Trade) is riding a bullish wave 🐂, fueled by critical market drivers. Dive into the fundamentals—Macro Economics, COT Reports, Quantitative Analysis, Intermarket Analysis, Sentiment Outlook, and Future Trends—before launching your heist. Check the linkKs for the full scoop! 🔗👉
📌 Markets move fast, so stay vigilant and adapt your analysis to the latest developments.
⚠️ Trading Alert: News & Position Management 📰🚨
News releases can shake up prices and volatility. Protect your positions by:
Avoiding new trades during news events
Using trailing stop-loss orders to lock in gains
💖 Boost our heist plan! 💥 Hit the Boost Button to supercharge our team’s strength and make stealing profits a breeze. With the Thief Trading Style, you’ll conquer the market daily with ease! 🏆🤝🎉
Stay tuned for the next epic heist plan, Money Makers! 🤑🐱👤🚀
Market next moveBearish Disruption Scenario:
1. False Breakout Trap:
If the price breaks above the rectangle but lacks strong volume or fails to sustain above resistance, it may turn into a bull trap.
This could lead to a sharp reversal and shake out long positions.
2. Volume Divergence:
Notice that volume is decreasing during the consolidation. Without a spike in volume on breakout, the move could lack conviction.
This weakens the bullish case.
3. Resistance Zone Overhead:
There's likely a resistance zone just above the rectangle (around 3,240–3,260), where selling pressure could resume.
Price may test the zone, reject it, and fall back inside or below the range.
4. Double Top Risk:
The price action on the 18th and current range-top could form a double-top pattern if rejected.
A drop below the lower bound of the rectangle (~3,210) would confirm the pattern, suggesting bearish continuation.
5. Macro or Fundamental Risks:
Any unexpected strong U.S. dollar movement or interest rate expectations could push gold lower, invalidating bullish technical setups.

Silver next move Weak Demand Zone Bounce
The current price action shows only a minor bounce from the demand zone.
A lack of strong bullish candles or volume confirmation may indicate weak buying interest.
2. Lower High Structure
The chart appears to be forming lower highs, suggesting a possible downtrend continuation.
If price fails to break the recent swing high near 32.70, bears might gain control.
3. Volume Concern
Recent bullish candles have decreasing volume, while the latest red candle has higher volume—this could signal a bearish divergence.
4. Bearish Trap Possibility
The current consolidation above support might turn into a distribution zone, leading to a fake breakout downward.

EUR/GBP Caper: Bearish Breakout Blueprint!🌍 Greetings, global money heisters! 🌟 Welcome to the EUR/GBP "Chunnel" Forex Market caper! 🤑💸
Dear traders and fortune chasers, get ready to execute our cunning plan based on the 🔥 Thief Trading Style 🔥, blending sharp technicals with savvy fundamentals. Our mission? A slick short entry targeting the high-risk Support Zone. The market’s oversold, consolidation’s brewing, and a trend reversal’s lurking—perfect for our ambush! 🏆🎯 Here’s the blueprint to steal those pips! 🚀
Entry 📈: The heist kicks off at the Major Support breakout. Lock in your sell at 0.84000 for bearish gains! 💰 For precision, set sell stop orders above the Moving Average or sell limit orders post-breakout within a 15/30-minute window near the swing low/high for pullback entries. 📌 Pro tip: Set a chart alert 🚨 to catch the breakout moment!
Stop Loss 🛑: Stay sharp, crew! For sell stop orders, hold off on placing your stop loss until the breakout confirms. 📍 Place it at the nearest swing high/low on the 4H timeframe (0.84400) for swing/day trades. Adjust based on your risk, lot size, and multiple orders. Play smart—your capital, your rules! ⚠️🔥
Target 🎯: Aim for 0.83500 or slip out early if the market whispers an escape. 🏃♂️💨
💵 Why’s the Chunnel ripe for the taking? The EUR/GBP’s in a bearish groove, driven by key market signals. Curious? Dive into the fundamentals, COT reports, sentiment, and intermarket analysis for the full scoop! 🌎🔗 Check linkk macro trends and future targets & overall score. 📊
⚠️ Trading Alert: News can shake the market like a getaway car! 📰🚗 Avoid new trades during high-impact releases and use trailing stops to lock in profits and shield your positions. Safety first, heisters! 🚫🔐
💖 Boost our heist! Hit that Boost Button 🚀 to fuel our Thief Trading crew. With daily market raids, we’re stacking pips and living the trader’s dream! 🤑🤝 Stay tuned for the next caper—more profits await! 🐱👤🎉
Happy heisting, and let’s make those charts bleed green! 💪🌟

"Pound vs Loonie Forex Heist: Snag GBP/CAD Profits with Thief"🌍 Hello, Global Money Heisters! Ciao, Hola, Salaam, Bonjour! 🌟
Dear Profit Pirates & Cash Chasers, 🤑💸✨
Here’s the slick plan to raid the GBP/CAD "Pound vs Loonie" Forex Vault with 🔥Thief Trading Style🔥, blending sharp technicals and juicy fundamentals. Follow the chart’s long entry strategy to hit the high-risk RED Zone. It’s a wild spot—overbought, consolidating, with bears lurking for a trap. Let’s nab those profits and treat ourselves! 🎉💰
---
GBP/CAD Real-Time Data (May 15, 2025, UTC+1) 📈
- Current Rate: ~1.8540 CAD per GBP, down -0.04% today but holding strong. 📊
- Retail Sentiment: ~65% bullish, eyeing a GBP climb. 😎
- Institutional Sentiment: ~55% bullish, cautiously optimistic. 💼
---
Heist Plan Highlights 🏴☠️
- Entry 📌: Wait for GBP/CAD to smash past 1.8650 (previous high) for a bullish breakout. Set Buy Stop above the Moving Average or Buy Limit at recent 15/30-min swing lows for pullbacks. Set an alert to catch the move! 🚨
- Stop Loss 🛑: Place SL at 1.8400 (4H swing low) for day trades. Adjust based on your risk, lot size, or multiple orders. If using Buy Stop, set SL post-breakout to avoid whipsaws. 🔥
- Target 🎯: Aim for 1.8950 or bail early if the RED Zone feels too hot. 🏃♂️
- Scalpers 👀: Stick to long scalps with trailing SL to lock in gains. Swing traders, join the heist with bigger moves! 💸
---
Why GBP/CAD is Hot 🔥
- Bullish Momentum: Technicals show GBP strength, backed by retail (65%) and institutional (55%) optimism. 📈
- Fundamentals: Check COT reports, macro news, and intermarket analysis for the full picture. Stay sharp with sentiment and future trends! 📰🌎
- News Alert 🚨: Avoid new trades during big news drops. Use trailing SL to protect running positions. 🛡️
---
Boost the Heist! 💪
Hit that Boost Button to supercharge our Thief Trading squad! 🚀 Let’s make stealing pips a breeze. Stay tuned for the next epic heist plan, Money Makers! 🤑🐱👤🎉
Happy Trading, and let’s loot the market together! 🤝❤️

Steal the Show: AUD/CAD Bullish Bank Run!🌍 Greetings, Wealth Warriors & Market Mavericks! 👋😎💸
Hey there, global traders! Ready to crack the vault on the AUD/CAD "Aussie-Loonie" Forex Heist? 🏦💰 Based on our slick *Thief Trading System* blending technical precision and fundamental vibes, here’s the ultimate plan to snag profits. Follow the chart’s long-entry blueprint and aim to cash out near the high-stakes Red Zone—a wild spot where overbought signals, consolidation, and bearish traps lurk. 💪🎯 Stay sharp, grab your loot, and treat yourself—you’ve earned it! 🍾🚀
🔑 Entry 1: “The vault’s open! Spot the MA breakout at 0.90500 and dive in—bullish riches are calling!”
Pro move: Set buy stop orders above the Moving Average or buy limit orders at the latest 15/30-min swing low/high for pullback action. 📊 Add a chart alert to catch the breakout wave! 🌊
🔑 Entry 2: “The heist is on! Stalk the MA pullback in the Market Maker’s Trick Zone at 0.89200, then strike—fortune loves the fearless!”
🛑 Stop Loss: “Listen up, crew! 🗣️ For buy stop orders, hold off on setting that stop loss until the breakout kicks in. 🚀 Place it at the spot I’ve marked 📍, or go rogue at your own risk—don’t blame me if the market bites! 😜 Your trade, your rules, your fire. 🔥”
📍 Thief SL set at the nearest swing low on the 4H timeframe for swing trades.
📍 Size your SL based on your risk, lot size, and number of orders.
🎯 Target: 0.91500—or make a smooth exit near the target zone. 🏴☠️
👀 Scalpers, heads up: Stick to long-side scalps. Got deep pockets? Jump in now! Otherwise, team up with swing traders for the grand heist. Use trailing SL to lock in your cash. 💰🔒
📡 Why’s AUD/CAD hot? The "Aussie-Loonie" is riding a bullish surge, fueled by key drivers. 📰 Dive into fundamentals, COT reports, sentiment analysis, intermarket trends, and future projections. Check the linkss for fundamentals, macro trends and market outlooks for the full scoop! 🔗🌐
⚠️ Trading Alert: News Flash & Position Safety 🗞️🚨
News drops can shake the market like a storm. 🌪️ To protect your trades:
- Skip new entries during news releases. 🚫
- Use trailing stop-loss orders to secure profits and shield your positions. ✅
💥 Boost Our Heist! 💪 Hit that Boost Button to supercharge our Thief Trading squad. 💸 Crush the market daily with our slick strategies. Together, we’ll stack profits with ease! 🤝❤️🎉
Catch you at the next heist, traders—stay locked in for more! 🤑🐱🚀✨

GBPCHF Breakout Eyes 1.1190–1.1290 as Bullish Momentum BuildsGBP/CHF has broken out of a descending wedge formation on the 4H chart, indicating a bullish shift in momentum. This move is supported by a recovering GBP, driven by better-than-expected UK GDP data and BoE easing expectations already priced in. Meanwhile, CHF is softening on safe-haven unwinding and a less aggressive SNB tone. Technicals point to a clean breakout with immediate upside targets at 1.1116 and 1.1190, with potential extension toward 1.1290.
🔍 Technical Analysis
Pattern: Descending wedge breakout on the 4H chart — a bullish continuation pattern.
Breakout Confirmation: Price is now trading above wedge resistance (~1.1045), showing follow-through buying.
Support zone: 1.1000–1.1040 (retest area if price pulls back)
Fibonacci Levels:
1.1116 → 50% Fib retracement + prior resistance
1.1190 → 61.8% Fib and historical reaction zone
1.1290 → 78.6% retracement and next key resistance
📈 Bullish Signals:
EUR/GBP overlay shows inverse correlation supporting GBP strength
Higher lows forming since April → structure is rising
Clean breakout with space to run before major resistance hits
🌍 Fundamental Context
🇬🇧 British Pound (GBP):
UK Q1 GDP: +0.6% q/q — solid beat vs expectations
BoE Positioning: Rate cut expected in H2 2025, but not imminent; GBP supported in the meantime
Trade Conditions: Signs of recovery, but BoE not overly dovish yet
Market Tone: GBP favored short-term due to economic resilience
🇨🇭 Swiss Franc (CHF):
SNB Stance: Recent tone shift toward caution amid deflation signals
Safe Haven Demand: Easing due to progress in U.S.–China trade talks
Macroeconomic Data: Mixed; CPI soft, and growth modest
CHF Outlook: Mildly bearish unless geopolitical risk reignites
🎯 Trade Setup
Entry: Breakout already underway at 1.1050
Upside Targets:
1.1116 (first TP)
1.1190 (major resistance zone)
1.1290 (extension zone)
Stop Loss: Below 1.1000 (below wedge retest zone)
Strategy: Buy-the-dip on pullback to 1.1040–1.1015, or hold breakout long
🧭 Conclusion
GBP/CHF shows a clean bullish breakout both technically and fundamentally. With the UK economy showing near-term resilience and the SNB expected to remain cautious, GBP strength may persist in the short run. Unless geopolitical risks resurface to revive CHF demand, the pair looks poised for a rally toward 1.1190 and possibly 1.1290 in the coming sessions.

AUD/CHF Loonie Heist: Sniping Swiss Profits with Thief Trading!🌍 Hello Global Traders! 🌟
Money Makers, Risk Takers, and Market Shakers! 🤑💸✈️
Dive into our AUD/CHF "Aussie vs Swiss" Forex heist, crafted with the signature 🔥Thief Trading Style🔥, blending sharp technicals and deep fundamentals. Follow the strategy outlined in the TradingView chart, focusing on a long entry targeting the high-risk MA Zone. Expect a wild ride with overbought conditions, consolidation, and potential trend reversals where bearish players lurk. 🏆💰 Celebrate your wins, traders—you’ve earned it! 💪🎉
Entry 📈: The vault’s open! Grab bullish opportunities at any price, but for precision, set buy limit orders on a 15 or 30-minute timeframe near swing lows or highs for pullback entries.
Stop Loss 🛑:
📍 Place your Thief SL at the recent swing low on the 4H timeframe (0.52300) for scalping or day trades.
📍 Adjust SL based on your risk tolerance, lot size, and number of open orders.
Target 🎯: Aim for 0.56000.
💵 AUD/CHF is riding a bullish wave, fueled by key market drivers. ☝
Unlock the full picture—dive into Fundamentals, Macro Insights, COT Reports, Quantitative Analysis, Sentiment Outlook, Intermarket Trends, and Future Targets. Check 👉🌎🔗.
⚠️ Trading Alert: News & Position Management 📰🚨
News can shake the market hard. Protect your trades by:
Avoiding new entries during news releases.
Using trailing stops to lock in profits and shield running positions.
📌 Markets move fast—stay sharp, keep learning, and adapt your strategy as conditions evolve.
💖 Power up our heist! 🚀 Tap the Boost Button to amplify our Thief Trading Style and make stealing profits a breeze. Join our crew, grow stronger, and conquer the markets daily with ease. 🏆🤝❤️
Catch you at the next heist, traders—stay ready! 🤑🐱👤🤩

EURUSD Bearish Structure Forming Amid Dollar UncertaintyEURUSD appears to be carving out a series of lower highs, showing potential signs of distribution. With price compressing inside a symmetrical triangle following multiple failed breakout attempts, the stage could be set for a bearish breakdown. This comes as U.S. inflation and Fed policy hold the spotlight and the euro faces political and structural crosswinds.
📉 Technical Breakdown (4H Chart)
Triple Top / Head & Shoulders Variant Forming:
Price action has traced a rounded top sequence, forming a triple top or complex head and shoulders structure.
Each rally attempt has been followed by steeper declines and faster recoveries—typical of a topping process.
Triangle Contraction Zone:
Current price is consolidating into a symmetrical triangle, which is often a continuation pattern.
Bearish breakout is expected if support around 1.1330–1.1320 fails.
Key Bearish Targets:
TP1: 1.1090 – former resistance turned support.
TP2: 1.0890 – April breakout base and key structure low.
Trade Setup (as per chart):
Sell Entry Zone: Break and retest of 1.1320–1.1300.
Stop Loss: Above 1.1527 (supply zone high).
Targets:
TP1: 1.1090
TP2: 1.0890
🌐 Macro Context
USD Side:
Fed is holding rates steady amid rising inflation fears triggered by tariffs
Tariff shocks are already pushing prices up, while growth slows—a tough environment for the Fed.
Dollar could strengthen if market sentiment shifts risk-off.
Euro Side:
Former EU Commissioner Gentiloni calls for unified borrowing to boost the euro’s global role, as U.S. stability is questioned
Political uncertainty around German leadership transitions may also weigh on the euro short term.
✅ Conclusion
EURUSD is trading at the apex of a tightening triangle pattern following a distribution structure. With a clean break of 1.1320 support, expect increased volatility and bearish momentum toward 1.1090 and 1.0890.

BTCUSD Bitcoin (BTC/USD) highlights price movement between a key resistance zone and a strong support level. Price has currently pushed back into the Fair Value Gap (FVG) zone near 94,600, setting up a potential short-term reversal.
The expectation shown on the chart is for price to react from the FVG/resistance area and move lower toward the support level, targeting around 92,947.
Key Technical Points:
- Resistance Zone: 95,500 -95,750
- FVG Area: Current price is testing imbalance at 94,600.
- Support Level: Strong demand zone near92,750.
- Target Projection: $92,947
Outlook: Price is likely to face selling pressure around the FVG and resistance zone, leading to a possible drop towards the support zone. Traders should monitor bearish confirmations for potential short opportunities.
Would you also like me to create a short caption for posting this chart on social media?

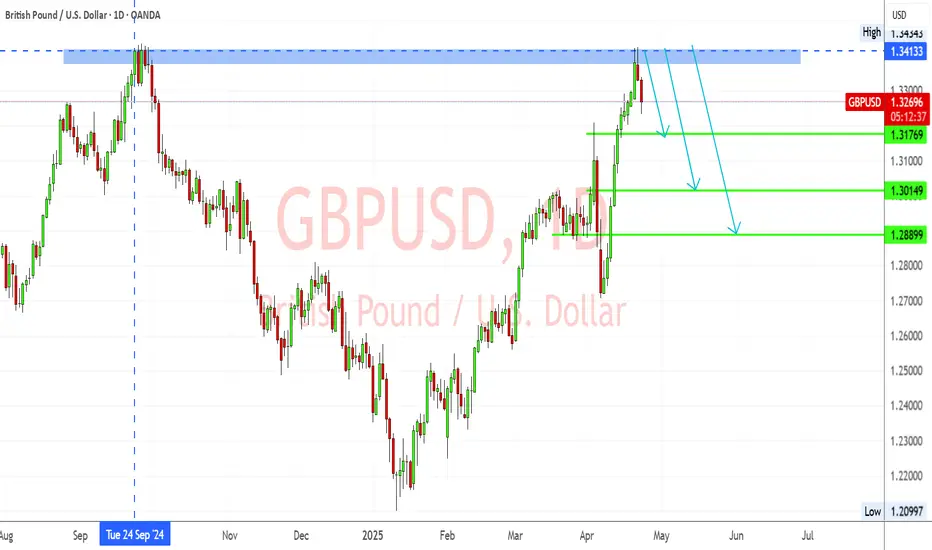
GBPUSD – Rejected at Multi-Month Resistance Amid Weak UK DataGBPUSD has clearly rejected the 1.3413–1.3443 resistance zone—a key area that previously acted as strong supply in September 2024. The pair has formed a bearish rejection candle and is now showing signs of downward momentum.
Key Levels:
Resistance: 1.3413 – 1.3443 (major rejection zone)
TP1: 1.3176 (minor structure)
TP2: 1.3014 (key demand zone)
TP3: 1.2890 (deeper support target)
Bearish Confluences:
Price rejected from major resistance
Bearish candle formation
Previous similar reaction from the same level
Momentum indicators favor downside
📰 Fundamental Analysis:
🔻 UK Data Weakens Further:
According to the latest S&P Global Flash UK PMI (Apr 23):
Composite Output Index: 48.2 (vs 51.5 in March) – 29-month low
Services PMI: 48.9 – 27-month low
Manufacturing PMI: 44.0 – 20-month low
This shows UK private sector activity contracting, led by a steep fall in new export orders, the worst since May 2020.
🔺 Inflation Still High:
Despite falling activity, input and output prices surged, driven by National Insurance hikes and wage growth. This makes it harder for the BoE to justify a cut, despite recession signs.
📌 Conclusion:
The bearish rejection at 1.3413 resistance, combined with deteriorating UK fundamentals, suggests a strong downside setup for GBPUSD. A break below 1.3176 would confirm the bearish move, targeting 1.3014 and potentially 1.2890.
BTCUSD ChatGPT: This chart shows Bitcoin (BTC/USD) on a 4-hour timeframe with key price levels, trends, and targets identified. Let's break down the analysis and potential scenarios for the future price movement:
Key Observations:
1. Price Action & Trend:
- The price of Bitcoin has been in a downward trend, forming a descending channel (shown with blue trendlines). The price has been making lower highs and lower lows, indicating bearish market conditions.
- Recently, Bitcoin tested the resistance zone around 84,067, and after multiple rejections at this level, the price has started to decline.
2. Resistance Zone:
- The resistance zone is marked at 84,067, a key price point where Bitcoin has faced multiple rejections. This level represents a supply zone, and traders …
ChatGPT: 4. Bearish Price Action:
- The chart shows a sharp bearish drop after hitting the resistance zone, suggesting that the market is currently in a correction phase. The price has fallen from higher levels toward the support zone and is likely to experience further downside pressure.
5. Target Level:
- The target for the ongoing bearish move is marked as 78,885, which lies just above the support level at 77,082. This target indicates a potential continuation of the decline towards this support level, and if this support holds, it could be a buying opportunity for a bounce.
Potential Scenarios:
1. Bearish Continuation:
- If the price continues its decline and breaks below 77,082, it would suggest a bearish breakout, with the next target around 78,885 or eve…
ChatGPT: - If the price approaches the 77,082 support level and shows signs of rejection (such as forming a bullish engulfing candle or double bottom pattern), there could be a reversal towards the resistance level at 84,067. In this case, traders may look for a long position, targeting the resistance zone for profit-taking.
3. Consolidation and Range-Bound Behavior:
- There is also a possibility that the price could start consolidating between the resistance and support levels, moving in a sideways pattern. If the price repeatedly tests these boundaries without breaking through, traders can look for range-bound trading strategies with buy orders at support and sell orders at resistance.
4. Breakout Above Resistance:
- If the price breaks above the resistance zone…
ChatGPT: The current chart suggests that Bitcoin is in a downtrend, facing resistance at 84,067 and heading towards the support zone at 77,082. Traders should monitor price action at this support level for potential bounces or breakdowns. If the price rebounds at 77,082, it could move back to test the resistance at 84,067. Conversely, if the price breaks below the support, further downside movement may occur with a target around 78,885 or lower. The descending channel provides a structured view of the market, and a breakout could lead to a bullish reversal or continuation of the bearish trend.

GOLDThis chart represents Gold (XAU/USD) on a 1-hour timeframe. Several key price levels and technical patterns are identified, including resistance zones, FVG (Fair Value Gaps), and target levels. Let's break down the analysis:
Key Observations:
1. Price Action & Trend:
- The price of Gold has been moving downward, as seen from the red trendlines marking a downtrend. The price has faced resistance around the 3,141.644 level, which has acted as a strong supply zone. Following this, Gold showed a sharp decline towards lower levels.
2. Resistance Zone:
- The resistance zone is marked at 3,141.644, which corresponds to a region where the price has previously encountered selling pressure. This level seems to have rejected the price multiple times, confirming it…- The FVG gap is highlighted around the range 3,120.00 - 3,141.644. An FVG represents an area where the price imbalance occurs, typically after a sharp price movement. In many cases, the market returns to fill the gap before continuing in the direction of the initial move. The FVG zone in this chart likely indicates a potential for a price retracement or consolidation before further price action.
- As the price moves downward, the FVG zone is tested, and it might act as a rejection zone if the price moves back into it, suggesting a short trade opportunity.
4. Downward Price Movement:
- The sharp bearish movement observed from the resistance level at 3,141.644 shows a breakdown, confirming a trend reversal. This move pushes the price below the previous su…

euraud sell signal. Don't forget about stop-loss.
Write in the comments all your questions and instruments analysis of which you want to see.
Friends, push the like button, write a comment, and share with your mates - that would be the best THANK YOU.
P.S. I personally will open entry if the price will show it according to my strategy.
Always make your analysis before a trade
