GBPUSD BUYGBP/USD rises to near 1.3450 due to improved market sentiment, UoM Consumer Sentiment eyed
GBP/USD gains ground after registering small losses in the previous session, trading around 1.3440 during the Asian hours on Friday. The pair appreciates as the US Dollar edges lower due to dovish remarks from the Federal Reserve officials.
The Relative Strength Index (RSI) indicator on the 4-hour chart stays below 40, reflecting bearish conditions for GBP/USD. The Fibonacci 61.8% retracement level of the latest uptrend seems to have formed a pivot level at 1.3400.
In case GBP/USD fails to stabilize above 1.3400, technical sellers could remain interested. In this scenario, 1.3300 (Fibonacci 78.6% retracement) and 1.3275 (100-day Simple Moving Average) could be seen as next support levels. On the upside, resistance levels could be spotted at 1.3470 (Fibonacci 50% retracement), 1.3500 (static level, round level) and 1.3540 (Fibonacci 38.2% retracement).
TP 1 1.34403
TP 2 1.34859
TP 3 1.35407
RESISTANCE 1.33627
Forextrading

USDCAD: Bearish Move From Resistance 🇺🇸🇨🇦
USDCAD is going to retrace from a key daily resistance.
A bearish imbalance candle that the price formed after its test
during the Asian session provides a strong intraday bearish confirmation.
Goal - 1.3707
❤️Please, support my work with like, thank you!❤️
I am part of Trade Nation's Influencer program and receive a monthly fee for using their TradingView charts in my analysis.

EURUSDHello Traders! 👋
What are your thoughts on EURUSD?
EURUSD has broken support level and its ascending trendline, indicating a possible shift in short-term market structure and growing bearish pressure.
In the short term, we expect a pullback toward the broken support/trendline zone.
If price fails to reclaim this level, a continued move lower toward the next identified support zone is likely.
As long as price remains below the broken structure, the short-term outlook stays bearish.
Don’t forget to like and share your thoughts in the comments! ❤️
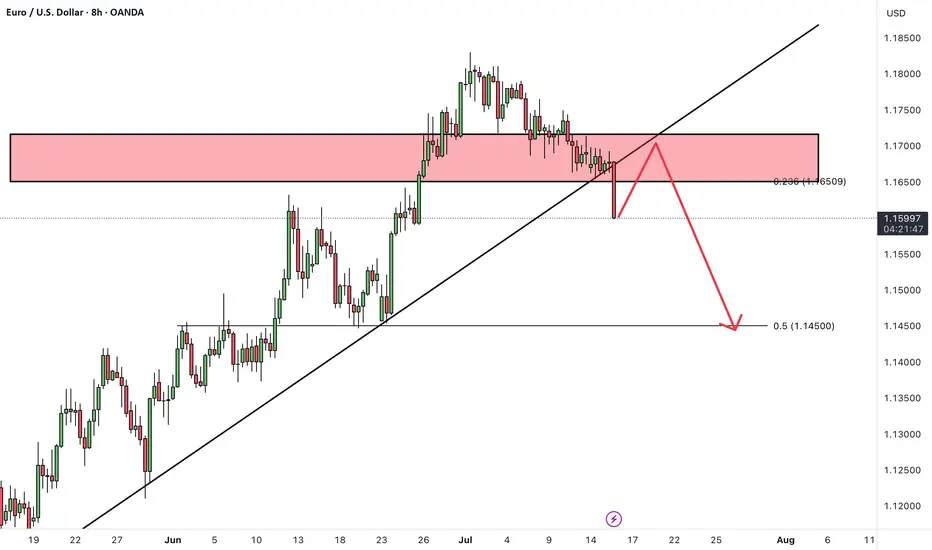
EURUSD: Support & Resistance Analysis 🇪🇺🇺🇸
Here is my fresh support & resistance analysis for EURUSD.
Vertical Structures
Vertical Support 1: Rising trend line
Vertical Support 2: Falling trend line
Vertical Resistance 1: Falling trend line
Horizontal Structures
Support 1: 1.1577 - 1.1600 area
Support 2: 1.1445 - 1.1458 area
Support 3: 1.1356 - 1.1373 area
Support 4: 1.1190 - 1.1280 area
Resistance 1: 1.1682 - 1.1766 area
Resistance 2: 1.1807 - 1.1830 area
Consider these structures for pullback/breakout trading.
❤️Please, support my work with like, thank you!❤️
I am part of Trade Nation's Influencer program and receive a monthly fee for using their TradingView charts in my analysis.

EURUSD BUYThe EUR/USD pair edged lower in the past week, settling a handful of pips below the 1.1700 mark, further retreating from the multi-year peak posted early in July at 1.1830. Financial markets kept revolving around the United States (US) President Donald Trump's targets. With geopolitical woes cooling down, Trump’s focus returned to tariffs, and the Federal Reserve’s (Fed) wait-and-see stance on monetary policy.
Trump fixated on tariffs and Powell
Since the week started, speculative interest kept their eyes on the July 9 tariffs deadline. Trump announced massive retaliatory levies on over 180 trading partners in May, quickly establishing a 90-day grace period afterwards. His goal was to clinch better trade deals with all these nations. But as the date loomed, deals were scarce. The US made some trade arrangements with some minor economies, such as Vietnam, but there were none with major counterparts, nor, of course, with China
TP 1 1.162
TP 2 1.165
TP 3 1.168
RESISTANCE 1.154

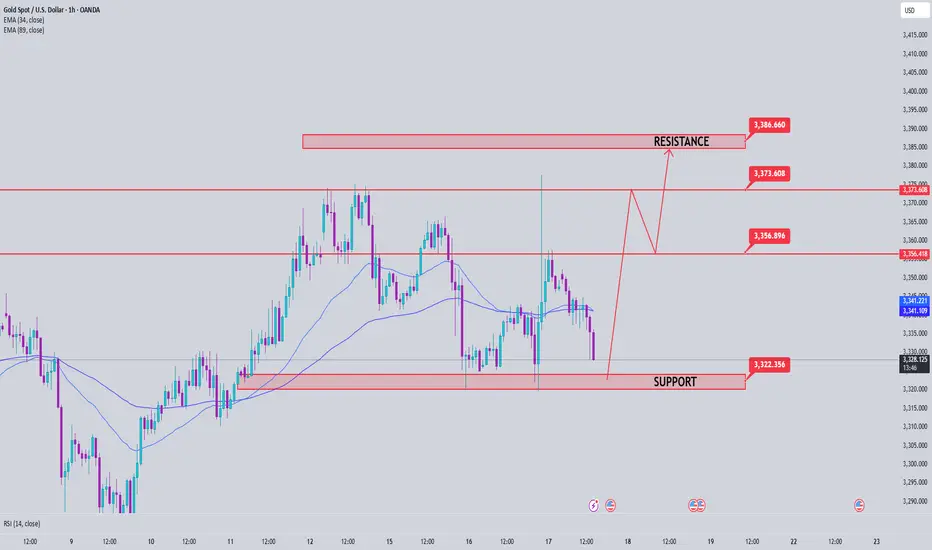
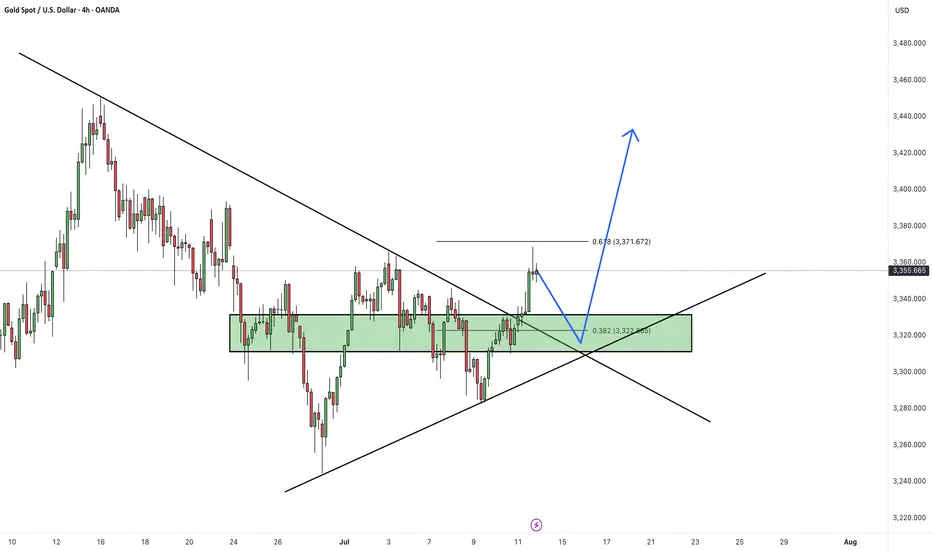
Gold Price Analysis July 17XAUUSD Analysis Today
The price has cleared the liquidity to the 3377 zone, then returned to trading within the triangle. The market is currently waiting for new momentum to determine the next trend.
✅ BUY Scenario
If the 3322-3323 zone continues to hold and there is a bearish rejection signal and confirmation of buying power, gold is expected to continue its uptrend towards the 3373 - 3400 zone.
❌ SELL Scenario
If the price breaks the 3321 support with clear selling pressure, it can extend the decline to 3285.
🔑 Key Level Today
Support: 3321 - 3323
Resistance: 3373 - 3400
💡 Strategy:
Watch the price reaction at the important support zone to decide the next action.
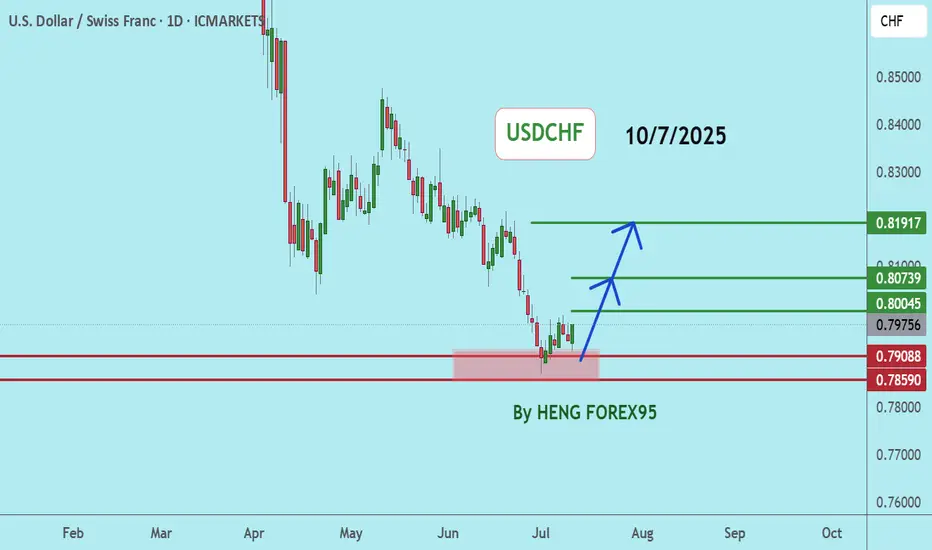
USDCHFUSDCHF If the price can stay above 0.78590, it is expected that the price will rebound. Consider buying in the red zone.
🔥Trading futures, forex, CFDs and stocks carries a risk of loss.
Please consider carefully whether such trading is suitable for you.
>>GooD Luck 😊
❤️ Like and subscribe to never miss a new idea!
Gold Trade Setup Eyes on 15M Demand ZonePrice is coming close to 3338, where we have a 15-Minute Order Block (OB) 📍. This is a fresh demand zone and can give a bullish reaction when price taps into it 🟢.
📌 Plan:
We will wait for price to tap the OB ✅
If we see bullish signs like rejection wicks or bullish candles, we will enter a buy 📈
Our target will be near 3366, just below the bearish FVG 🎯

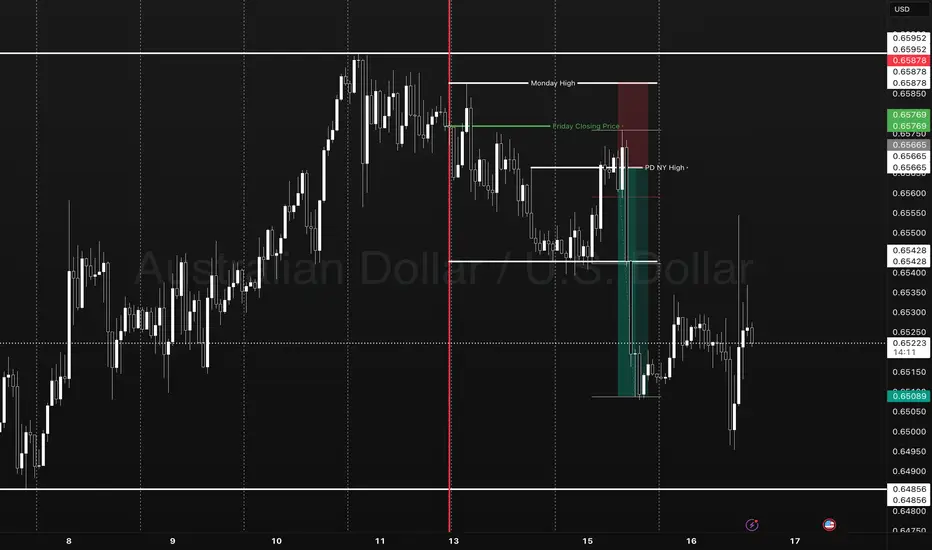
The only key levels you need - DITCH THE INDICATORS- Previous day high/Low
- Weekly high/low
- Session high/low
- Closing Price
In this specific example on OANDA:AUDUSD we have a day 3 Tuesday breakout fail reversal setup on the backside of a previous weeks expansion.
Fridays closing price was plotted going into Monday day 2 on the backside of a new week. Once the initial high low was set on day 2 below the previous weeks high and closing price we than look for short opportunities going into day 3 Tuesday.
In this case day 2 Ny session high acted as the reversal point staying below Friday closing price below the high of the previous week. The Asia/London session printed a beautiful high/low range reversing at near the midpoint of the previous days range (50% retrace.)
A great opportunity for a projected range expansion presented with confluence at a previous days low giving a solid set and forget trade with little to no stress or heat. This parabolic opportunity took place in the NY session below Fridays closing price to a previous weeks LOD level.
- Mondays High (Stop)
- NY session High, Fridays Close (Entry)
- Wed Low, Range expansion (Target)
KEY NOTES:
It is very important to keep your trading simple. As a newer trader I filled my chart with as many indicators as possible trying to find a "signal" because I lacked the patience for the market to give me a setup over multiple days. Now as a more experienced trader I sit back on higher time frames (1H/15M) TO WAIT FOR THE DAILY LEVELS TO PRINT. Avoiding trading inside a range on a low time frame. Lower time frames are only to decrease risk and increase position accuracy already derived from higher time frames. It is key to understand when higher time frame traders are triggered into a market and to understand there are only two main plays from key levels. Keep it simple, find the scalable setups, AND PUT THE SIZE ON WITH CONFIDENCE.
GOLD BUYGold defends 50-day SMA ahead of US PPI inflation data
Gold price attempts a tepid bounce early Wednesday as focus shifts to trade updates and US PPI data. The US Dollar retreats alongside Treasury bond yields even as risk-off flows persist. Gold price needs to crack the 50-day SMA support at $3,323; daily RSI reclaims midline.
As observed on the daily chart, Gold price is stuck between two key barriers, with the 21-day Simple Moving Average (SMA) support-turned-resistance at $3,335 checking the upside.
On the other hand, the 50-day SMA at $3,323 cushions the downside.
The 14-day Relative Strength Index (RSI) is sitting just above the midline, currently near 50.50, suggesting that buyers could retain control.
Acceptance above the 21-day SMA is critical to sustaining the renewed upside, above which the 23.6% Fibonacci Retracement (Fibo) level of the April record rally at $3377 will be put to the test once again.
Further north, the $3,400 round level will challenge bearish commitments.
In contrast, rejection at the 21-day SMA could attack the 50-day SMA support.
Sellers must find a strong foothold below the 50-day SMA on daily closing basis.
The next healthy support levels are located at the 38.2% Fibo level of the same rally at $3,297 and the July low of $3,283.
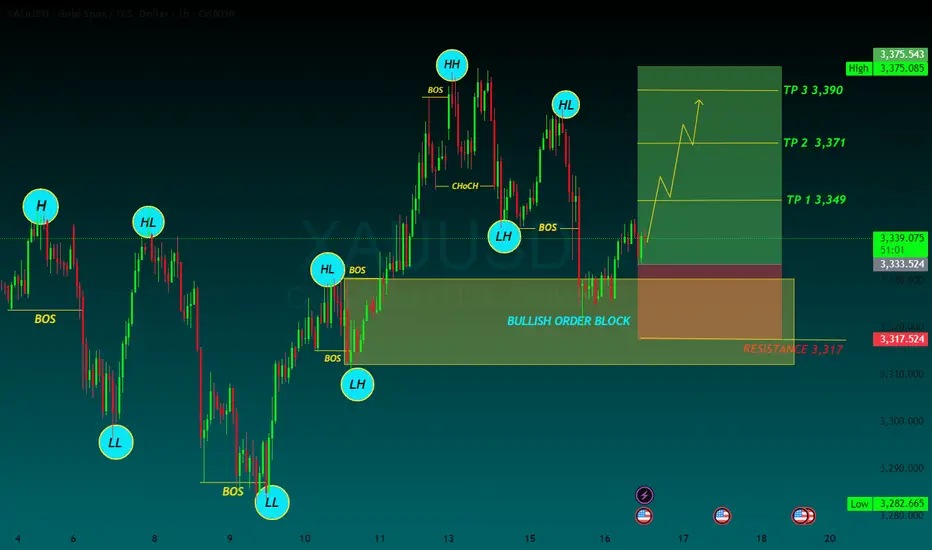
TP 1 3,349
TP 2 3,371
TP 3 3,390
RESISTANCE 3,317
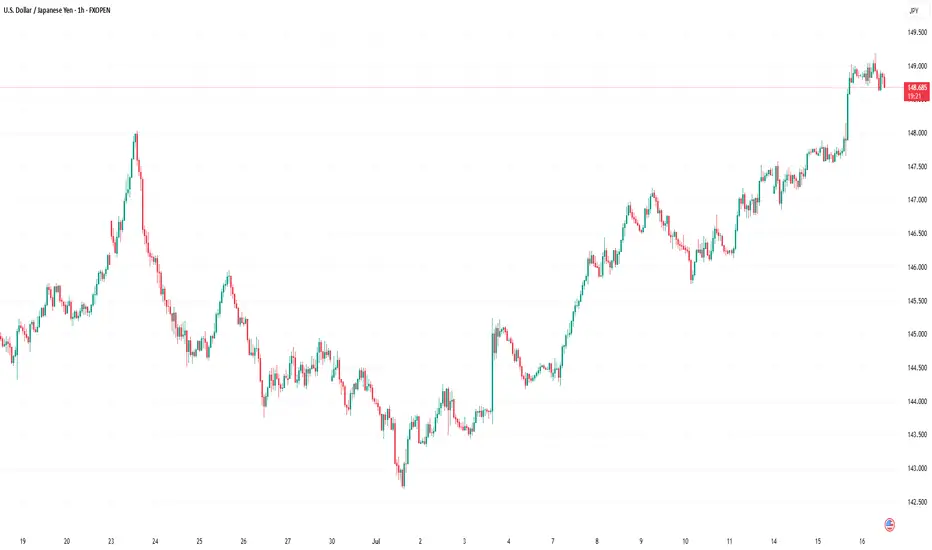
Market Analysis: USD/JPY RisesMarket Analysis: USD/JPY Rises
USD/JPY is rising and might gain pace above the 149.20 resistance.
Important Takeaways for USD/JPY Analysis Today
- USD/JPY climbed higher above the 147.50 and 148.40 levels.
- There is a key bullish trend line forming with support at 148.40 on the hourly chart at FXOpen.
USD/JPY Technical Analysis
On the hourly chart of USD/JPY at FXOpen, the pair started a fresh upward move from the 145.75 zone. The US Dollar gained bullish momentum above 146.55 against the Japanese Yen.
It even cleared the 50-hour simple moving average and 148.00. The pair climbed above 149.00 and traded as high as 149.18. The pair is now consolidating gains above the 23.6% Fib retracement level of the upward move from the 145.74 swing low to the 149.18 high.
The current price action above the 148.50 level is positive. There is also a key bullish trend line forming with support at 148.40. Immediate resistance on the USD/JPY chart is near 149.20.
The first major resistance is near 149.50. If there is a close above the 149.50 level and the RSI moves above 70, the pair could rise toward 150.50. The next major resistance is near 152.00, above which the pair could test 155.00 in the coming days.
On the downside, the first major support is 148.40 and the trend line. The next major support is visible near the 147.90 level. If there is a close below 147.90, the pair could decline steadily.
In the stated case, the pair might drop toward the 147.50 support zone and the 50% Fib retracement level of the upward move from the 145.74 swing low to the 149.18 high. The next stop for the bears may perhaps be near the 146.55 region.
This article represents the opinion of the Companies operating under the FXOpen brand only. It is not to be construed as an offer, solicitation, or recommendation with respect to products and services provided by the Companies operating under the FXOpen brand, nor is it to be considered financial advice.
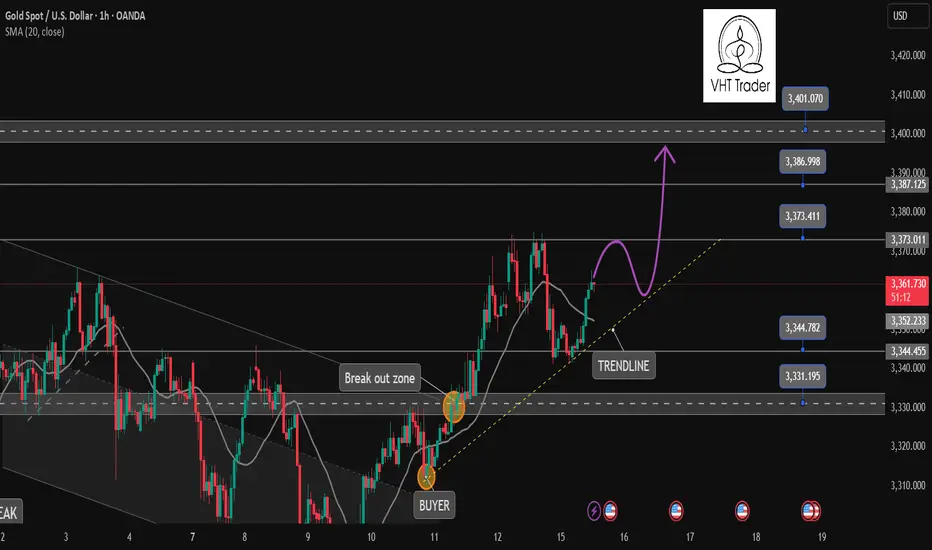
Gold is coming to our target✏️ OANDA:XAUUSD As analyzed on Monday, the market touched the BUY zone at 3345 and continued the bullish wave structure, heading toward the 3400 level. If gold breaks above 3373, it will likely continue its strong upward momentum. Therefore, it is advised to avoid trading against the trend once the 3373 level is broken.
On the other hand, if gold breaks below the key support level at 3343 (yesterday's U.S. session barrier), the current uptrend may temporarily pause. In that case, gold will need to find new momentum to establish a fresh market trend.
📉 Key Levels
SUPPORT: 3343 - 3330 - 3313
RESISTANCE: 3373-3387-3400
Hold BUY order 3345 with target 3400
SELL trigger: Rejection of prices 3373, 3387 with confirmation from sellers
SELL 3400 Strong resistance zone
Leave your comments on the idea. I am happy to read your views.
Remains Below 1.3700 Ahead of CPI Data from the US and CADUSD/CAD Remains Below 1.3700 Ahead of CPI Data from the US and Canada
USD/CAD continues to decline ahead of inflation data from both the US and Canada.
The US inflation rate is expected to rise to 2.7% year-over-year in June, up from 2.4% recorded in May.
Meanwhile, Canada’s CPI is forecasted to increase by 1.9% year-over-year in June, up from 1.7% in May.
USD/CAD is trading around 1.3690 during the European session on Tuesday, following two days of gains. The pair is declining as the US dollar (USD) continues to weaken ahead of the June CPI data from the US. The inflation figures will provide new insights into the Federal Reserve's (Fed) monetary outlook.
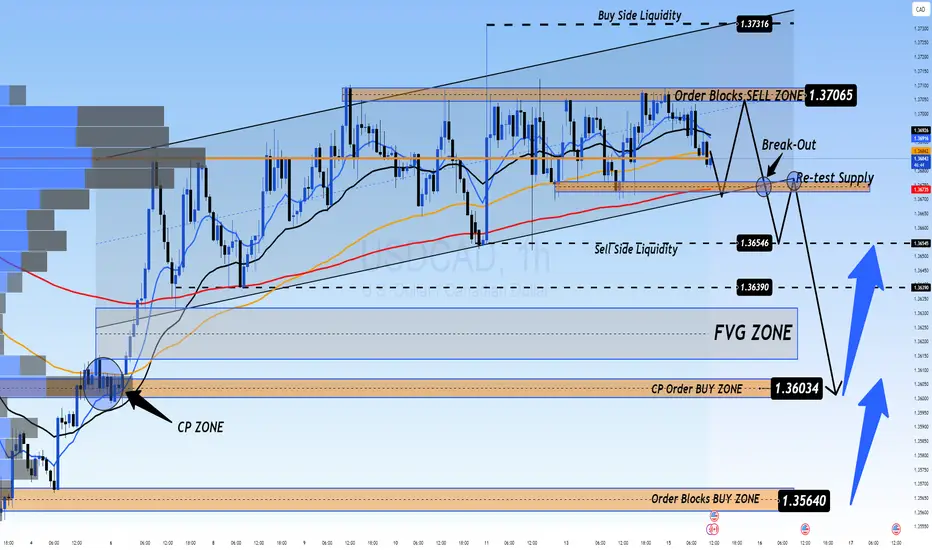
📉 Market Outlook for USD/CAD – Possible Drop on CPI Release
The USDCAD is still in a downtrend, and a sharp drop could occur with today’s CPI data release. Currently, there are two Buy Side Liquidity zones above and Sell Side Liquidity below, with the price balanced around the VPOC zone, which will soon decide the direction after the CPI announcement today.
Market liquidity still holds a FVG below, and with CPI data expected to favor USD, this could trigger a sharp drop towards this liquidity zone, possibly nearing CP OBS at 1.3600, followed by a potential rebound.
If price breaks CP zone, it may head toward a strong OB zone near 1.35xxx. Therefore, caution is advised when monitoring these OB zones.
🎯 Trading Strategy for Today
🟢 BUY ZONE: 1.36000
SL: 1.35500
TP: 1.36500 → 1.37000 → 1.37500 → ????
💬 What are your thoughts on USD/CAD ahead of the CPI data release? Do you expect a strong bounce or a continued decline? Share your views and join the conversation below!
👉 Follow for more updates and insights, and join the community to discuss real-time market moves!
XAUUSD Gold price moves closer to three-week peak amid modest USD downtick
Gold price regains positive traction amid a modest USD pullback from a multi-week high. Persistent trade-related uncertainties also lend support to the safe-haven precious metal. Reduced Fed rate cut bets might cap the commodity ahead of the critical US CPI repo
Fundamental Overview
Amid US President Donald Trump’s fresh tariff threats announced late Monday and his latest criticism of Federal Reserve Chairman Jerome Powell, Gold traders resorted to profit-taking after the bright metal hit a three-week high of $3,375 while bracing for the US inflation report for June.
Trump threatened to impose 100% tariffs on Russia if President Vladimir Putin does not agree to a deal to end his invasion of Ukraine in 50 days, per Bloomberg.
Meanwhile, the US President renewed his attacks on Powell, noting that “interest rates should be at 1% or lower, rather than the 4.25% to 4.50% range the Fed has kept the key rate at so far this year.”
Markets now price in 50 basis points of Fed interest rate cuts by year-end, with the first reduction foreseen in September.
However, it remains to be seen if these expectations hold ground following the US CPI data publication.
Economists are expecting the US annual CPI and core CPI to accelerate 2.7% and 3% in June, reflecting the tariff impact feeding through prices. Meanwhile, the monthly CPI and core CPI inflation figures are set to rise to 0.3% in the same period.
Hotter-than-expected US CPI monthly or annual readings could reinforce the Fed’s patient outlook, pushing back against expectations of two Fed rate cuts this year.
This scenario could help the US Dollar (USD) extend its recovery at the expense of the non-yielding Gold price.
Alternatively, if the data come in below forecasts, it could provide a fresh tailwind to the Gold price on renewed bets that the Fed will remain on track for two rate cuts.
BAY TP
TP 1 3,371
TP 2 3,391
TP 3 3,412
SELL PT
TP 1 3,337
TP 2 3,311
TP 3 3,286

Falling Wedge Formation Ive been bullish on GBPJPY for a couple weeks now and I still believe that it has more upside potential. Here we have a Falling Wedge Formation. we have 4 touches on our pattern already and just waiting for a break and retest to enter again. I am currently in a position based of the retest price gave of the previous resistance (circled on chart). Lets see how it goes.

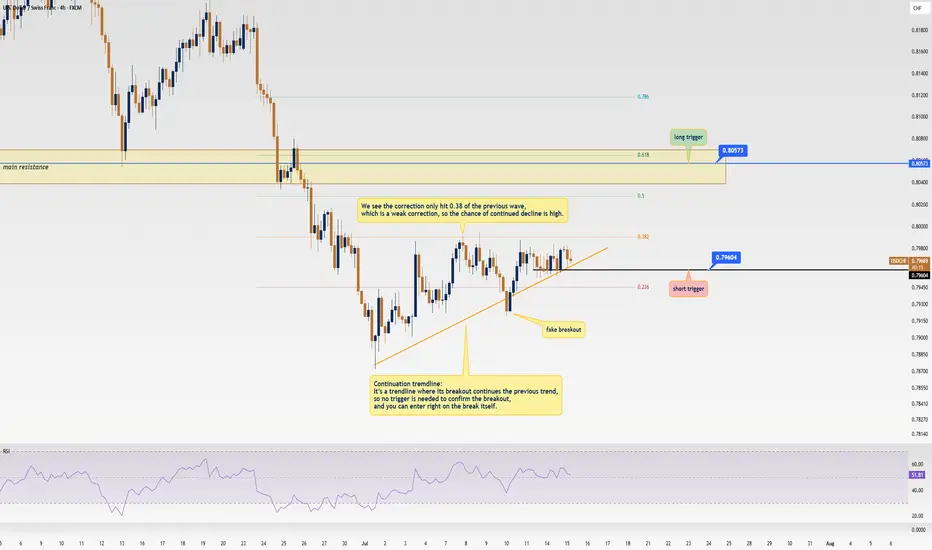
USD/CHF Update: Killer Short Trigger Ready to Pop!Welcome back, traders, it’s Skeptic from Skeptic Lab! 😎 We’ve got a juicy short trigger on USD/CHF that could deliver serious profits if it fires. Stay with me till the end to nail this trade! Let’s dive into the Daily and 4-hour timeframes for the full picture. Currently at $0.79671, here’s the play:
✔️ Daily Timeframe:
We’re in a rock-solid bearish major trend . After hitting a high of $ 0.84649 , we broke the key support at $ 0.80573 , resuming the bearish trend. A pullback to the broken $ 0.80573 level is likely, as it aligns with the 0.6 Fibonacci retracement from the prior 4-hour wave. Trading with the trend is smartest, so shorts are the focus. If you want to long, go with lower risk and close positions faster.
📊 4-Hour Timeframe (Futures Triggers):
Short Trigger: Two options here. Either enter on a trendline break (no extra trigger needed, as continuation trendlines mean the prior trend resumes on a break), or, for a safer play, short on a break of support at $ 0.79604 —this needs minimal confirmation.
Long Trigger: Wait for a break of the resistance zone at $ 0.80573 . Confirm with RSI entering overbought. Check my RSI guide ( link ) for how I use it differently—game-changing stuff!
📉 Key Insight: Stick to the bearish trend for higher-probability trades. Shorts at $0.79604 or on a trendline break are your best bet.
🔔Risk management is your lifeline—cap risk at max 1%–2% per trade to stay in the game.
I’ll catch you in the next analysis—good luck, fam! <3
💬 Let’s Talk!
Which USD/CHF trigger are you locked on? Hit the comments, and let’s crush it together! 😊 If this update lit your fire, smash that boost—it fuels my mission! ✌️
Gold’s Chart Update Next Move: Bullish or Bearish?Gold has shown strong bullish momentum 💪 as it breaks through the descending trendline 📉, positioning itself to target the upper liquidity zone 💰. Right now, we have two key scenarios to watch:
1️⃣ Bullish Scenario: If Gold breaks above the 3345 level and closes a solid candle above it 🔝, we could see a move towards 3360 🚀, signaling further upward potential.
2️⃣ Bearish Scenario: However, if Gold sweeps the 3345 zone and fails to maintain the bullish momentum 🔻, we may see a pullback that could push prices lower 📉.
Stay vigilant 👀 and keep an eye on price action for the next big move! 🔍📊

XAUUSDHello Traders! 👋
What are your thoughts on XAUUSD?
Gold has successfully broken above its descending trendline, signaling a potential shift in market structure and growing bullish momentum.
A pullback toward the broken trendline is now likely, as price may retest the breakout zone.
Once the pullback is completed, we anticipate a bullish continuation and a move toward higher levels.
As long as price holds above the identified support zone, the bullish outlook remains valid.
Will gold resume its rally after the pullback? Share your thoughts in the comments! 🤔👇
Don’t forget to like and share your thoughts in the comments! ❤️
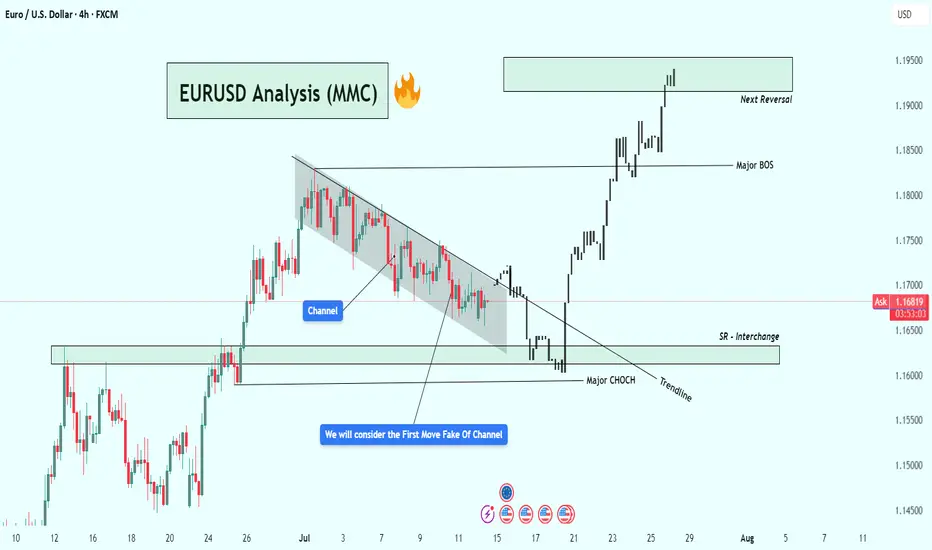
EURUSD Analysis – Smart Money Breakout + Reversal Zone in Play🔹 1. Bearish Channel & Liquidity Trap Setup
Price action from late June into mid-July formed a clearly defined descending channel, with consistent lower highs and lower lows. This structure likely attracted retail traders into short positions, expecting continued downside.
💡 Key Insight: The initial breakout of the channel was a fake move — often referred to as a liquidity grab or inducement. This is typical in smart money models where institutions trap early traders before the real move begins.
🔹 2. Major CHoCH (Change of Character)
Shortly after the fakeout, price sharply reversed and broke a major internal structure level, giving us our first CHoCH confirmation. This is a critical event in SMC, signaling a possible trend reversal from bearish to bullish.
Why it matters: A CHoCH after a channel + fakeout combo is a strong reversal signal, especially when supported by volume and aggression.
Visual cue: Look at the bullish engulfing momentum candle post-fakeout — this was the moment smart money entered.
🔹 3. Trendline Break + SR Interchange (Support/Resistance Flip)
Following the CHoCH, price broke the trendline and came back down to test a high-probability SR Interchange Zone — an area where previous resistance turned into fresh support.
This zone also aligns with the order block and inefficiency area, making it a premium entry for institutions.
Notice how price respected the zone before launching aggressively upward.
🧠 Note: This was the cleanest entry point in this setup — combining structure break, liquidity, and a demand zone.
🔹 4. Major BOS (Break of Structure)
After the retest, EURUSD broke the last major lower high, confirming a Bullish BOS (Break of Structure). This is where many traders realized the trend had shifted.
Market sentiment flipped from bearish to bullish.
Momentum increased, indicating institutional buying pressure.
🔹 5. Next Target: Reversal Zone (Supply Area)
Price has now reached a critical supply zone (1.1930 – 1.1970) where the next major reaction is likely to occur. This area was previously a strong rejection point, and it aligns with a potential higher timeframe supply zone.
⚠️ Watch for:
Bearish rejection wicks
Liquidity sweeps above highs
Bearish engulfing or mitigation patterns
CHoCH on lower timeframes (1H, 15m)
✅ Key Trading Takeaways:
Liquidity Trap: Retail was trapped inside a clean channel.
Fakeout Move: Induced shorts were wiped out.
CHoCH & BOS: Clear reversal pattern with momentum.
Perfect Retest Entry: Price retested demand and launched.
Current Area = Supply/Distribution: Great place to look for shorts or take profits.
📌 Possible Trading Plans:
🔸 Plan A: Reversal Short (Countertrend)
Entry: Inside 1.1930–1.1970 zone
Confirmation: Bearish PA + LTF CHoCH
TP1: Previous BOS (~1.1830)
TP2: Demand zone retest (~1.1650)
SL: Above 1.1980–1.2000
🔸 Plan B: Continuation Long (Breakout Bias)
Entry: Break + Retest above 1.2000 psychological level
SL: Below breakout wick
TP1: 1.2100
TP2: 1.2200+
🔖 Concepts Applied:
Smart Money Concepts (CHoCH, BOS, liquidity sweep)
Price Action Structure
Trendline break and retest
Supply & Demand Zones
Support/Resistance Flip (SR Interchange)
Volume + Momentum Confirmation
🔄 Conclusion:
This chart demonstrates a classic Smart Money narrative:
“Trap the retail, shift the structure, drive price into premium, then reverse.”
We're now at a make-or-break supply zone. Watch price behavior carefully — this is where smart traders either secure profits or prepare for the next leg.
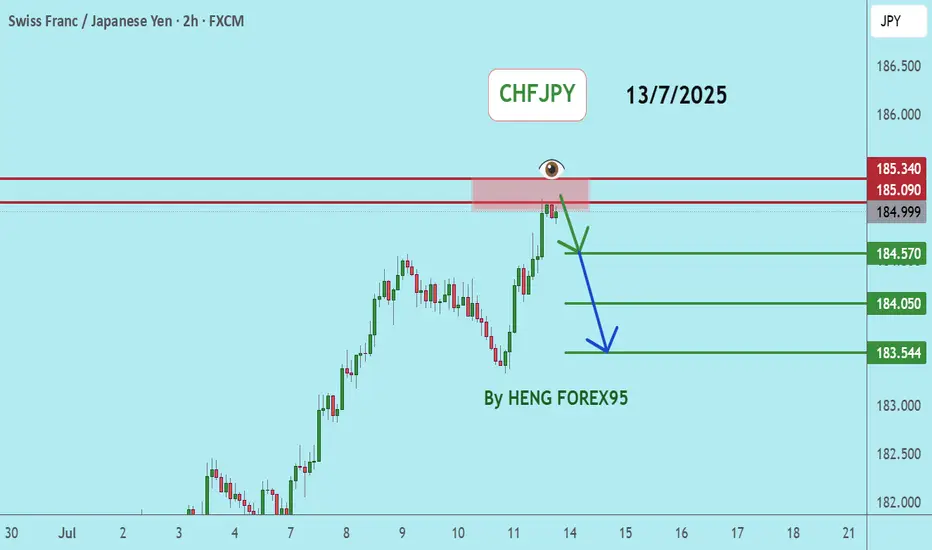
CHFJPYCHFJPY price is in a very bullish trend. At the current price, there may be short-term selling. Therefore, if the price cannot break through 185.34, it is expected that the price will drop. Consider selling the red zone.
🔥Trading futures, forex, CFDs and stocks carries a risk of loss.
Please consider carefully whether such trading is suitable for you.
>>GooD Luck 😊
❤️ Like and subscribe to never miss a new idea!
XAUUSD Analysis : Bullish Move Toward Key Resistance + Target🟩 Overview:
Gold is currently showing a clear bullish breakout on the 2-hour timeframe. The market structure has shifted from a downtrend into a bullish phase, with price now approaching a critical Reversal Zone. Let’s break down the key levels, structure shifts, and potential trade opportunities.
🔍 1. Structure Shift – Trendline Break & BOS Signals:
The price previously followed a Blue Ray Descending Trendline, which acted as dynamic resistance and guided the bearish trend.
As highlighted, “Blue Ray Always Continue Trend” – but in this case, we’ve seen a clean Break of Structure (BOS) that invalidated the bearish setup.
A Minor BOS occurred first, which hinted at weakening selling pressure.
Later, a Major BOS confirmed the bullish transition as the price broke above a key resistance level with strong momentum.
This transition was supported by consistent higher lows and a breakout above the descending resistance trendline — a classic reversal signal.
🟩 2. Demand Zone Reaction – Major Support Held Firm:
The Major Support Zone between $3,280 – $3,300 provided a strong base for buyers.
Multiple wick rejections and bullish engulfing patterns near this zone indicated aggressive buyer interest.
This support has now become the foundation for the recent bullish rally.
🎯 3. Next Target & Reversal Zone:
The current price is hovering around $3,358, showing strong bullish momentum.
The next major resistance area is marked between $3,380 – $3,400, identified as the Next Target + Reversal Zone.
This zone is critical — it aligns with a historical supply area and the previous market swing highs.
Traders should be cautious here, as price may react sharply. Reversal patterns (like bearish engulfing, pin bars, or double tops) could signal a potential retracement.
⚠️ 4. Trade Plan:
🟢 Bullish Bias (Short-Term):
If you entered from the support or trendline breakout, continue to hold long positions until price nears the reversal zone.
Trail stop-loss under the most recent higher low to secure profits.
🔴 Bearish Scenario (Near-Term Reversal Play):
Watch for bearish rejection patterns in the $3,380 – $3,400 zone.
If confirmation appears, potential short setups could offer a retracement back to $3,330 – $3,320.
📌 Key Levels Summary:
Major Support Zone: $3,280 – $3,300 ✅
Next Target + Reversal Zone: $3,380 – $3,400 ⚠️
Current Price: $3,358
Major BOS Level: Confirmed
Trendline: Broken with strong bullish pressure
🧠 Final Thoughts:
Gold has officially shifted gears. The bullish breakout is in motion, and the trendline break + BOS combo supports further upside — at least until the reversal zone is tested. However, this is also where the market could exhaust, making it crucial to monitor price action closely.
Stay patient, wait for confirmation, and let the levels guide your next move.

XAUUSD Trade UpdateYesterday price failed to hold below key support.
Gold has now broken out of a descending channel after reclaiming the global trendline. It’s trading above the nearest fractal and testing the MA200, with Awesome Oscillator flashing bullish momentum.
#TradeIdea
🔼 Buy XAUUSD — only if we get a clear consolidation above $3340
🎯 Target 1: $3360
🎯 Target 2: $3385 (only after Target 1 is hit)
⚠️ Wait for confirmation — no premature entries.

US Dollar Strengthens Following Trump’s Tariff DecisionUS Dollar Strengthens Following Trump’s Tariff Decision
US President Donald Trump has announced his decision to impose new tariffs:
→ For Canada, tariffs are set at 35%. They are scheduled to take effect on 1 August, although negotiations may take place before this date, potentially influencing Trump’s final stance.
→ For many other countries, tariffs may be set at 15% or 20%;
→ For the European Union, the exact tariff levels have not yet been disclosed.
Overall, Trump’s latest comments have added to the uncertainty surrounding the specific tariffs to be applied to each country. The financial markets reacted as follows:
→ The US dollar strengthened against other currencies (including the Canadian dollar);
→ Equity markets saw a modest decline.
Technical Analysis of the USD/CAD Chart
As soon as the announcement of a 35% tariff on Canadian imports to the US was made public, the USD/CAD rate spiked sharply (as indicated by the arrow), reaching levels last seen at the end of June. In the hours that followed, the pair stabilised.
Taking a broader view, the chart appears to show a triangular formation, which consists of:
→ A descending resistance line (R);
→ A key support level (S) around 1.3570.
From this perspective, it is worth noting that the bulls’ attempt to break above the resistance line amid the 35% tariff news did not succeed, indicating strong selling pressure.
At the same time, the price action of USD/CAD in early July allows us to identify a local support level (marked by the blue line). This suggests that, for now, the pair is consolidating within a formation bounded by the blue support line and resistance line R.
However, how long this consolidation will last, and which direction the breakout will take, will most likely depend on the next round of news regarding US–Canada trade negotiations.
This article represents the opinion of the Companies operating under the FXOpen brand only. It is not to be construed as an offer, solicitation, or recommendation with respect to products and services provided by the Companies operating under the FXOpen brand, nor is it to be considered financial advice.
