FED countdown | Buy at support, Sell at resistanceXAU/USD – 17/09 | Captain Vincent ⚓
🔎 Captain’s Log – News Context
18/09, 01:00 (US time) : FED rate decision + Dot Plot → policy outlook for upcoming meetings
01:30 : Powell’s speech – the key market focus
Market consensus: FED almost certain to cut -25bps . However, the -50bps scenario still exists → if it happens, it will be a “big boost” for Gold
During Asia–Europe session, Gold faced early profit-taking, dropping quickly to 3,677 – 3,675 , reflecting caution ahead of the FED
⏩ Captain’s Summary
Gold is making a technical correction before the FED.
Medium-term trend remains bullish , but patience is needed to wait for pullbacks for safer Buy entries.
📈 Captain’s Chart – Technical Analysis
Storm Breaker (Resistance / Sell Zone)
Nearby OB: 3,693 – 3,695 (short scalp)
ATH Zone: 3,717 – 3,720 (strong resistance, potential heavy selling)
Golden Harbor (Support / Buy Zone)
Shallow Dock: 3,656 – 3,657 (short-term)
Main Harbor: 3,629 – 3,630
Market Structure
Multiple BoS confirm the bullish trend
Price retracing to support, likely to bounce back and test 3,693 – 3,717
Break above 3,720 → new ATH confirmed
🎯 Captain’s Map – Trade Plan
✅ Buy (priority)
Buy Zone 1
Entry: 3,656 – 3,657
SL: 3,648
TP: 3,675 – 3,693 – 3,717
Buy Zone 2
Entry: 3,629 – 3,630
SL: 3,618
TP: 3,656 – 3,690 – 3,717
⚡ Sell (only at resistance)
Sell Zone OB
Entry: 3,693 – 3,695
SL: 3,705
TP: 3,675 – 3,662
Sell Zone ATH
Entry: 3,717 – 3,720
SL: 3,727
TP: 3,706 – 3,690 – 3,675
⚓ Captain’s Note
“Before the FED countdown, profit-taking waves pulled the Golden ship near Golden Harbor 🏝️ (3,656 – 3,629) .
But the main current still flows north, the bullish trend remains intact.
Storm Breaker 🌊 (3,693 – 3,720) is the high wave, suitable for short Quick Boarding 🚤 scalps.
Sailors must stay patient – the FED wind could be the power to propel Gold beyond new peaks.”
Forextrading

XAUUSDOverall, gold prices remain in a strong uptrend, but in the short term, if the price fails to break above 3704, there is a possibility of a downside, so consider selling in the red zone.
🔥Trading futures, forex, CFDs and stocks carries a risk of loss.
Please consider carefully whether such trading is suitable for you.
>>GooD Luck 😊
❤️ Like and subscribe to never miss a new idea!

USDJPYHello Traders! 👋
What are your thoughts on USDJPY?
USD/JPY has been oscillating within a defined range for several weeks, bouncing between key support and resistance levels.
Price action remains choppy and directionless within the current range.
Potential Scenario:
• A break below the support zone could trigger a downside move toward the next identified targets.
• For a more confident entry, it’s recommended to wait for a confirmed breakdown below support before entering short positions.
Upcoming FOMC and BoJ policy meetings could act as catalysts for the next directional move.
Don’t forget to like and share your thoughts in the comments! ❤️

AUDJPY Short SetupTrend: Bearish
Divergence: None
Continuation Pattern :Decending Parallel Channel
Bias: Bearish
Scenario:Short Entry at at market rate after potential LH
Trade Plan
Stop Loss : 97.97
Entry Level:97.751
TP1 97.532

is forming a Double Top pattern1. Technical pattern
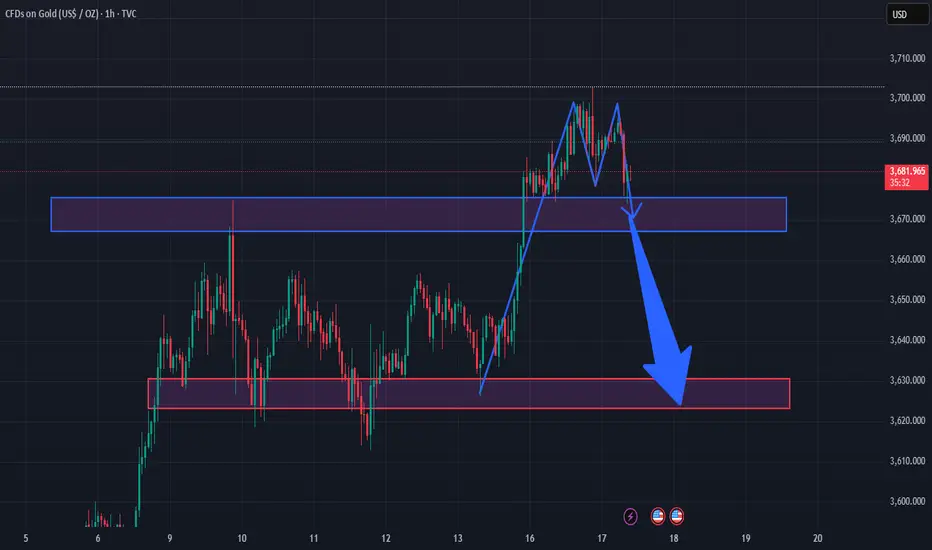
The gold chart (XAU/USD, H1 frame) is showing a Double Top pattern (2 peaks) - this is a classic bearish reversal pattern.
After creating 2 peaks around the 3,700 area, the price has turned down to the support area.
2. Important areas
Short-term resistance: around 3,695 - 3,705 (old peak).
Nearby support: 3,670 - 3,675 area (blue box). This is the neckline of the Double Top pattern.
Next strong support: 3,630 - 3,640 area (red box). This is the area where the price has maintained the previous uptrend.
3. Price scenario
If the price maintains the blue box (does not break the neckline) → it can bounce back to test the 3,695 - 3,705 area.
If the price breaks through the green box with strong volume → confirms the completion of the Double Top pattern, it is likely to fall to the red box 3,630 - 3,640.
The short-term trend is leaning towards bearish (down) due to the appearance of a reversal pattern.
4. Trading suggestions
Sell when the price clearly breaks through 3,670 - 3,675.
Take profit around 3,630 - 3,640.
Stop loss above the nearest peak 3,705 to limit risk.
👉 Summary: This chart is leaning towards a bearish scenario. Neckline 3,670 - 3,675 is the key to confirm the Double Top pattern.
SELL setup following the short-term bearish trend, with entry ar1. Technical Pattern
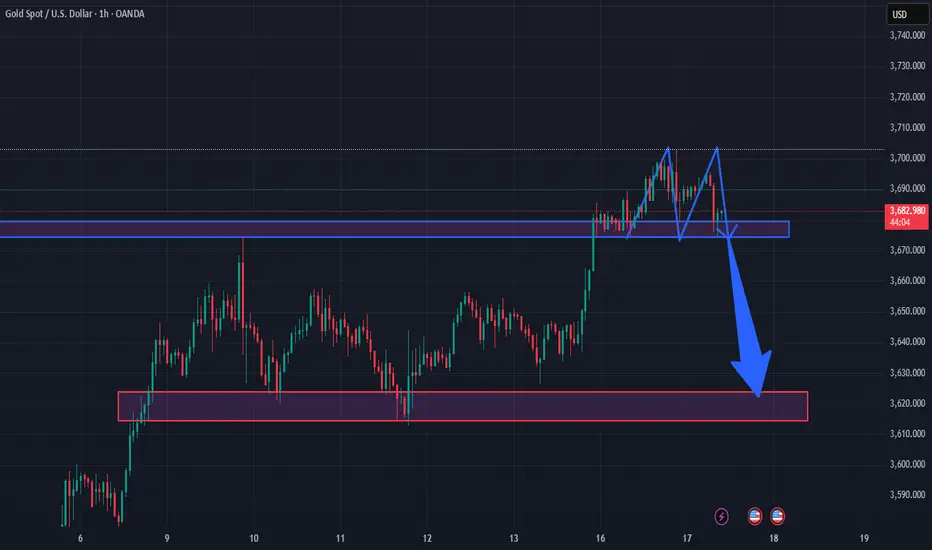
The market is forming a Double Top pattern around the 3,700 level.
After breaking the neckline (previous support, now turned resistance, marked in blue), the price is retesting this area.
This confirms a potential bearish continuation.
2. Support & Resistance
Key Resistance: 3,690 – 3,705 (neckline area after the breakdown).
Near-term Support: 3,670 (current retest zone).
Major Support: 3,615 – 3,625 (red zone below, aligning with previous lows and accumulation area).
3. Price Scenarios
If the price fails to break above 3,690 – 3,705, there is a high probability of dropping toward 3,620 – 3,625.
On the other hand, if the price closes above 3,705 on H1/H4, the bearish setup fails, and the market could resume its bullish trend.
4. Trading Implication
This is a SELL setup following the short-term bearish trend, with entry around 3,685 – 3,695.
Target: 3,620 – 3,625.
Stop Loss: above 3,710 (to avoid a false breakout).
FED shaken by politics | Gold eyes new ATH🟡 XAU/USD – 16/09 | Captain Vincent ⚓
🔎 Captain’s Log – News Context
FED & US Politics :
S. Miran elected to the FED Board but still serves as Trump’s economic advisor → concerns FED may face White House influence.
Michelle Mills elected with a narrow 48–47 margin.
Appeals Court blocked Trump from firing L. Cook, affirming FED’s independence, but raising the risk of a legal battle at the Supreme Court.
US Economy :
6:30 AM (US time): Retail Sales release – key consumer spending indicator.
Probability of a -50bps FED cut this week is down to 1.2% , nearly ruled out. FED is almost certain to deliver -25bps next week.
⏩ Captain’s Summary : Politics create noise, but the macro backdrop (FED easing + weak US data) remains the tailwind supporting Gold’s journey toward new ATH.
📈 Captain’s Chart – Technical Analysis
Storm Breaker (Resistance / Sell Zone) :
3706 – 3714 (Fibonacci resistance)
3722 – 3724 (Strong Sell Zone, potential ATH test)
Golden Harbor (Support / Buy Zone) :
FVG Dock: 3666 – 3668
OB Harbor: 3643 – 3645
Strong Low: 3611 (deep support)
Market Structure :
After a series of BoS , Gold broke out of sideways EqH/EqL and surged.
Preferred scenario: retrace to FVG 3666 , then bounce toward 3714 – 3722.
If 3722 breaks successfully → confirms new ATH and extends bullish momentum.
🎯 Captain’s Map – Trade Plan
✅ Buy (priority)
Buy 1 (FVG)
Entry: 3666 – 3668
SL: 3657
TP: 3690 – 3706 – 3714 – 372x
Buy 2 (OB)
Entry: 3643 – 3645
SL: 3632
TP: 3666 – 3700 – 3714 – 372x
⚡ Sell (short scalp at resistance)
Sell Zone
Entry: 3722 – 3724
SL: 3732
TP: 3714 – 3706 – 3690
⚓ Captain’s Note
“The Golden ship has broken free from sideways waters and is heading toward new peaks. Golden Harbor 🏝️ (3666 – 3643) is the safe dock for sailors to gather strength before sailing further. Storm Breaker 🌊 (3722 – 3724) is the big wave, suitable only for short Quick Boarding 🚤 . With dovish winds from the FED, the Golden sails are set toward new ATH.”

EURUSDHello Hello Traders! 👋
What are your thoughts on EURUSD?
EUR/USD has been trapped in a sideways range for the past few weeks, showing choppy back-and-forth movements.
However, the recent break above the descending trendline suggests that a potential bullish breakout could be underway.
After some short-term consolidation, the pair could gain bullish momentum and head toward the next resistance levels.
Thursday’s U.S. CPI data will be a key catalyst that may drive volatility and determine the pair's next direction.
Don’t forget to like and share your thoughts in the comments! ❤️

EUR/USD | Supply Zone in Play at 1.179–1.1810 (READ THE CAPTION)By analyzing the EUR/USD chart on the 6-hour timeframe, we can see that after dropping to 1.166, the price gained demand again and is now trading around 1.177.
Ahead, there is a key supply zone between 1.179 and 1.1810, and we need to carefully watch how the price reacts to this area. The important demand zones are 1.163–1.166 and 1.156–1.159.
Please support me with your likes and comments to motivate me to share more analysis with you and share your opinion about the possible trend of this chart with me !
Best Regards , Arman Shaban

XAUUSDHello Traders! 👋
What are your thoughts on Gold?
Gold has entered a corrective phase after printing a new high and is currently consolidating within a clearly defined channel.
The price is fluctuating inside this channel and may even test the lower boundary before continuing higher.
As long as gold remains within the channel, sideways to slightly downward movement can be expected in the short term.
A bullish breakout above the channel would likely act as a trigger for the next impulsive move, potentially leading to a new all-time high.
This week, the U.S. interest rate decision will be in the spotlight, which could significantly impact gold’s next move.
Wait for a confirmed breakout before entering long. Premature entries within the range may face choppy action.
Don’t forget to like and share your thoughts in the comments! ❤️

EUR/USD: Bullish Surge to 1.183?FX:EURUSD is setting up for a bullish move on the 4-hour chart , with an entry zone between 1.16335-1.16650 near a key support and trendline.
The target range of 1.1808-1.183 aligns with the next resistance, offering strong upside potential. Set a stop loss on a close below 1.15740 to manage risk effectively. 🌟
A break above 1.1675 with solid volume could trigger this surge, driven by EUR strength and U.S. data shifts. Watch economic releases! 💡 Ready for this push? Drop your take below! 👇
📝 Trade Plan:
✅ Entry Zone: 1.16335 – 1.16650 (support + trendline area)
❌ Stop Loss: Daily close below 1.15740 to manage risk
🎯 Target Zone: 1.1808 – 1.1830 (next resistance)
Ready for this push? Drop your take below! 👇

near target is 3,700 – 3,720.1. Main Trend
The chart is currently in a short-term uptrend, shown by the rising channel (red parallel trendlines).
Price has bounced multiple times from the lower trendline → confirming that buyers remain in control.
2. Support & Resistance Zones
Nearest Resistance: 3,675 – 3,685 (blue zone). This level has been tested multiple times and price is now trading around it.
Key Support: around 3,640 (lower trendline). Further below, the strong support is at 3,520 – 3,540 (red box).
3. Current Signals
Price has just broken out above the 3,675 – 3,685 resistance zone, and is now pulling back for a retest.
If price holds above 3,675 → the bullish trend will be reinforced.
The chart also has an upward arrow drawn → indicating expectation of a move towards 3,700.
4. Scenarios Ahead
Bullish Scenario (priority):
If price holds above 3,675 – 3,685 and bounces up, the next target is 3,700 – 3,720.
A break above 3,720 could extend the rally towards 3,750 – 3,770.
Bearish/Correction Scenario:
If price fails to hold 3,675 and breaks lower → it may retest the rising trendline around 3,640.
If the trendline also breaks, there is risk of a drop towards the strong support at 3,520 – 3,540.
5. Conclusion
The overall trend is still bullish.
The key level to watch: 3,675 – 3,685 (retest zone).
Trading Strategy: Prefer long positions if price holds above 3,675, with stop-loss below the trendline. Target 3,700 – 3,720.
Conversely, if 3,675 and the trendline fail, wait for lower supports.

GBPUSD Long Trade SetupGBPUSD is showing a long trade setup there is no divergence at trend, a series of HHs and HHLs is in trend we will make entry at HH breakout wil SL at HL
Trade Plan
Stop Loss : 1.35220
Entry Level: 1.3622
TP :1.3722

GBPUSD Bullish SetupGBPUSD is showing a long trade setup there is no divergence at trend, a series of HHs and HHLs is in trend we will make entry at HH breakout wil SL at HL
Trade Plan
Stop Loss : 1.35838
Entry Level: 1.3622
TP :1.366

GBPNZD Bullish SetupTrend: Bullish
Divergence: Bullish
Bias: Bullish
Scenario: gave breakout of Last LH and made HH, Take entry at FIB 0.382

EURUSD - 15-Minute Opportunity – Risk/Reward 2.22Guys, greetings
I’ve prepared an EURUSD analysis for you.
On my 15-minute chart:
🟢 Buy entry level: 1.17152
🔴 Stop level: 1.17002
🎯 TP1: 1.17206
🎯 TP2: 1.17287
🎯 TP3: 1.17480
Risk/reward ratio for this trade: 2.22
Guys, every single like you give is my biggest motivation to keep sharing these analyses.
Thank you to all my friends who support me with their likes and stand by my side.

Market Analysis: EUR/GBP FallsMarket Analysis: EUR/GBP Falls
EUR/GBP declined and is now consolidating losses below 0.8660.
Important Takeaways for EUR/GBP Analysis Today
- EUR/GBP is trading in a bearish zone below the 0.8650 pivot level.
- There is a major declining channel forming with resistance near 0.8655 on the hourly chart.
EUR/GBP Technical Analysis
On the hourly chart of EUR/GBP, the pair started a steady decline from well above 0.8680. It even declined below 0.8650 and the 50-hour simple moving average. A low was formed at 0.8629 and the pair is now consolidating losses. There was a move above 0.8640 and the 23.6% Fib retracement level of the downward move from the 0.8684 swing high to the 0.8629 low.
The pair is now facing resistance near a declining channel at 0.8655 and the 50% Fib retracement. The next major barrier for the bulls could be 0.8662.
A close above 0.8662 might accelerate gains. In the stated case, the bulls may perhaps aim for a test of 0.8685. Any more gains might send the pair toward the 0.8740 pivot.
Immediate support sits near 0.8640. The first key zone is at 0.8620. A downside break below 0.8620 might call for more downsides. In the stated case, the pair could drop toward 0.8580.
This article represents the opinion of the Companies operating under the FXOpen brand only. It is not to be construed as an offer, solicitation, or recommendation with respect to products and services provided by the Companies operating under the FXOpen brand, nor is it to be considered financial advice.

Market Analysis: GBP/USD Retains GainsMarket Analysis: GBP/USD Retains Gains
GBP/USD is showing positive signs above 1.3520.
Important Takeaways for GBP/USD Analysis Today
- The British Pound is attempting a fresh increase above 1.3520.
- There is a key bullish trend line forming with support near 1.3555 on the hourly chart of GBP/USD.
GBP/USD Technical Analysis
On the hourly chart of GBP/USD, the pair remained well-bid above 1.3495. The British Pound started a decent increase above 1.3530 against the US Dollar.
The bulls were able to push the pair above the 50-hour simple moving average and 1.3550. The pair even climbed above 1.3580 and traded as high as 1.3582. Recently, there was a pullback below 1.3555 and the 50% Fib retracement level of the upward move from the 1.3495 swing low to the 1.3582 high.
However, the bulls were active near the 1.3530 support since it coincides with the 61.8% Fib retracement. The pair is again rising above 1.3555. There is also a key bullish trend line forming with support near 1.3555.
On the upside, the GBP/USD chart indicates that the pair is facing resistance near 1.3580. The next hurdle for the bulls could be 1.3590. A close above 1.3590 could open the doors for a move toward 1.3640. Any more gains might send GBP/USD toward 1.3700.
On the downside, the bulls might remain active near the same trend line at 1.3555. If there is a downside break below 1.3555, the pair could accelerate lower.
The first major support is at 1.3530, below which the pair could test 1.3495. The next key area for the bulls could be 1.3475, below which the pair could test 1.3440. Any more losses could lead toward 1.3420.
This article represents the opinion of the Companies operating under the FXOpen brand only. It is not to be construed as an offer, solicitation, or recommendation with respect to products and services provided by the Companies operating under the FXOpen brand, nor is it to be considered financial advice.

Gold faces early selling pressure | Main trend still Buy🟡 XAU/USD – 15/09 | Captain Vincent ⚓
🔎 Captain’s Log – News Context
FED rate cut probabilities this week :
-25bps : 96.4% (up from 89.1%).
-50bps : only 3.0% (down sharply from 10.9%).
Trump : Announced more sanctions on Russia, urged NATO to stop buying Russian oil; also emphasized “the possibility of significant FED rate cuts.”
Key event today : New York Manufacturing Index at 1:30 (US time).
⏩ Captain’s Summary : The sharp drop in -50bps expectations caused early selling pressure on Gold this morning. But overall, FED is still certain to cut rates and inflation is cooling → the bigger trend continues to favor Buy .
📈 Captain’s Chart – Technical Analysis
Storm Breaker (Resistance / Sell Zone) : 3665 – 3670 (Weak High & upper cap).
Golden Harbor (Support / Buy Zone) : 3623 – 3603 – 3587.
Market Structure :
On H1, Gold is moving within a tightening triangle with EqH and EqL .
Main trend stays bullish, but needs a retest of support before rallying toward 3665 – 3670.
🎯 Captain’s Map – Trade Plan
✅ Buy (priority)
Buy Zone 1
Entry: 3623 – 3625
SL: 3612
TP: 3640 – 3650 – 3660 – 3665+
Buy Zone 2 (FVG)
Entry: 3603 – 3605
SL: 3592
TP: 3620 – 3640 – 3655 – 3665
Deep Buy Zone
Entry: 3587 – 3590
SL: 3575
TP: 3610 – 3630 – 3650
⚡ Sell (short scalp at resistance)
Sell Zone
Entry: 3665 – 3670
SL: 3678
TP: 3655 – 3645 – 3635 – 36xx
⚓ Captain’s Note
“The Golden ship faces headwinds this morning as sailors reduce expectations for a -50bps cut. But the larger sail remains filled with dovish FED winds, steering the voyage north. Golden Harbor 🏝️ (3623 – 3603 – 3587) is the safe dock to gather strength. Storm Breaker 🌊 (3665 – 3670) may raise waves, suitable for short Quick Boarding 🚤 . The main journey still favors Buy , waiting for the FED to blow more tailwind into the Golden sails.”

Dow Jones Industrial Average Possible outlook Week 38 ATHAre we ready for the new All Time High? US30 possibly aiming to correct during the early days of the week prior the anticipated bullish run.

Gold Outlook – Short-Term Pullback, Long-Term Strength📑 Gold (XAUUSD) – Market Report
Gold has shown a strong bullish phase over recent weeks after a long consolidation. The market moved from accumulation into expansion, reflecting renewed participation by larger players. This upward momentum indicates strong capital inflows, supported by macroeconomic uncertainty and shifting investor sentiment.
Technically, price has broken out of a prolonged range and established a clear upward trajectory. Market structure suggests that buyers remain in control, though current price levels are showing signs of potential exhaustion, which could trigger short-term corrective moves before the broader trend resumes.
Fundamentally, global economic pressures continue to boost gold’s role as a safe-haven asset. Concerns over inflation, central bank policy adjustments, and currency volatility are keeping investor demand elevated. With global risk sentiment fluctuating, gold is likely to remain an attractive hedge, sustaining its medium-term bullish outlook despite short-term pullbacks.
Conclusion: Gold is in an expansion cycle, supported by both technical momentum and fundamental demand. Short-term corrections are expected, but the broader trajectory remains upward.

USDJPYas i live in japan but not much as i trade on this pair, here is what i see potentional move aftre brinking the resistent or support, can catch up the trend follow.
the line may make youu clear image, this analysis is base on weekly frame to 4H
weekly low.
weekly high
leave your comment or any qustion in the comment.

XAUUSD | FED leaning toward 50bps cut? |Buy strategy at support XAU/USD – 12/09 | Captain Vincent ⚓
🔎 Captain’s Log – News Context
Probability of a -50bps FED cut next week has risen to 10.9% (from 8%), while the -25bps scenario remains almost certain.
US Jobless Claims surged unexpectedly → reflecting labor market weakness, reinforcing expectations of FED easing.
Tonight (21:00): release of University of Michigan Sentiment & Inflation Expectations (1Y–5Y) – data that could further impact the Dollar.
⏩ Captain’s Summary : Dollar weakness + declining bond yields = Gold remains supported to the upside. However, short-term corrections may appear before breaking higher.
📈 Captain’s Chart – Technical Analysis
Storm Breaker (Resistance / Sell Zone) :
Weak High: 3675 – 3677 (psychological barrier)
Peak Zone: 3676 – 3680 (retest highs, possible short-term reversal)
Golden Harbor (Support / Buy Zone) :
OB Dock: 3636 – 3638
Deep Harbor: 3621 – 3623
Market Structure :
On H1, Gold has created multiple BoS and formed Equal Highs (EqH) around 3645 – 3650.
An FVG appeared → signal that liquidity gap may need filling before continuation.
Preferred scenario: pullback to 3636 or deeper 3621 , then rebound toward 3675 – 3680.
Break above 3680 → potential expansion toward a new ATH above 3700 .
🎯 Captain’s Map – Trade Plan
✅ Buy (priority with trend)
Buy OB: 3636 – 3638 | SL: 3628 | TP: 3645 – 3655 – 3665 – 3675 – 36xx
Deep Buy Zone: 3621 – 3623 | SL: 3612 | TP: 3640 – 3655 – 3665 – 3675 – 368x
⚡ Sell (short scalp at resistance)
Sell Zone: 3675 – 3677 | SL: 3684 | TP: 3665 – 3655 – 3645 – 36xx
⚓ Captain’s Note
“The dovish wind from the FED continues to carry the Golden sails forward. Golden Harbor 🏝️ (3636 – 3621) is the safe dock for sailors to gather strength before the next voyage. Storm Breaker 🌊 (3675 – 3680) may raise strong waves for short Quick Boarding 🚤 , but the main journey still points north. If 3680 is broken, the Golden ship will expand its voyage toward new peaks above 3700.”
