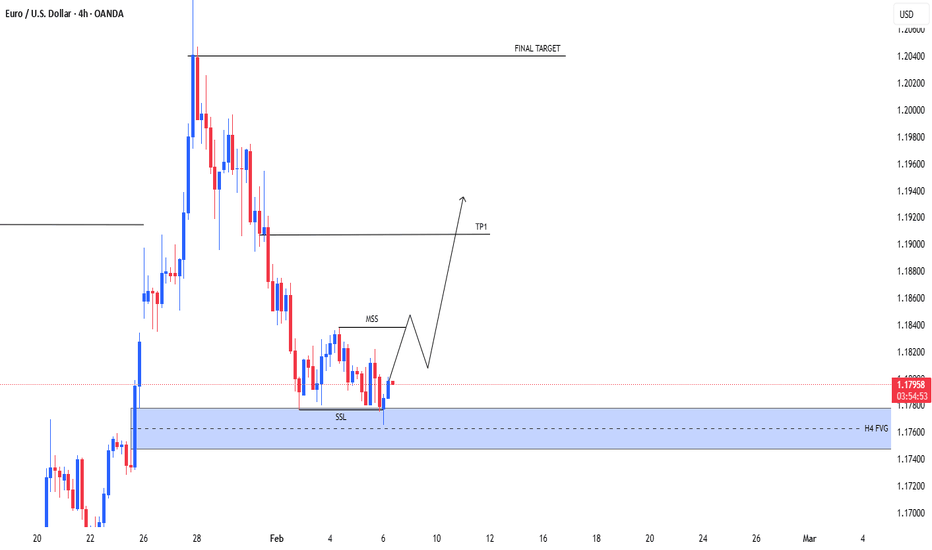
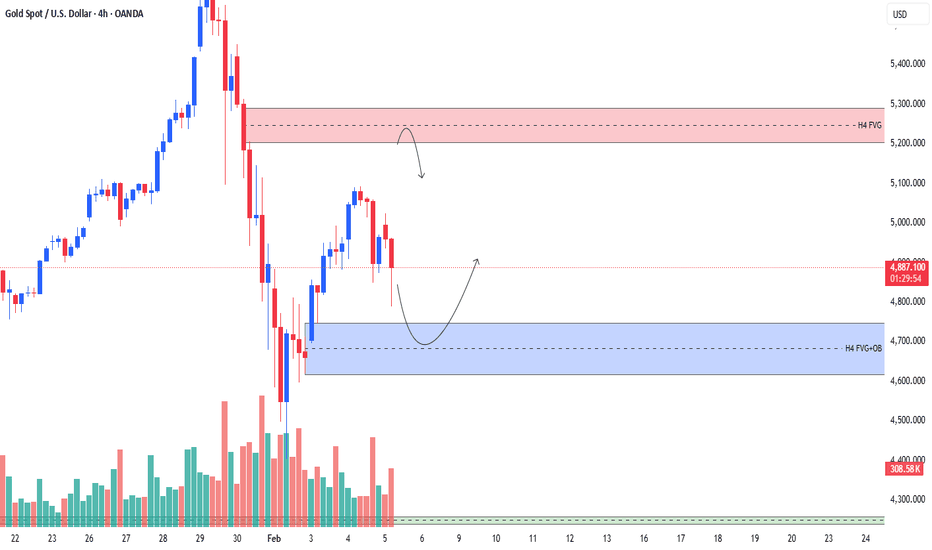
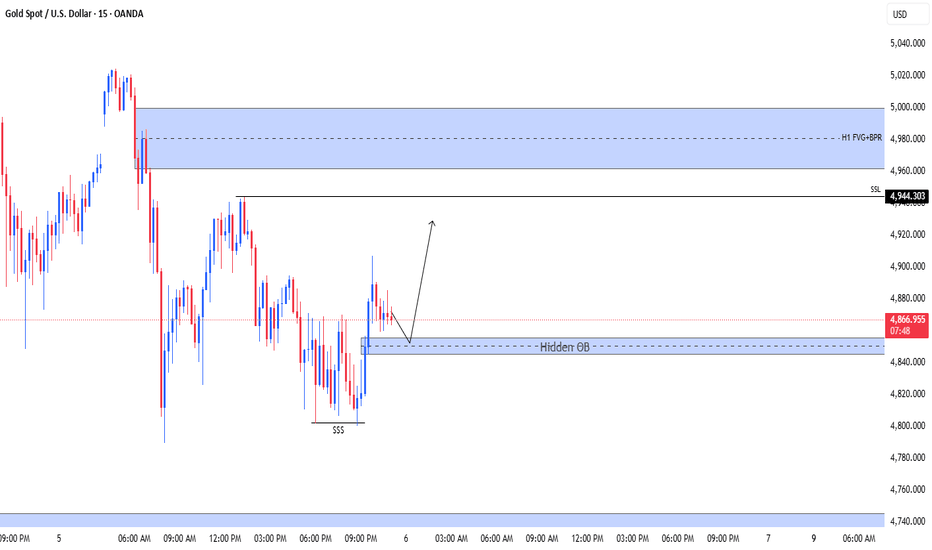
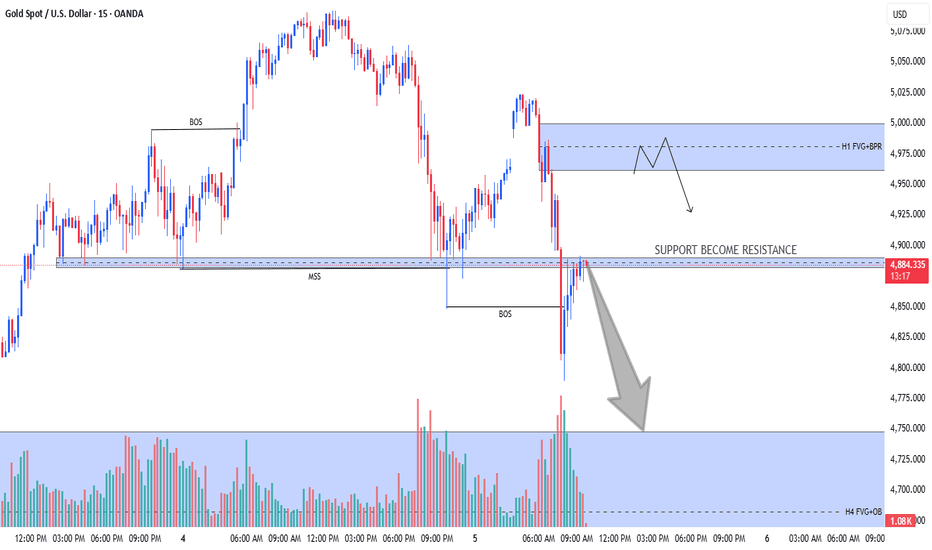
technical analysis of your provided XAU/USD (GoldTimeframe: 15 minutes
Current Price: $3,963.81
Trend Structure: Price recently broke out from a descending channel.
Key Levels:
Support Zone: $3,920 – $3,940
Immediate Resistance: $3,980
Target Zone: $4,142
📉 Technical Breakdown
Descending Channel Breakout
The chart shows gold had been moving in a clear downward channel.
The recent candles show attempts to break above the upper trendline, suggesting potential bullish momentum building up.
Support Level
A strong demand zone is visible around $3,920 – $3,940.
This zone has been marked as a possible retest area before continuation to the upside.
Price Projection
The chart projects a bullish scenario, where price may retrace slightly to support before targeting the $4,142.60 level.
This suggests a swing-buy setup, with confirmation depending on a strong bounce from the support level.
Market Structure
The formation of higher lows near the lower boundary of the channel signals momentum reversal.
A confirmed breakout with volume above $3,980 will lik TVC:GR10Y TVC:GR02Y EURONEXT:PSI1! EURONEXT:EV6X2025 EURONEXT:GE8Z2025 EURONEXT:PO6X2025 ely validate the bullish continuation.
🎯 Trading Plan Suggestion (Analytical View)
Buy Zone: $3,940 – $3,950 (after confirmation candle)
Take Profit Target: $4,142
Stop Loss: Below $3,915 (to protect against false breakout)
⚠️ Notes
Watch for price rejection near $3,980, as it could form temporary consolidation. EURONEXT:PO6X2025 EURONEXT:SNAX2025 EURONEXT:EV8Z2025 EURONEXT:PSI1! EURONEXT:XA8Z2025 EURONEXT:XA6X2025 EURONEXT:PO8Z2025
If price closes below $3,920, bearish momentum may resume.
Foryourpage
GOLD (XAU/USD) – 15-Minute Chart AnalysisCurrent Price: 4006.53
Trend: Short-term bearish
🔍 Chart Breakdown
The price is moving within a descending channel, indicating a continuation of the bearish momentum.
There is a key resistance zone around 4035–4060, highlighted in the shaded area. This zone aligns with previous structure and upper trendline resistance.
The market is currently making a minor pullback toward this resistance area after touching the lower boundary of the descending channel.
📉 Expected Move
The purple projection suggests a pullback to the resistance zone, followed by a strong rejection downward.
The target level is set around 3920.72, which corresponds to a previous swing low and a possible completion of the bearish wave.
⚙️ Trading Outlook
Direction Entry Zone Stop Loss Take Profit Confirmation
Sell 4035–4060 4075 3920 Rejection candle or bearish engulfing at resistance
📊 Summary
Gold remains in a short-term downtrend, and the best opportunity is to wait for price to test resistance (4035–4060) before considering short positions targeting 3920.
A breakout above 4075 would invalidate this bearish setup and could signal a potential trend reversal. LME:CA1! LME:MC1! LME:SN1! LME:LH1! LME:SC1! LME:AH1! LME:CO1! LME:ZS1! LME:PB1! LME:HC1! LME:AA1! LME:EA1! LME:ST1! LME:AN1! LME:AW1!
XAU/USD: Channel Breakout → Retest → Downside Target at 3,940EURONEXT:FTI1! EURONEXT:FTI1! EURONEXT:VU8F2026 EURONEXT:VM81! EURONEXT:VV6X2025 EURONEXT:V26X2025 EURONEXT:NS8Z2025 EURONEXT:YG8F2026 Pair: Gold Spot (XAU/USD)
Timeframe: 1-hour
Current Price: 4,253.975
Trend: Recently broke out of an ascending channel (bearish signal)
📉 Chart Breakdown
1. Ascending Channel (Trade Lines)
Price was moving steadily inside a rising channel, indicated by the two parallel yellow “TRADE LINE” levels.
The break below the lower trade line suggests weakening bullish momentum and potential trend reversal.
2. Resistance Level (4,320 – 4,360 zone)
Marked in purple, this zone served as a key resistance.
Price rejected strongly from this area, confirming seller presence.
3. Structure Retest and Potential Move
After the channel break, price retraced back to retest the broken channel support (now resistance).
The projected blue path shows a lower-high formation followed by a new drop, completing a bearish continuation pattern.
4. Target Zone
The projected target is near 3,940.693, aligning with previous structure support.
This level could serve as a profit-taking area for short positions.
📊 Summary of Key Levels
Zone Type Range / Level
4,320 – 4,360 Resistance Strong supply zone
4,220 – 4,240 Retest zone Potential short entry area
3,940 Target Bearish target / demand zone
⚙️ Trading Plan Concept (Hypothetical)
Bias: Bearish
Entry Idea: Wait for rejection from 4,220–4,240 zone.
Stop Loss: Above 4,280 (resistance)
Take Profit: Around 3,940 (target)
Risk/Reward: Approximately 1:3 or better
🧭 Conclusion
The chart suggests that Gold (XAU/USD) might be entering a corrective bearish phase after failing to sustain its bullish channel. A retest of broken structure before another drop aligns with typical market structure behavior.
XAU/ USD Bullish trend analysis Read The captionSMC Trading point update
-
Technical analysis of XAU/USD (Gold Spot)
Timeframe: 1H (OANDA)
Technical Basis: Smart Money Concepts (SMC) + EMA Confluence
---
Market Structure
Current trend: Bearish, price respecting a descending wedge/channel.
Recent Break of Structure (BOS) confirms bearish momentum continuation.
Price is retracing after forming a new low and may move back to mitigate imbalance (FVG).
---
Key Technical Areas
Retracement Levels:
0.5 – 0.79 Fibonacci zone marks the premium shorting area.
Fair Value Gap (FVG) zone between 0.62–0.79 levels is the ideal entry region.
EMA Resistance:
EMA-50 ≈ 4,067
EMA-200 ≈ 4,120
Both EMAs align with the supply zone, strengthening sell bias.
---
Projected Move
1. Expected retracement toward the 4,067–4,100 zone (supply/FVG region).
2. Potential short entry within that area.
3. Bearish continuation targeting the next structural low at 3,960 (as marked).
---
Targets
Next Target (retracement zone): 4,089
Final Bearish Target: 3,960
Mr SMC Trading point
---
Summary
Gold remains under bearish pressure within a contracting structure. A retracement to the premium zone (4,067–4,100) offers potential short opportunities aligned with structure and EMA resistance. A break below 3,995 would further confirm bearish continuation toward 3,960.
---
Pelas support boost 🚀 this analysis
XAU/USD Bullish trend analysis Read The captionSMC Trading point update
Technical analysis of XAU/USD – Bullish Continuation Setup (1H Chart)
Technical Overview:
Instrument: Gold Spot (XAU/USD)
Timeframe: 1 Hour
Current Price: $4,114
Next Target: $4,220
---
Chart Breakdown:
1. Demand Zone (Blue Box):
The price has respected a key bullish order block / demand zone between $4,040 – $4,080, showing strong buyer reaction (green arrows).
2. Ascending Trendline Support:
Multiple rejections from the ascending trendline confirm higher lows, signaling ongoing accumulation from buyers.
3. Fibonacci Retracement:
The market retraced around the 0.618 – 0.786 Fibonacci levels — a strong buy zone for continuation setups.
4. Moving Averages (EMA 50 & EMA 200):
EMA 50 (Blue) is trying to cross above the EMA 200 (Black), hinting at a possible bullish crossover.
A successful break above both EMAs would confirm bullish momentum.
5. Bullish Flag / Wedge Pattern:
The structure shows a bullish flag/wedge forming after an impulsive upward move — indicating potential for another breakout rally.
---
Trade Idea:
Buy Zone: $4,070 – $4,100
Target 1: $4,160
Target 2: $4,220 (main target on chart)
Invalidation (Stop Loss): Below $4,030
Mr SMC Trading point
---
Market Bias:
Bullish Bias – As long as the price holds above the highlighted demand zone and the ascending trendline, buyers remain in control. A breakout above recent highs will confirm momentum toward the next target.
---
Pelas support boost 🚀 this analysis
technical analysis for your ETH/USD chart:Pair: Ethereum / U.S. Dollar (ETH/USD)
Current Price: around $3,931
Structure: Rising channel pattern
Key Zones:
Support Level: $3,850 – $3,880
Target Level: $4,120.70
📊 Technical Analysis
Trend Structure:
ETH/USD is currently trading within an ascending channel, reflecting a short-term bullish structure.
Price is consolidating just above the midline of the channel, suggesting a potential retracement before the next bullish leg.
Support Area Reaction:
The support level near $3,850 – $3,880 aligns with the lower channel boundary.
A possible pullback into this zone could act as a liquidity grab before a bullish continuation.
Bullish Scenario (Primary Expectation):
If price retests and holds above the support level, expect a rebound toward $4,120.
Confirmation: Bullish candlestick pattern or breakout above the local resistance around $3,970.
Bearish Scenario (Alternative):
A confirmed break below $3,850 could invalidate the bullish setup.
In that case, ETH could extend lower toward $3,780 – $3,750 support area.
⚙️ Trading Plan (Summary)
Direction Entry Zone Stop-Loss Target
🔺 Long (Buy) 3,850 – 3,880 Below 3,820 4,120
🔻 Short (Sell – only if breakdown) Below 3,850 Above 3,900 3,750
🧩 Technical Indicators (Implied)
Trend: Bullish structure intact within ascending channel.
Momentum: Neutral–bullish (possible short-term retracement).
Market Sentiment: Buyers maintaining control unless $3,850 breaks. NASDAQ:TSLA NASDAQ:NVDA NASDAQ:AMD NASDAQ:PLTR NASDAQ:META NASDAQ:MSFT NASDAQ:NFLX NASDAQ:INTC NASDAQ:BYND NASDAQ:MSTR
technical analysis for your BTC/USD chart:Pair: Bitcoin / U.S. Dollar (BTC/USD)
Current Price: around $111,628
Structure: Ascending channel pattern
Key Zones:
Resistance Level: $112,000 – $112,500
Target Level (Support): $106,572
📊 Technical Analysis
Trend Structure:
BTC/USD is moving within a rising channel, showing short-term bullish momentum.
Price is now approaching the upper boundary of the channel and a major resistance zone ($112,000–$112,500).
Resistance Reaction Expected:
This zone has previously rejected price, so sellers may re-enter around this region.
If price fails to break above the resistance, a bearish correction is likely.
Bearish Scenario (Primary Expectation):
A potential reversal from resistance is indicated on your chart.
Confirmation: A strong bearish candle or break below the midline of the channel.
Downside target: around $106,572, aligning with previous demand/support and the lower boundary of the broader channel.
Bullish Scenario (Alternative):
If BTC/USD breaks above $112,500 with volume, price could extend toward $113,500–$114,000 before any correction.
⚙️ Trading Plan (Summary)
Direction Entry Zone Stop-Loss Target
🔻 Short (Sell) 112,000 – 112,500 Above 113,000 106,600
🔺 Long (Breakout) Above 112,500 (confirmed) Below 111,800 113,500 – 114,000
🧩 Technical Indicators (Implied)
Trend Channel: Uptrend but nearing exhaustion.
Volume: Likely decreasing as price nears resistance (sign of weakening momentum).
Market Sentiment: Short-term bullish → potential reversal zone ahead. RUS:SBER RUS:VTBR RUS:LKOH RUS:ROSN RUS:MOEX RUS:PLZL RUS:T RUS:NVTK RUS:AFLT RUS:SMLT
technical analysis of your chart for USD/CAD (15-minute timeframThe pair is moving within an ascending channel, indicating short-term bullish momentum.
Higher highs and higher lows confirm the ongoing uptrend structure.
🟦 Key Zone
Support Level: 1.3985 – 1.3990
This shaded zone represents a demand area where price previously found strong buying interest.
As long as this level holds, the short-term bullish bias remains valid.
🔹 Price Action Outlook
Price is currently testing the lower trendline of the channel and near the support zone.
A bullish reaction from this level could trigger a bounce toward the mid-channel and potentially the upper resistance.
🎯 Target
Upside Target: 1.4039
This corresponds to the upper boundary of the channel and a previous swing high area.
⚠️ Invalidation / Risk Level
A break below 1.3980 would invalidate the bullish setup and could lead to a bearish correction toward 1.3965 or lower.
📈 Trading Signal (Summary)
Bias: Bullish (short-term)
Entry Zone: 1.3985 – 1.3995 (support area)
Target: 1.4039
Stop-Loss: Below 1.3980 ICMARKETS:EURUSD ICMARKETS:GBPUSD ICMARKETS:USDJPY ICMARKETS:GBPJPY ICMARKETS:AUDUSD ICMARKETS:USDCAD ICMARKETS:USDCHF ICMARKETS:NZDUSD ICMARKETS:EURJPY ICMARKETS:EURJPY ICMARKETS:AUDJPY ICMARKETS:EURGBP ICMARKETS:GBPAUD ICMARKETS:USDZAR ICMARKETS:USDDKK
XAU/USD – Bearish Setup at Key Resistance (4,360–4,380 Zone)Current Price: 4,347.85
Market Structure:
Price is currently testing a strong resistance zone around 4,360 – 4,380.
Previous attempts to break this area resulted in sharp rejections to the downside.
The chart suggests a potential double-top formation developing near the resistance level.
📉 Bearish Scenario (Sell Setup)
Sell Zone: 4,360 – 4,380
Direction: 🔴 SELL
Target: 🎯 4,221.50
Stop Loss: 🔻 Above 4,390
📊 Technical Rationale:
The resistance zone has been tested multiple times, showing strong selling pressure.
A rejection from this level could trigger a short-term correction toward the 4,221 target.
Confirmation of the move will occur if price breaks below the recent local low near 4,300, validating the double-top structure.
⚠️ Invalidation:
A 1H candle close above 4,390 would invalidate the bearish setup and may open the way toward 4,420+.
✅ Summary:
Watch for a rejection pattern (such as a bearish engulfing or pin bar) in the 4,360–4,380 zone.
A confirmed rejection provides a short opportunity toward 4,221 with a favorable risk–reward ratio. CME_MINI:NQ1! CME_MINI:ES1! CME_MINI:MNQ1! COMEX:GC1! CBOT_MINI:YM1! COMEX_MINI:MGC1! NYMEX:CL1! COMEX:SI1! CME:BTC1! CBOT_MINI:MYM1!
Gold (XAU/USD) – Bullish Rebound Expected from Key Support ZoneTechnical Structure
Uptrend Confirmation: Despite the pullback, the overall structure remains bullish — higher highs and higher lows are intact.
Support Zone (Green Box): The area between 4,132 – 4,197 acts as a strong demand region where a reversal is likely.
Target Point: The upside target lies near $4,378 – $4,381, coinciding with previous highs and resistance.
📈 Bullish Scenario
If price tests the support level and shows rejection (bullish candles or wicks), we can expect:
Entry: Around $4,160 – $4,200
Target: $4,380 – $4,381
Stop Loss: Below $4,120
This would confirm a continuation of the uptrend after a healthy correction.
📉 Bearish Scenario
If price breaks below $4,120, it could trigger:
Deeper correction toward $4,060 – $4,000
Momentum shift from bullish to short-term bearish.
🟢 Signal Summary
Direction Entry Zone Stop Loss Take Profit Confidence
BUY (Long) $4,160 – $4,200 $4,120 $4,380 ⭐⭐⭐⭐ (Strong if support holds)
⚠️ Conclusion
Gold is showing signs of retracement within an uptrend.
If the support zone holds, we can expect a bullish reversal toward the $4,380 target point.
However, a break below $4,120 will signal a deeper correction before any new rally.
XAU/USD) Bullish trend analysis Read The captionSMC Trading point update
Technical analysis of XAU/USD (Gold), 4H timeframe — here’s the detailed breakdown 👇
---
Trade Idea: Bullish Continuation Setup — XAU/USD
Market Context
Gold has been in a strong uptrend, forming higher highs and higher lows.
Price has recently broken above the previous resistance zone, signaling bullish continuation.
---
Key Technical Points
1. FVG (Fair Value Gap) Zone
The chart highlights an FVG area around 4,060–4,080, which now acts as a potential retracement zone.
Smart money often drives price back into these imbalances to mitigate orders before continuing the move up.
2. Retest Opportunity
Expect a pullback into the FVG zone, followed by bullish confirmation (rejection candle or structure shift).
This creates a high-probability long entry zone aligned with the prevailing bullish order flow.
3. Key Support Level
The 3,940–3,970 zone below acts as a major support / demand area, reinforcing the overall bullish bias.
4. Target Point
The projected target point is around 4,250, based on the measured move from the FVG breakout structure.
This aligns with liquidity resting above previous highs — a likely take-profit zone for institutional traders.
---
Trade Plan
Entry: Wait for price to retrace and show bullish confirmation inside the 4,060–4,080 (FVG zone).
Stop Loss: Below 4,040 (beneath imbalance / last swing low).
Take Profit: 4,250 target zone — completion of the bullish leg.
---
Market Logic
This idea follows Smart Money flow principles:
Break of structure (BOS) confirms bullish control.
Retracement to FVG provides a discounted entry.
Target liquidity above prior highs for exit.
--- Mr SMC Trading point
Summary:
Gold remains in a strong bullish phase — look for retracement entries into the FVG for continuation toward 4,250.
Please support boost 🚀 this analysis
USD/CAD) Bullish trend analysis Read The captionSMC Trading point update
Technical analysis of USD/CAD Bullish Continuation Setup (4H Chart)
Technical Overview:
Instrument: U.S. Dollar / Canadian Dollar (USD/CAD)
Timeframe: 4-Hour
Current Price: ~1.4028
Bias: Bullish
---
Chart Breakdown:
1. Fair Value Gap (FVG) Zone – Demand Area (Yellow Box):
Price recently filled the FVG and respected the 1.3970–1.3990 support zone.
This zone acted as a bullish mitigation area, showing institutional buying interest.
2. Structure Shift:
After consolidating, USD/CAD broke above short-term highs, confirming a bullish market structure shift (MSS).
The ongoing pullback into the FVG area could serve as a retest entry point.
3. Target Point:
Projected target is around 1.4124, aligning with previous liquidity highs.
This move suggests a potential +100 pips upside from current levels.
4. Trade Plan:
Entry Zone: 1.3980 – 1.4000 (on FVG retest)
Target: 1.4124
Invalidation: Below 1.3950 (if structure fails and price re-enters deeper range)
Mr SMC Trading point
---
Trading Insight:
This setup reflects a Smart Money Concepts (SMC) bullish continuation pattern.
The market has broken structure to the upside and is likely to continue higher after a brief retracement into the fair value gap zone — targeting liquidity resting above 1.4124.
---
Please support boost 🚀 this analysis
BTC/USD) Bullish trend analysis Read The captionMr SMC Trading point update
---
Technical analysis of BTC/USDT Bullish Reversal Setup (4H Chart)
Technical Overview:
Instrument: Bitcoin / Tether (BTC/USDT)
Timeframe: 4-Hour
Current Price: ~$114,842
Bias: Bullish Continuation
---
Chart Breakdown:
1. Fair Value Gap (FVG) Break & Retest Zone (Yellow Box):
Price has broken above a key FVG zone, suggesting a shift in market structure from bearish to bullish.
The current consolidation above this area indicates that buyers are defending the zone.
2. Structure Shift:
The recent break of lower highs marks an internal bullish market structure shift (MSS).
Pullback to the FVG zone offers a potential entry point for longs.
3. Target Point:
The projected bullish move points toward the $126,088 area, which aligns with a prior supply zone / liquidity pool.
This target represents an approximate +10% upside potential from current levels.
4. Trade Scenario:
Entry Zone: Around $114,000 – $113,500 (retest of FVG).
Target: $126,000 area.
Invalidation: Below $112,000 (if price breaks back inside FVG).
Mr SMC Trading point
---
Trading Insight:
This setup aligns with a Smart Money Concepts (SMC) perspective — price filled imbalance, broke structure, and now may seek higher liquidity zones. A successful retest of the FVG could trigger a strong bullish continuation toward the marked target zone.
---
Please support boost 🚀 this analysis
USD/JPY) Bearish Trend analysis Read The captionSMC Trading point update
Technical analysis of USD/JPY (1H) chart shows a bearish SMC (Smart Money Concept) setup — here’s the idea breakdown
---
Trade Idea: Bearish Setup — USD/JPY
Market Context
Price has been in a strong bullish trend, reaching a local high near 152.35.
Recently, the price broke structure to the downside, signaling potential shift from bullish to bearish order flow.
---
Key Technical Points
1. FVG (Fair Value Gap) Break
The chart marks an FVG break zone around 152.30–152.45.
This zone acts as a premium re-entry area where institutional traders may rebalance orders before pushing price lower.
2. Rejection Zone (Supply Area)
Price is currently retracing back into the FVG zone, forming potential lower-high structure.
Expect rejection confirmation (bearish candle / liquidity sweep) before continuation down.
3. Bearish Continuation Expectation
After the retest, price is projected to drop toward the lower demand zone / target point around 150.25.
That area aligns with previous demand / liquidity pool, a likely point for profit-taking or reversal.
---
Trade Plan
Entry: Wait for bearish rejection or liquidity sweep inside the 152.30–152.45 zone.
Stop Loss: Above 152.50 (above FVG high).
Take Profit: Around 150.25 target zone (major demand area).
Mr SMC Trading point
---
Market Logic
The structure shows:
Break of structure (BOS) confirming bearish shift.
Fair Value Gap retest for premium entry.
Liquidity targeting at the lower demand zone.
This setup follows institutional flow — sell after retracement, target imbalance fill.
---
Please support boost 🚀 this analysis
XAU/USD) – Bullish Channel Continuation with Key Support at $3,9The price is moving within an ascending parallel channel, showing an overall bullish trend.
Currently, gold is trading near $3,996, close to the 70 EMA ($3,991).
A support zone is marked around $3,919–$3,950, which has held price action several times.
🔹 Key Levels
Support zone: $3,919 – $3,950
Immediate resistance: Around $4,000 (psychological level + EMA area)
Target point: $4,065
Loss point (Stop-loss): Below $3,919
🔸 Technical Outlook
Trend Direction:
The upward channel and higher highs indicate continuation of the bullish trend unless price closes below $3,919.
Short-term Movement Expectation:
Price might retest the support zone ($3,950–$3,920).
If support holds, an upward bounce toward $4,065 is likely.
If it breaks below $3,919 with volume, price may fall toward $3,870–$3,850 (lower channel line).
EMA Behavior:
The 70 EMA is currently acting as dynamic support; staying above it keeps the bullish momentum intact.
🎯 Trading Plan Suggestion (Technical Only)
Buy zone: $3,940–$3,960
Take profit: $4,060–$4,070
Stop loss: Below $3,915
XAU/USD) Bullish trend analysis Read The captionSMC Trading point update
Technical analysis of XAU/USD (15m timeframe) chart analysis:
---
Bullish Gold Setup
Chart Pattern: Price broke out of a triangle consolidation after retesting the order block (OB, yellow zone). This signals accumulation before continuation.
Order Block (OB): The zone around 3,836 – 3,840 acted as a strong demand area. Price respected it and bounced back.
EMA Support:
50 EMA (red) is sitting just above the OB, providing short-term support.
200 EMA (blue) is trending upward, confirming underlying bullish bias.
Projection: The breakout is expected to expand higher toward the measured move target.
---
Target Point
3,883.44 is the projected upside target.
This aligns with the breakout projection and prior liquidity grab zone.
Mr SMC Trading point
Trading Idea
Bias: Bullish.
Entry Zone: Pullback toward 3,836 – 3,840 OB for confirmation.
Target: 3,883.
Invalidation: A breakdown below 3,816 (200 EMA) would invalidate the bullish setup and suggest deeper retracement.
Please support boost 🚀 this analysis
(XAU/USD) Daily Analysis – Bullish Continuation Setup Toward $4,(Gold Daily - as of Sep 30, 2025)
Current Price: ~$3,851.68
Trend: Strong uptrend with price following a rising channel
Timeframe: Daily candles
Tool Used: TradingView
🧩 Key Chart Elements
Support Level Buy Zone (Blue Box)
Range: $3,459.10 – $3,625.44
This is the planned re-entry/buy zone.
Coincides with a previous resistance zone turned support, and the lower bound of the channel.
Trade Entry Point
Suggested entry near $3,625.44
Aligned with the lower edge of the blue support zone.
Stop Loss
Placed slightly below the blue zone at $3,459.10
This protects against a breakdown from the channel and invalidation of the setup.
Price Action Forecast (Pink Line)
Expectation of a short-term pullback into the buy zone.
Followed by a strong bullish continuation toward the target.
Target Point
$4,452.425 marked as the LABA TARGET POINT
Suggests a long-term upside potential of around +17% from current price levels.
Trend Channel
Price is respecting an upward sloping parallel channel.
This provides structure and validation for the projected bullish move.
📈 Strategy Summary
Element Value
Buy Zone $3,459 – $3,625
Target $4,452
Stop Loss ~$3,459
Risk/Reward Favorable
Trend Bullish
🔍 Final Thoughts
This is a momentum-based trend-following strategy:
Wait for a retracement into the support zone.
Look for bullish reversal confirmation (e.g. bullish engulfing, RSI bounce, etc.).
Enter long with stop just below the zone.
Hold for the move toward ~$4,450.
BTC/USDT Bearish Trend analysis Read The captionSMC Trading point update
Technical analysis of BTC/USDT (4H timeframe) chart analysis:
---
Bearish Bitcoin Setup
Trend: The market is clearly in a downtrend, with price respecting the descending channel.
Fair Value Gaps (FVG): Two FVG zones are highlighted where price retraced to fill imbalances.
Moving Averages:
50 EMA (red) and 200 EMA (blue) are above price, confirming bearish momentum.
Key Resistance: Price is currently retesting the FVG supply zone around 111,000 – 111,500, which aligns with the descending trendline.
Rejection Expected: If sellers defend this zone, price is likely to continue its bearish trajectory.
---
Target Point
A measured move suggests a potential drop towards 106,218 (next support / target zone).
This aligns with the channel’s lower boundary.
.
Mr SMC Trading point
---
Trading Idea
Bias: Bearish.
Entry Zone: Around 111,000 – 111,500 (FVG supply & trendline confluence).
Target: 106,218.
Invalidation: A breakout above 113,000 (200 EMA) would weaken the bearish setup.
---
Please support boost 🚀 this analysis
USD/ CAD) Bullish Analysis Read The captionSMC Trading point update
Technical analysis of USD/CAD (1H timeframe) chart analysis:
---
Bullish USD/CAD Setup
Support Zone: Price is respecting the support level (yellow box around 1.3920 – 1.3930).
Moving Averages:
50 EMA (red) is below current price, providing short-term bullish support.
200 EMA (blue) is also trending upward, confirming overall bullish bias.
Market Structure: Higher highs and higher lows suggest continuation to the upside.
Projection: Price is expected to bounce from the support zone and push toward the next resistance/target.
---
Target Point
1.3998 (near 1.4000 psychological level).
This aligns with the measured move projection from the last impulsive rally.
Mr SMC Trading point
---
Trading Idea
Bias: Bullish.
Entry Zone: Around 1.3920 – 1.3930 (support level retest).
Target: 1.3998.
Invalidation: A sustained break below 1.3900 would invalidate the bullish scenario.
---
Please support boost 🚀 this analysis
XAU/USD Bullish trend analysis Read The captionSMC Trading point update
Technical analysis of XAU/USD Bullish Channel Setup (4H Timeframe)
---
Chart Summary:
Pair: Gold Spot (XAU/USD)
Timeframe: 4H
Exchange: OANDA
Current Price: $3,759.85
EMA 50: $3,718.68 (short-term support)
EMA 200: $3,576.42 (major support)
---
Key Elements in Chart:
1. Ascending Channel Formation
Price is moving inside a clear rising channel (higher highs & higher lows).
Upper and lower boundaries are acting as dynamic resistance & support.
2. Support Levels (Yellow Zones)
$3,720–3,740 zone: strong support with EMA 50 confluence.
$3,600–3,620 zone: deeper support, aligned with EMA 200.
3. Breakout & Retest
Price broke a short-term descending trendline, signaling bullish continuation.
Retest of support level confirms buyers are active.
4. Bullish Projection
Based on measured move (previous impulse), projection suggests a rally towards $3,877.07 (target point).
Mr SMC Trading point
---
Conclusion:
The chart signals a bullish continuation inside the ascending channel.
Bullish Scenario: Holding above the $3,720–3,740 support zone, price is expected to rally toward the $3,877 target.
Invalidation: A 4H close below $3,718 (EMA 50) could open a deeper correction toward the $3,600 support (EMA 200).
---
Pelas support boost 🚀 this analysis
USD/JPY) Bearish Trend analysis Read The captionSMC Trading point update
Technical analysis of USD/JPY (1H timeframe) chart analysis:
---
Bearish USD/JPY Setup
Rejection at Resistance: Multiple rejections (red arrows) show strong selling pressure around 149.70 – 149.80 zone.
Fair Value Gap (FVG): Price may retest the FVG supply area before continuing lower.
Moving Averages:
50 EMA (red) is turning flat, showing short-term weakness.
200 EMA (blue) is below, acting as the larger support zone.
Market Structure Shift (MSS): Breakdown of recent support suggests bearish intent.
---
Target Point
Expected drop towards 148.38 – 148.37 (aligned with 200 EMA & previous demand zone).
Mr SMC Trading point
---
Trading Idea
Bias: Bearish.
Entry Zone: Retest of 149.60 – 149.70 (FVG).
Target: 148.38.
Invalidation: A break above 150.00 would invalidate the bearish outlook.
Please support boost 🚀 this analysis
BTCUSD – Healthy Correction Before the Next Rally?Hi everyone, Ken here!
Technically, BTCUSD is trading within a clearly defined ascending channel, with a bullish rhythm that’s hard to overlook. The recent retracement reflects a healthy correction, potentially setting the stage for the next upward move.
Price is now approaching a key support zone, marked by the lower boundary of the channel and a prior demand area. If this level holds, it could provide buyers with a strong re-entry opportunity. The next upside target is around 118,600, aligning with the channel’s upper boundary.
Of course, momentum may not appear right away — the market could consolidate, produce false breakdowns, or even accelerate sharply without much warning.
Bottom line: The uptrend remains in control. This pullback looks more like a step back to gather strength than a signal of reversal.
Good luck and happy trading!
XAU/USD technical analysis Read The captionSMC Trading point update
Technical of Gold (XAU/USD) using the 4H timeframe. Let’s break down the idea behind it:
---
Key Technical Insights:
1. H4 FVG (Fair Value Gap) Zone:
The yellow box (~3602 zone) is marked as an imbalance area (FVG) where price is likely to retrace.
Market structure suggests that price may dip into this zone to fill the imbalance before continuing upward.
2. Price Pattern (Consolidation / Pennant):
Current price action shows a triangle/pennant-like consolidation after a strong bullish move.
This usually indicates continuation, but first, liquidity grabs may occur.
3. Liquidity Grab (Liquidity $$$):
The chart notes a liquidity sweep above resistance (~3659).
This suggests that price could fake out higher first, then drop to fill the FVG zone before resuming the bullish move.
4. Target Points:
Short-term downside target: 3602.487 (H4 FVG support).
Upside target 1: 3659.154 (liquidity area).
Upside target 2: 3699.778 (main bullish target).
5. RSI (Relative Strength Index):
Currently around 57–60, showing moderate bullish momentum but not overbought.
Supports the idea of a retracement before continuation.
---
Trade Idea Summary:
Bias: Bullish (after retracement)
Scenario:
1. Price may first grab liquidity (fake-out up) or directly retrace down.
2. Dip into the 3602 FVG zone.
3. Strong bounce expected → rally toward 3659 and 3699 targets.
Entry Idea: Look for long entries near 3602–3610 zone (confirmation with bullish candle patterns preferred).
Targets:
TP1: 3659
TP2: 3699
Stop-Loss: Below the FVG zone (~3580).
Mr SMC Trading point
---
Conclusion:
This is a bullish continuation setup where Gold could correct down into the H4 FVG zone before resuming its larger uptrend. The plan focuses on buying dips rather than chasing highs.
---
Please support boost 🚀 this analysis