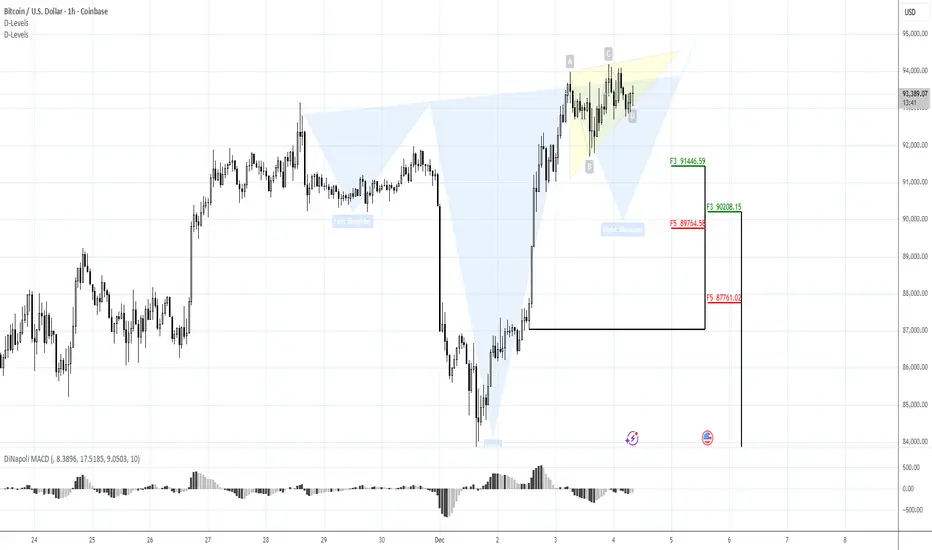
BTC KEY TO DIRECTIONMorning folks,
As we said last time, the bearish scenario is not off the table. In fact, market now stands in a big triangle which is the key. BTC now is challenging 90K support. If it will be broken, the next is the last one around 88K. Downside breakout will open road to 75-78K lows again.
Now I do not see any good buying opportunities and prefer to watch for market reaction on major support levels.
FPA

BTC 97-98K is possibleMorning folks,
Just we talked about bearish signs last time, BTC immediately has shown upside bounce. But I'm hurry up to disappoint you that bearish context is not off the table yet, say on weekly chart.
BTC shows splashes every time when some liquidity is injected. We know what has happened on 31 December and 2nd of January. RRP activity by US Banks and 75+Bln from the Fed. Obviously some part appears on crypto market.
This makes us consider upside AB=CD and "222" Sell pattern with possible target around 97-98K area. At the same time, AB-CD shape doesn't let us to say that bearish tendency is broken. It might be just a local retracement.
For position taking I would keep an eye on 90K support area. If BTC will reach 98K - we will think what to do next. But, as it can collapse at any moment as it has shown previously, let's just see what will happen

BTC Looks Heavy...Happy New Year, Folks!
I hope you have a good time... so, BTC... looks heavy by my mind. Following to the swings structure it shows inability to return back to 94K area. First it was not able to proceed higher, showing too deep retracement. Now it stands flat under 90K.
On daily chart, with bullish MACD direction it starts reminding a bearish dynamic pressure, suggesting downside breakout. Besides, on weekly chart, consolidation is taking the shape of the pennant, which is also bearish.
Situation could change if BTC somehow will break above 91-92K area. In this case bearish pressure pattern will be cancelled. But right now, it seems that chances on re-testing of 80K lows look better. We do not consider any new longs by far.

Finger crossed for BTC 92.5K targetMorning folks, hopefully you've rest well.
Ok, BTC is started upward action, as we discussed, although not without adventures. Price action was very choppy on a think market. Now it seems, we have some impulse and hope that it will be enough at least until 92.5K target...
If you're interested with this setup, watch for 89.20K and 88.50K support levels to make a decision on entry. If BTC drops under 87.4K lows and erases the rally - deeper bearish action will happen. So, this fast short-term setup will be totally destroyed.
Take care,
S.

86-87K is still a BTC Red lineMerry Xmas, folks!
So, last time we said that signals are mixed but we could keep an eye on 86-87K support area. BTC will keep chances on upward action until it holds. And... it still holds.
Maybe this is just a result of a thin Xmas market, but BTC tries to form a reversal pattern here. Overall setup doesn't look fascinating, context is weak. But, at the same time, the cash risk is very small, dealing with this H&S pattern here. So, that's the only stuff that I want to share with you today.

BTC IS BALANCING. 91K Bounce is possible.Morning folks,
Last time we decided to stay aside until some signs of stabilization will appear. Now I can't say, that BTC picture looks inspiring but, with coming the new Fed QE tranche this week for ~7 Bln and thin pre-Xmas market, it quite possible to show the minor bounce at least.
I would consider ~91K as the target point against "C" point lows. If C point will be broken we get strong downside action. In some degree, BTC has no option but to start upside action to keep intraday bullish context.

"Wild card" BTC SignalsMorning folks,
So BTC collapsed as we suggested last week. Just based on its performance and inability to break 94K resistance. On weekly chart it looks like re-testing of 78-80K is on the table still. Downside triangle breakout is also not a best sign, including recent spike after market manipulations...
Now price remains at 5/8 FIb support and even small bullish grabbers are forming around. Personally I do not want to buy with such a background.
But, if you're ready to take this risk (which I'm not), this setup has some attractive moments. First is - close stop placement, low cash risk, just under the bottom. Second - a lot of uncertainty, with BoE, ECB and especially BoJ later, and yes, CPI... so, maybe somebody will tell or do something that push BTC higher. THat's why I call it as "Wild card" scenario. Do we have bullish background? No. Could BTC still jump occasionally? Yes. So, this is a headache for you today ;)
TAke care. S.

BOJ in FOCUS. BTC COULD RETURN TO 96-97KMorning folks,
So, our gut feeling has not failed us last time as we decided to stay aside from any new longs. This week is a poor job to guess what will happen on BoJ meeting, but it definitely will be important for all crypto currencies. Theoretically, narrowing of carry trade rates difference will make a bad service to BTC, as a most volatile asset...
Still, now we have a bullish grabbers on the daily chart. They look tempting. Especially because they do not demand far standing stops... I'm not confident with them at 100%, taking in consideration overall weak performance, but it is possible to risk and try them. If they will work BTC will return back to 96.4 - 97K area and finally complete our AB-CD target.
As an option, you could wait for 1-2 more sessions, as we have time until BoJ still. And we can wait for more confirmation on intraday charts. So, no need to hurry up by far...

BTC SHOWS WEAKNESSMorning folks,
Although BTC started well from 90K support area, mentioned last time, it has not reached 96.4K target, although tried to do it two times. Fed has not helped too much yesterday, and now obviously BTC shows signs of weakness.
If it goes bad way, we consider re-testing of 78-80K lows. But it is a bit early to talk about it. For now - let's just stay aside from any new longs and see what will happen.

BTC 87K LOWS ARE VITAL FOR THE BULLS NOWMorning folks,
So, the pullback that we discussed has happened, although it was a bit deeper - right to ~87.75-88K area, while we were talking about 89-90... anyway, the bounce up happened and currently this 87-87.5K is becoming critical for the bulls.
Downside breakout significantly will increase chances to return back to 80K. But at the same time, it means that it is easy to consider a long position. If you think about it - you can buy at some pullback against 87.5 lows.
If you already bought, think about moving stops to breakeven levels.
As our big upside AB=CD pattern is still valid, we keep intact our 96-97K target.

BTC 90K SEEMS INTERESTING FOR ENTRYMorning folks,
So, once our bearish trade was over, market turns to AB=CD upside shape, that we intend to follow. 97K is rather strong resistance, so we consider 96.5K as the nearest upside target. BTC shows nice acceleration, so, it has not bad chances to proceed.
For entry we intend to use reverse H&S shape on 1H chart. 90K area looks interesting now for potential long entry...
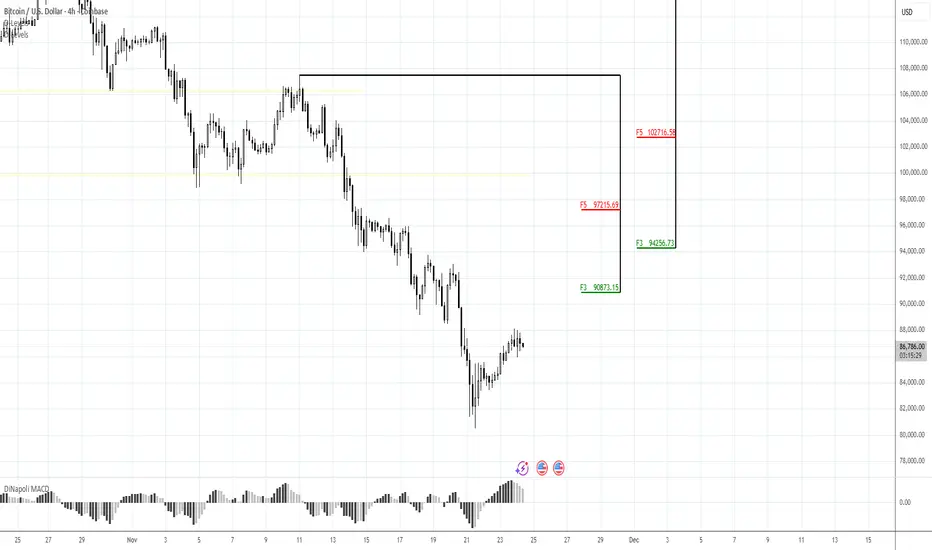
BTC - WATCHING FOR BULLISH HINTS AROUND 80KMorning folks,
So as we expected our downside trade from 91K is done perfect. Minimum target at 5/8 support is done. Whats next?
Market now is strongly oversold on Monthly and Weekly time frames. At least by technical reasons, it is a good chance to get solid upside bounce, at least to 104K, if we follow to idea of our weekly H&S pattern .
But, we need to wait a bit to get it clear. Hopefully it should be formed in 1-2 weeks, if our suggestion is correct. Right now we do not see worthy trading setups. Bearish action might continue as drop was fast, so BTC could stop not just at minimal target but to come closer to lows. For long entry we see no good setups as well.

WATCHING FOR BTC BEARISH MOMENTUM TRADESMorning folks,
As we said on Mon - we expect the bounce up to 91K area and here we are. Now, as daily downside momentum is rather strong, it is reasonably to suggest deep downside pullback, somewhere back to 84-85K area at least.
It could start either from 91K where we're now or 95K resistance. Chances are not bad. Since we're in the Holiday and coming to weekend, it is not needed to hurry up. Just sit on the hands and watch for signs. We need some bearish patterns around mentioned areas on intraday charts. Once we get it, we discuss bearish position taking.
Peace.

90-91K POTENTIALLY INTERESTING FOR SELL.Morning folks,
So, our DRPO "Buy" pattern has failed. This shows is how strongly market depressed, and here we see non-market driving factors. Now we suggest that the really big game is ready to start. On weekly chart 2/3 parts of H&S is already in place. And it will be quite interesting to see what will happen in nearest 2-3 months.
In short-term, market has completed our 79K target on daily chart of the same downside AB-CD pattern. BTC is oversold now on all time frames. At the same time, the price shape here is not bullish - too slow and choppy. It's just a technical bounce. So, we think that 90-91K resistance area might be interesting for potential short entry with the minimum target around 84K - downside momentum on daily chart is rather strong.
BOUNCE TO 98-100KMorning folks,
Last time we explained in details the fundamental background, so BTC remains bearish. But now it stands at weekly oversold and around 95K Daily support area. This creates friendly background for tactical bounce.
On 4H chart we have DiNapoli DRPO "Buy" pattern, that suggests upside bounce to 98-100K area at least.
That's being said, don't take any new shorts right now - wait for the pullback. For bullish intraday position, you could try to use this DRPO pattern. Don't place too far stop, just under lows should be enough, but be aware of NFP volatility today...

BTC 95K is DONE. WATCHING FOR 100K BounceMorning folks,
So, our plan worked perfect, BTC collapsed as we suggested. Now price is at oversold as on daily as on weekly TF and at support. So, it is reasonable to expect a tactical bounce, somewhere back to 100K. And it could start from a kind of reverse H&S on 1H Chart .
If it starts at all...
But it is not interesting... today we probably can't escape some fundamental analysis. I don't believe in occasional coincidence of stock market collapse right at the eve of Thanksgiving and Xmas and appearing of Epstein compromat on D. Trump. Meantime Donny is loosing all his allies - Musk, Carlson, Now M. Taylor Greene.
I wouldn't worry too much, if I would not see a big bearish signs on BTC, suggesting drop to 80K and even 50K in perspective. As you understand, this could happen only in a case of total collapse on stock market.
Buckle up and be prepared. No longs by far. Wait for mentioned pullback to consider a new shorts.
Take care, S.

#BTC 95-96K 3-DRIVE IS NOT EXCLUDEDMorning folks,
So, as we suggested BTC has shown healthy downside action out from 106K resistance area. Despite good news around shutdown, BTC shows limited reaction. Even more, I would say that 3-Drive pattern on daily chart is not excluded, down to 94-96K area.
This pattern fits well to idea of weekly H&S pattern ... On 4H in a few hours we could get a bearish grabber as well .
So, I wouldn't be too fast on long entry right now and prefer to wait for confirmation. It might be upside breakout of 108K area at least, just to erase all "bearish suspicions" around...
For short entry, if you want - try to catch the grabber or take position as close to 108K local top (and 2nd Drive top) as possible. This is invalidation point for bearish scenario.
Take care.
S.

WATCHING FOR CLOSE PRICE TODAYMorning folks,
So, pullback to 106K area has happened rather accurately. D. Trump once again has made a verbal intervention with promise of 2K and shutdown end, but this is too early to believe. As usual no one D. Trump promise has made a long lasted effect. All of them were reversed in a few days.
No Supreme Court decision yet on tariffs, now it is appeared that it will be not a 2K in cash but just tax adjustment, shutdown is still lasting and liquidity issues remain. So, I would say - it is too early to celebrate.
Meantime, on technical side we have clear signals. First is, if market will close today under 105.5K - we get daily bearish grabber. As you can see on 4H chart - it will appear right around strong resistance area. So, it might happen, that we will have to go short instead as market could drop again under 100K area...
Thus don't relax and don't believe in this suspicious euphoria, everything could change in a blink of an eye. Still, upward action above 108K could confirm the bullish sentiment.

106K Then 94K BTCMorning folks,
So, our suggestions were not in vain. As usual on a ruins of H&S we've got the butterfly and 105K lows has been broken. BTC could drop more, but now it is technically oversold.
We suggest upside bounce, at least to 106K resistance area where we consider another short entry attempt. Downside potential targets are 94-96K and then 80K if situation turns on worst scenario. But we will know it only by November close.

BTC - CHANCES ON COLLAPSE ARE RAISINGMorning folks,
So, BTC has failed to start upside action as with our 4H H&S as with 30-min H&S that we mentioned last time as a tool for long entry. The last one actually has not been formed at all. So, no entry signal followed.
Now, based on 4H picture, nominally we still could believe that H&S will survive and BTC still will reverse up. We do not argue, but... this might happen only by some external driver. It will be some wild card scenario, but we can't make a bet on it. Technical picture looks weak, and suggests price return back to 105K lows.
To return back to bullish view we need to get upside jump and confirmation of validity of this H&S pattern. In this case bullish scenario will be possible.
Now we prefer to stay aside from any bullish trades.

BTC HAS TO START UPSIDE ACTION ... OR IT DOESN'T START IT AT ALLMorning folks,
So, we've got a H&S that we suggested. Great. Besides, price is already at the right arm's bottom - its time to make a decision, whether you're in or not. Also we could use this small 30-min H&S to minimize the risk.
The logic is simple. Upside action has to start right from here, or it will not happen at all and BTC will fall back to 100K lows.
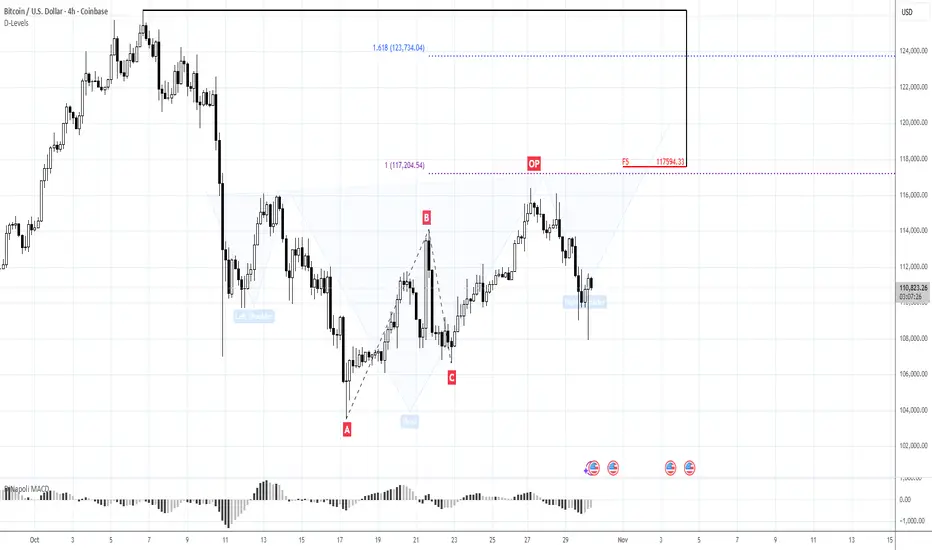
BTC - BACK TO H&S PATTERN AND 110.3-111.50K Morning folks,
In last two weeks we prefer to stay aside as market was forming contradictive signals, although we have a theory of mid term price shape. In a recent few sessions BTC starts looking more bullish, cancelled potential 3-Drive scenario and is returning back to the shape of H&S pattern.
Now price is completing AB=CD target and comes to 5/8 Fib resistance level, which is also the neckline of the pattern. Thus, if everything will go with the plan, 110.3-111.5K seems the first area where there right arm might be formed. So let's keep looking over it.

3-DRIVE INSTEAD OF H&S WITH 101-102K TARGETMorning folks,
Last time we acknowledged some BTC efforts to reverse up, but decided to wait for more confirmation and more confidence. So, this bet seems is failing. Because fast jump was immediately reversed, and this is not the type of action that you expect from bullish market that supposedly is forming the H&S pattern...
It leads us to suggestion of 3-Drive "Buy" instead, with potential target around 101-102K area. At least now we prefer to stay aside from any bullish positions here.
